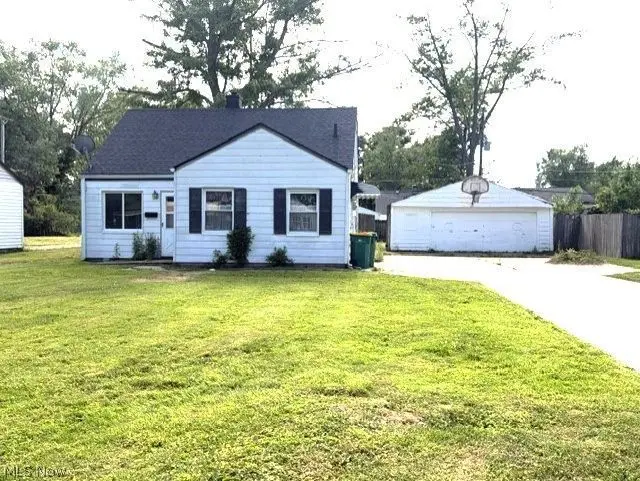
4982 Marigold Rd · Mentor, OH
Flood risk 1/10 · Minimal
- FEMA flood zone
- X (unshaded)
- Chance of flooding over 30 yrs
- 0.0%
- Est. flood insurance / yr
- $507 – $1,088
Fire risk 1/10 · Minimal
- Est. fire insurance / yr
- $713 – $1,323
Heat risk 3/10 · Minor
- Hot days now (above 94°F)
- 7 days/yr
- Hot days in 30 yrs
- 17 days/yr
Wind risk 1/10 · Minimal
- Chance of severe wind over 30 yrs
- —
Air-quality risk 4/10 · Minor
- Unhealthy air days now
- 4 days/yr
- Unhealthy air days in 30 yrs
- 5 days/yr
Risk factors via First Street. Map © Google.
Why this score? — see what drove the A- grade
The composite is a weighted blend of 9 inputs, each scored 0–100. Each bar is that input's sub-score; the figure is the points it added to the 100-point composite (weight × sub-score).
- Cash flow +30.0/30.0
- ARV discount +15.0/15.0
- 1% rule +10.0/10.0
- DSCR +10.0/10.0
- Schools +5.6/10.0
- Livability +4.2/5.0
- Rent growth +3.9/5.0
- Condition / age +2.5/5.0
- Appreciation +0.0/10.0
$99,900
🖨 Deal sheet 📄 Offer letter ✓ Due diligence
Listing remarks MLS
Features Large Living Room With Newer Carpeting Freshly Painted 2 Car Garage Fha Appraised And Repairs Done Home Warranty Easy To Show
Key facts
- Vinyl windows
- Newer roof
- Hvac system
Tags
Neighborhood map
What this means for you Summary
Snapshot
- This is a 4-bed/1.0-bath single-family listed at $100k.
Deal economics
- At list price, monthly cash flow is $909 ($11k/yr) — positive.
- The deal already cash-flows at list — no discount required.
- Meets the 1% rule at list price ($2k rent vs $100k).
- Cap rate 17.2% vs local median 3.7% in Mentor — top-decile yield for the area; either an underpriced asset or a hidden risk that comps aren't pricing in. Stress-test before assuming the spread holds.
Location & tenants
- Location reads 84/100 on livability (#53 in OH, #739 nationally) — a professional / high-income tenant draw. Strengths: schools A+, employment A+, cost of living A+; Watch: amenities D, commute F.
- Mentor Exempted Village (suburban): math 58% / reading 70% proficiency, ranked #201 of 656 in OH (top 31%) — acceptable for families but not a draw, mixed tenant base, ~2y average lease; only 19% free/reduced lunch — higher-income household profile.
- Market conditions: Rents rising fast (+5.5%/yr); 264 active listings in the ZIP; 2 comparable units currently listed for rent nearby; solid renter incomes; 448 units permitted in Lake County in 2024 (0 in 5+ unit buildings).
Forward outlook
- Local home prices are declining (-3.0%/yr); year-one equity from $691 of loan paydown is wiped out by about $3k of value loss. Plan a longer hold.
- Lake County population projected to shrink 8% by 2050 — rents likely to lag national; underwrite the cash flow, not the appreciation.
- At projected returns (-3.0% appreciation + 5.5% rent growth), your $28k cash investment doubles in ~3 years — after that, you're playing with house money.
Negotiation context
- Only 1 days on market — expect competitive offers; lowballing is unlikely to land.
- 2 sale attempts since 32y ago with the ask held roughly flat each time — persistent listings suggest the price (not the market) is what's stuck; bring a comps-based counter.
- Current owner paid $73k; 37% above their basis — modest negotiation headroom, anchor on the comps not their cost.
Risks & watch-outs
- Watch-outs: built in 1956 — expect roof / HVAC / electrical / plumbing capex.
Questions for the listing agent
- Built in 1956 — when were the roof, HVAC, electrical panel, plumbing, and water heater last replaced?
- Is there a deadline driving the sale (1031 exchange, divorce, estate, relocation)? That informs how much negotiation room exists.
- Schools are A-rated — typically a magnet for longer-tenancy family renters. What's the average tenant stay here, and is there a school-zone premium baked into asking?
- What's the average days-on-market for RENTAL listings here right now (not sales)? A rising rental-DOM trend means longer vacancies and softer asking-rent achievability than the comps imply.
- What's the recent tenant-quality profile in this submarket — average credit score on applications, eviction rate, late-payment / NSF rate, and stable-employment percentage? A property-management company in the area should have these aggregated.
- How much new for-sale + rental construction is in the pipeline within 1–3 miles? Heavy new supply typically softens prices + rents 12–24 months out; constrained supply supports both.
Investment metrics
- 1% rule
- 2.08% ✓
- Cap rate
- 17.21%
- Cash-on-cash
- 38.98%
- DSCR
- 2.73
- GRM
- 4.0
CMA / ARV
- ARV (on-the-fly)
- $193,200
- Comps found
- 12
Show comp detail 12 sales within ~0.75 mi
| Address | Dist | Beds/Ba | Sqft | Sold | Price | $/sf | Match |
|---|---|---|---|---|---|---|---|
| 4957 Belle Meadow Rd | 0.06mi | 3/1.0 (-1) | 1,019 (-8%) | 9mo | $160,000 | $157 | 72 |
| 4973 Orchard Rd | 0.16mi | 3/1.5 (-1) | 1,053 (-5%) | 10mo | $185,000 | $176 | 70 |
| 4891 Glenn Lodge Rd | 0.28mi | 3/1.0 (-1) | 1,020 (-8%) | 0mo | $210,000 | $206 | 69 |
| 4865 Robinwood Dr | 0.27mi | 3/1.0 (-1) | 1,239 (+12%) | 1mo | $174,000 | $140 | 61 |
| 4854 Marigold Rd | 0.24mi | 3/1.0 (-1) | 1,236 (+12%) | 7mo | $193,000 | $156 | 58 |
| 4808 Belle Meadow Rd | 0.34mi | 3/1.5 (-1) | 1,025 (-7%) | 12mo | $175,000 | $171 | 56 |
| 5026 Glenn Lodge Dr | 0.27mi | 3/1.5 (-1) | 1,266 (+15%) | 2mo | $199,900 | $158 | 55 |
| 4717 Farley Dr | 0.55mi | 3/2.0 (-1) | 1,080 (-2%) | 13mo | $192,000 | $178 | 51 |
| 4747 Willowbrook Dr | 0.56mi | 3/1.0 (-1) | 952 (-14%) | 3mo | $171,000 | $180 | 43 |
| 4816 Wake Robin Rd | 0.45mi | 3/1.5 (-1) | 1,256 (+14%) | 11mo | $202,500 | $161 | 40 |
| 4775 Willowbrook Dr | 0.53mi | 3/1.0 (-1) | 952 (-14%) | 10mo | $167,000 | $175 | 39 |
| 9268 Jordan Dr | 0.73mi | 3/1.0 (-1) | 960 (-13%) | 2mo | $195,000 | $203 | 38 |
Match score weights: distance 35% · size 25% · config 20% · recency 20%. Top-matched comps best support the ARV.
Projected returns pro-forma
-3.0% appreciation · 5.54% rent growth · sell at horizon
- IRR
- 38.1%
- Equity multiple
- 2.69×
- Total profit
- $47,174
- Equity at exit
- $14,895
- IRR
- 45.9%
- Equity multiple
- 5.98×
- Total profit
- $139,315
- Equity at exit
- $8,638
Cash invested: $27,972 (down + closing). Projections, not guarantees.
Landlord ↔ Tenant lean methodology
- Overall (STATE)
- 73 Landlord-Friendly
- State Ohio
- 73 Landlord-Friendly · R+6
- County
- — inherits STATE
- City
- — inherits STATE
ZIP-level market 44060
- Rents YoY
- 5.5%
- Active inventory
- 264
- Price-to-rent
- 4.0×
Monthly cashflow live
- Estimated rent
- $2,074 medium interval (Pro) →
- Mortgage (P&I)
- −$524
- Tax from tax record
- −$164 /mo · $1,971/yr
- Insurance
- −$42
- HOA
- −$0
- Vacancy / Maint / Mgmt
- −$436
- Net cashflow
- $909
Break-even live
UW: 25.0% down · 7.5% · 30yr · 1.5% tax · 5.0% vac · 8.0% maint · 8.0% mgmt
Financing live
Cash to close
- Down payment
- $24,975
- Closing costs
- $2,997
- Reserves months
- —
- Total cash needed
- —
Loan-product check · same deal, 3 products live
Conventional
25% down · 7.5% · 30yr
- Down + closing
- —
- Monthly P&I
- —
- Monthly cashflow
- —
- DSCR
- —
- Eligible?
- —
Personal DTI + credit; lowest rate.
DSCR
20% down · 8.5% · 30yr
- Down + closing
- —
- Monthly P&I
- —
- Monthly cashflow
- —
- DSCR
- —
- Eligible?
- —
No personal income docs; deal must DSCR.
Hard money
10% down · 12.0% · 12mo
- Down + closing
- —
- Monthly P&I
- —
- Monthly cashflow
- —
- DSCR
- —
- Eligible?
- —
Short-term bridge; refi at stabilization.
Rent comps 2 comps
| Address | Beds | Baths | Sqft | Rent | $/sqft | DOM | Units | Dist |
|---|---|---|---|---|---|---|---|---|
| 4851 Robinwood Dr Mentor, OH | 3.0 | 1.0 | 1314 | $1,869 | $1.42 | 11d | 1 | 0.31mi |
| 4724 Homewood Dr Mentor, OH | 3.0 | 1.0 | 924 | $1,800 | $1.95 | 1d | 1 | 0.57mi |
Listing history 3 events
-
2026-06-13status $99,900 Pending 1 DOM
-
2026-06-10remarks 556-char remark
-
2026-06-10$99,900 Active 1 DOM
ⓘ Source: listings_history table (triggers on properties + properties_extension) + one-shot
backfill from property_details.listing_events for pre-trigger history.
Tax reassessment forecast OH · Partial reset (capped growth)
- Current annual tax
- $1,971 · $164/mo
- Projected year-2 tax
- $1,971 · $164/mo
- Expected delta
- $0/yr ($0/mo · 0.0%)
ⓘ Screening estimate from a state-policy table — verify with the county assessor before closing.
Climate risk First Street
- Flood 1/10 Low FEMA zone X (unshaded) · 0% chance over 30 yrs
- Wildfire 1/10 Low
- Heat 3/10 Moderate 7 d/yr ≥94°F today · 17 d/yr by 30 yrs out
- Wind 1/10 Low
- Air quality 4/10 Moderate 4 unhealthy d/yr today · 5 by 30 yrs out
Nearby sold comps map
Loading sold comps map…
Walkable amenities ~0.75 mi
Loading nearby amenities…
Taxation est. · year 1
- Rental income
- $24,887
- − Mortgage interest
- −$5,596
- − Property taxes
- −$1,971
- − Insurance
- −$500
- − Repairs & maintenance
- −$1,991
- − Management
- −$1,991
- − Depreciation
- −$2,906
- Taxable income
- $9,932
- Est. tax owed @ 24.0%
- −$2,384
- After-tax cash flow
- $8,520/yr
For passive investors: Depreciation is non-cash, so a rental often shows a tax loss while cash-flowing — sheltering income. Rental losses are passive: they offset passive income freely, and up to $25,000/yr can offset ordinary (W-2) income if you actively participate and your MAGI is under $100k (phasing out to $0 by $150k); unused losses carry forward. On sale, claimed depreciation is recaptured at up to 25%, and gains may owe capital-gains tax (a 1031 exchange can defer both). Figures are a year-1 estimate at your 24.0% rate — not tax advice; consult a CPA.
Schools (NCES district)
- District
- Mentor Exempted Village
- NCES district ID
- 3904549
- Math proficiency
- 58% ▼ -17.00%
- Reading proficiency
- 70% ▼ -9.00%
- Median HH income
- $64,267
- Composite
- 55.71/100
- National rank
- #1221
- State rank
- #201 of 656 in OH
Livability — Mentor
- Score
- 84/100
- State rank
- #53
- US rank
- #739
Category grades
Schools grade is shown separately in the Schools card above.
Census & demographics
- Census place
- Mentor, OH
- County
- Lake County · 204,927 people
- City population
- 60,779
- Metro
- Cleveland-Elyria, OH
- Population (ZIP)
- 60,779
- Household income
- $87,599
- Rent vs Own
- Severe rent burden
- 883.0
Population outlook (Lake County) Hauer SSP2
- Today (2025)
- 230,022 people
- By 2030
- 228,151 · -0.8%
- By 2040
- 221,018 · -3.9%
- By 2050
- 212,754 · -7.5%
- By 2075
- 200,309 · -12.9%
- By 2100
- 183,315 · -20.3%
Race, ethnicity, and origin ACS 2023
- Neighborhood character
- Predominantly White (89%)
- Race & ethnicity
- White 89% Two or more races 4% Hispanic / Latino 3% Asian 3% Black 2%
- Common ancestry
- Romanian 7% Italian 2% Lithuanian 2%
- Foreign-born
- 6% · Canada, Vietnam, China
- Languages at home
- 93% English-only · Other Indo-European 2% Russian/Polish/Slavic 2% Spanish 1%
Political lean MEDSL · Lake
- 2024 margin
- R (+14.3) · D 42.4% · R 56.7%
- 2008→2024 swing
- -15.2pp toward R · 2008: 0.8pp · 2024: -14.3pp
- All cycles
- 2024: R+14.3 2020: R+13.6 2016: R+15.6 2012: R+1.7 2008: D+0.8
Not yet ingested
- Civics
- —
Market trends
- HPI YoY
- ▼ -203.36%
- Current HPI
- 188.9887
- Rent YoY
- ▲ 5.54%
- Metro
- Cleveland-Elyria, OH
- State GDP YoY
- ▲ 1.98%
- F500 in state
- 48
Industry mix (Fortune 500 HQ in OH)
| Industry | F500 HQs | Revenue |
|---|---|---|
| Insurance | 3 | $145B |
|
||
| Industrial Machinery | 3 | $49B |
|
||
| Financial Services | 3 | $24B |
|
||
| Consumer Goods | 2 | $93B |
|
||
| Aerospace / Defense | 2 | $47B |
|
||
| Utilities | 2 | $33B |
|
||
Price history
+35.2% since first listed4 events — show timeline
- 2026-06-09 Listed $99,900 MLSNOW
- 1995-08-30 Sold (Public Records) $73,000 Public Records
- 1995-08-30 Sold (MLS) $73,000 MLSNOW
- 1994-11-19 Listed $73,900 MLSNOW
Property tax history
+1.0%/yrLatest (2025): $1,971 · -2.5% YoY. Source: county tax records.
Cash-flow waterfall
monthlySold comps — $/sqft
last 12 mo · ≤1 miLoading sold comps…