611 Park Ln #611 · Lufkin, TX
Flood risk 1/10 · Minimal
- FEMA flood zone
- X (unshaded)
- Chance of flooding over 30 yrs
- 0.0%
- Est. flood insurance / yr
- $507 – $1,088
Fire risk 3/10 · Minor
- Est. fire insurance / yr
- $1,222 – $2,270
Heat risk 8/10 · Major
- Hot days now (above 110°F)
- 7 days/yr
- Hot days in 30 yrs
- 24 days/yr
Wind risk 8/10 · Major
- Chance of severe wind over 30 yrs
- 80.0%
Air-quality risk 1/10 · Minimal
- Unhealthy air days now
- 0 days/yr
- Unhealthy air days in 30 yrs
- 0 days/yr
Risk factors via First Street. Map © Google.
Why this score? — see what drove the C+ grade
The composite is a weighted blend of 9 inputs, each scored 0–100. Each bar is that input's sub-score; the figure is the points it added to the 100-point composite (weight × sub-score).
- Cash flow +22.2/30.0
- ARV discount +15.0/15.0
- DSCR +7.1/10.0
- 1% rule +5.8/10.0
- Livability +3.6/5.0
- Schools +3.3/10.0
- Rent growth +2.5/5.0
- Condition / age +2.2/5.0
- Appreciation +0.0/10.0
$160,000
🖨 Deal sheet (PDF) 📄 Offer letter ✓ Due diligence
Listing remarks MLS
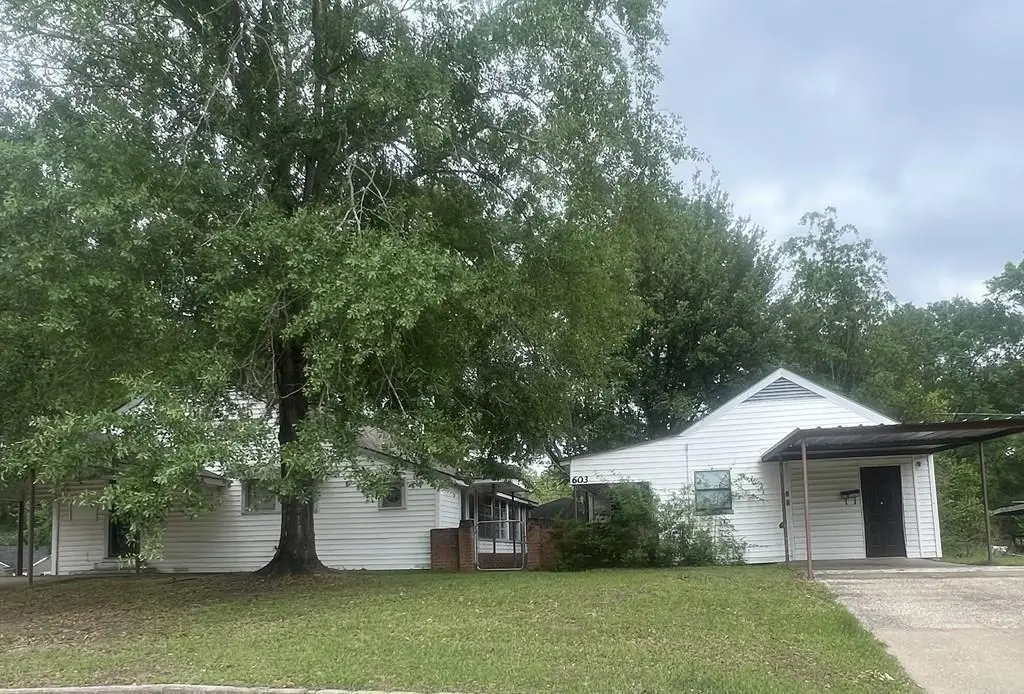
Investors Take Notice! This property features two homes that could be rented together or separately. The main home has 3 Bedrooms, 1 Full Bath, 2 Large Living Areas, cathedral ceiling, dining room, a spacious storage/laundry room and has tons of closet space! The 2nd home was update in 2022 and has 2 Bedrooms and 1 Full Bath with an open concept living area and a large utility room. They both have an attached carport and concrete driveway! Conveniently located inside the city limits of Lufkin and close to all amenities like shopping and medical centers!
Key facts
- 7,841 sq ft lot
- Built 1939
- Listed 64 days
Neighborhood map
What this means for you Summary
Snapshot
- This is a 5-bed/2.0-bath single-family listed at $160k. Condition is rated fair.
Deal economics
- At list price, monthly cash flow is $260 ($3k/yr) — positive.
- The deal already cash-flows at list — no discount required.
- Meets the 1% rule at list price ($2k rent vs $160k).
- Recommended offer: $150k (6.0% below list) — sets the bar for market timing.
- Cap rate 8.2% vs local median 3.5% in Lufkin — top-decile yield for the area; either an underpriced asset or a hidden risk that comps aren't pricing in. Stress-test before assuming the spread holds.
Location & tenants
- Location reads 72/100 on livability (#240 in TX) — a middle-class / working-renter tenant base. Strengths: cost of living A+, housing A+, health & safety A+; Watch: crime F, commute F, employment D-.
- Lufkin ISD (town): math 39% / reading 39% proficiency, ranked #446 of 826 in TX (top 54%) — families likely to look elsewhere, expect single-tenant / working-renter base with shorter leases; 68% free/reduced lunch — lower-income household profile, screen leases tightly.
- Zoned schools: Trout Pri (252 students, 95% FRL); Lufkin Middle (math 38% / reading 38%, grade F, #717 of 1,662 statewide, top 44%, 1,487 students, 89% FRL); Lufkin H S (math 49% / reading 45%, grade D-, #591 of 1,632 statewide, top 38%, 2,135 students, 85% FRL) — zoned schools average 90% FRL vs 68% district-wide (21 pts higher); higher-poverty schools than district average — tighter screening recommended.
- Market conditions: 296 active listings in the ZIP; 120 units permitted in Angelina County in 2024 (0 in 5+ unit buildings).
- This rent runs 34% of the median local income ($60k/yr) — at the standard rent-burdened threshold; future hikes will face affordability resistance.
Forward outlook
- Local home prices are declining (-3.0%/yr); year-one equity from $1k of loan paydown is wiped out by about $5k of value loss. Plan a longer hold.
Negotiation context
- It's been on market 65 days — a 6% lower offer ($150k) is reasonable based on typical stale-listing flexibility.
Risks & watch-outs
- Watch-outs: built in 1939 — expect roof / HVAC / electrical / plumbing capex.
- Climate carrying-cost: severe wind risk, 80% chance of damaging wind over 30y; extreme-heat days projected 7→24/yr by 2055 (HVAC capex compounding) — expect insurance premiums to compound above CPI over the hold.
Questions for the listing agent
- It's been on market 65 days. Have you received any prior offers? Is the seller open to a 6% concession, seller financing, or rate buy-down credit?
- Have any recent inspections been done? Can we get a copy of the seller's disclosures and any deferred-maintenance estimates?
- Built in 1939 — when were the roof, HVAC, electrical panel, plumbing, and water heater last replaced?
- Why hasn't it sold? Are there any deal-killer items the seller is aware of (foundation, flood, title, zoning, code violations)?
- Is there a deadline driving the sale (1031 exchange, divorce, estate, relocation)? That informs how much negotiation room exists.
- Crime grade is F in this area — have there been break-ins, vandalism, or insurance claims at this property in the last 3 years? What carrier currently insures it and at what premium?
- What's the average days-on-market for RENTAL listings here right now (not sales)? A rising rental-DOM trend means longer vacancies and softer asking-rent achievability than the comps imply.
- What's the recent tenant-quality profile in this submarket — average credit score on applications, eviction rate, late-payment / NSF rate, and stable-employment percentage? A property-management company in the area should have these aggregated.
- How much new for-sale + rental construction is in the pipeline within 1–3 miles? Heavy new supply typically softens prices + rents 12–24 months out; constrained supply supports both.
Investment metrics
- 1% rule
- 1.08% ✓
- Cap rate
- 8.24%
- Cash-on-cash
- 6.96%
- DSCR
- 1.31
- GRM
- 7.7
CMA / ARV
- ARV (median comp)
- $197,349
- List price
- $160,000
- Delta
- -18.93%
- Verdict
- UNDERPRICED
- Comps
- 4 within 1.0 mi
Show comp detail 1 sale within ~0.75 mi
| Address | Dist | Beds/Ba | Sqft | Sold | Price | $/sf | Match |
|---|---|---|---|---|---|---|---|
| 808 Newsom Ave | 0.67mi | 4/2.0 (-1) | 1,752 (-12%) | 4mo | $135,000 | $77 | 40 |
Match score weights: distance 35% · size 25% · config 20% · recency 20%. Top-matched comps best support the ARV.
Projected returns pro-forma
-3.0% appreciation · 3.0% rent growth · sell at horizon
- IRR
- -5.6%
- Equity multiple
- 0.79×
- Total profit
- $-9,342
- Equity at exit
- $23,857
- IRR
- 4.1%
- Equity multiple
- 1.30×
- Total profit
- $13,292
- Equity at exit
- $13,834
Cash invested: $44,800 (down + closing). Projections, not guarantees.
Landlord ↔ Tenant lean methodology
- Overall (STATE)
- 87 Strongly Landlord-Friendly
- State Texas
- 87 Strongly Landlord-Friendly · R+5
- County
- — inherits STATE
- City
- — inherits STATE
ZIP-level market 75904
- Home prices YoY
- -25.1%
- Active inventory
- 296
- Price-to-rent
- 7.7×
Monthly cashflow live
- Estimated rent
- $1,729 medium interval (Pro) →
- Mortgage (P&I)
- −$839
- Tax est. 1.5%
- −$200 /mo · $2,400/yr
- Insurance
- −$67
- HOA
- −$0
- Vacancy / Maint / Mgmt
- −$363
- Net cashflow
- $260
Break-even live
Sensitivity live
| Price | -10% $371 | -5% $315 | +0% $260 | +5% $205 | +10% $149 |
|---|---|---|---|---|---|
| Rent | -10% $123 | -5% $192 | +0% $260 | +5% $328 | +10% $397 |
| Rate | -1.0pp $341 | -0.5pp $301 | base $260 | +0.5pp $219 | +1.0pp $176 |
UW: 25.0% down · 7.5% · 30yr · 1.5% tax · 5.0% vac · 8.0% maint · 8.0% mgmt
Financing live
Cash to close
- Down payment
- $40,000
- Closing costs
- $4,800
- Reserves months
- —
- Total cash needed
- —
Loan-product check · same deal, 3 products live
Conventional
25% down · 7.5% · 30yr
- Down + closing
- —
- Monthly P&I
- —
- Monthly cashflow
- —
- DSCR
- —
- Eligible?
- —
Personal DTI + credit; lowest rate.
DSCR
20% down · 8.5% · 30yr
- Down + closing
- —
- Monthly P&I
- —
- Monthly cashflow
- —
- DSCR
- —
- Eligible?
- —
No personal income docs; deal must DSCR.
Hard money
10% down · 12.0% · 12mo
- Down + closing
- —
- Monthly P&I
- —
- Monthly cashflow
- —
- DSCR
- —
- Eligible?
- —
Short-term bridge; refi at stabilization.
Listing history 17 events
-
2026-06-19days on market $160,000 Active 65 DOM
-
2026-06-18days on market $160,000 Active 64 DOM
-
2026-06-17days on market $160,000 Active 63 DOM
-
2026-06-16days on market $160,000 Active 62 DOM
-
2026-06-15days on market $160,000 Active 61 DOM
-
2026-06-14days on market $160,000 Active 59 DOM
-
2026-06-13days on market $160,000 Active 58 DOM
-
2026-06-10days on market $160,000 Active 56 DOM
-
2026-06-09days on market $160,000 Active 55 DOM
-
2026-06-08days on market $160,000 Active 54 DOM
-
2026-06-07days on market $160,000 Active 53 DOM
-
2026-06-03days on market $160,000 Active 49 DOM
-
2026-06-02days on market $160,000 Active 48 DOM
-
2026-06-01days on market $160,000 Active 47 DOM
-
2026-05-31days on market $160,000 Active 46 DOM
-
2026-05-30days on market $160,000 Active 45 DOM
-
2026-04-15$160,000 Active 562-char remark
Show marketing remark (562 chars)
Investors Take Notice! This property features two homes that could be rented together or separately. The main home has 3 Bedrooms, 1 Full Bath, 2 Large Living Areas, cathedral ceiling, dining room, a spacious storage/laundry room and has tons of closet space! The 2nd home was update in 2022 and has 2 Bedrooms and 1 Full Bath with an open concept living area and a large utility room. They both have an attached carport and concrete driveway! Conveniently located inside the city limits of Lufkin and close to all amenities like shopping and medical centers!
ⓘ Source: listings_history table (triggers on properties + properties_extension) + one-shot
backfill from property_details.listing_events for pre-trigger history.
Climate risk First Street
- Flood 1/10 Low FEMA zone X (unshaded) · 0% chance over 30 yrs
- Wildfire 3/10 Moderate
- Heat 8/10 Severe 7 d/yr ≥110°F today · 24 d/yr by 30 yrs out
- Wind 8/10 Severe 80% chance of damaging wind over 30 yrs
- Air quality 1/10 Low 0 unhealthy d/yr today · 0 by 30 yrs out
Nearby sold comps map
Loading sold comps map…
Walkable amenities ~0.75 mi
Loading nearby amenities…
Taxation est. · year 1
- Rental income
- $20,745
- − Mortgage interest
- −$8,962
- − Property taxes
- −$2,400
- − Insurance
- −$800
- − Repairs & maintenance
- −$1,660
- − Management
- −$1,660
- − Depreciation
- −$4,655
- Taxable income
- $609
- Est. tax owed @ 24.0%
- −$146
- After-tax cash flow
- $2,974/yr
For passive investors: Depreciation is non-cash, so a rental often shows a tax loss while cash-flowing — sheltering income. Rental losses are passive: they offset passive income freely, and up to $25,000/yr can offset ordinary (W-2) income if you actively participate and your MAGI is under $100k (phasing out to $0 by $150k); unused losses carry forward. On sale, claimed depreciation is recaptured at up to 25%, and gains may owe capital-gains tax (a 1031 exchange can defer both). Figures are a year-1 estimate at your 24.0% rate — not tax advice; consult a CPA.
Condition & rehab AI · 12 photos
This property requires moderate renovations to update the kitchen and bathrooms, and paint the interior walls. The home is located in a convenient location and has two homes that could be rented together or separately.
Repairs flagged
- Moderate kitchen cabinets — dated and in need of replacement
- Moderate kitchen appliances — outdated and in need of replacement
- Moderate bathroom fixtures — basic and in need of updating
- Moderate exterior siding — moderate wear and tear
Value-add opportunities
- Both update kitchen cabinets and appliances — modernizing the kitchen would appeal to both buyers and renters
- Both update bathroom fixtures — modernizing the bathrooms would appeal to both buyers and renters
- Both paint interior walls — fresh paint would improve the overall appearance and appeal of the home
Renovation cost estimate screening
| Repair item | Severity | Est. cost |
|---|---|---|
| kitchen cabinets · dated and in need of replacement | Moderate | $3,000–15,000 |
| kitchen appliances · outdated and in need of replacement | Moderate | $3,000–15,000 |
| bathroom fixtures · basic and in need of updating | Moderate | $3,000–15,000 |
| exterior siding · moderate wear and tear | Moderate | $3,000–15,000 |
| Total estimated repair cost · 4 items | $12,000–60,000 |
Value-add ROI direction
- Both update kitchen cabinets and appliances — modernizing the kitchen would appeal to both buyers and renters ↑
- Both update bathroom fixtures — modernizing the bathrooms would appeal to both buyers and renters ↑
- Both paint interior walls — fresh paint would improve the overall appearance and appeal of the home ↑
ⓘ Cost ranges are severity-bucket heuristics (US national rule-of-thumb). Get contractor quotes + a written scope before underwriting a rehab budget.
Schools (NCES district)
- District
- Lufkin ISD
- NCES district ID
- 4828550
- Math proficiency
- 39% ▼ -9.00%
- Reading proficiency
- 39% ▬ 0.00%
- Median HH income
- $41,009
- Composite
- 32.81/100
- National rank
- #5625
- State rank
- #446 of 826 in TX
Livability — Lufkin
- Score
- 72/100
- State rank
- #240
- US rank
- #5792
Category grades
Schools grade is shown separately in the Schools card above.
Census & demographics
- Census place
- Lufkin, TX
- County
- Angelina County · 62,696 people
- City population
- 62,696
- Metro
- Lufkin, TX
- Population (ZIP)
- 34,462
- Household income
- $60,205
- Rent vs Own
- Severe rent burden
- 1159.0
Population outlook (Angelina County) Hauer SSP2
- Today (2025)
- 90,174 people
- By 2030
- 90,697 · +0.6%
- By 2040
- 91,291 · +1.2%
- By 2050
- 91,168 · +1.1%
- By 2075
- 88,961 · -1.3%
- By 2100
- 80,590 · -10.6%
Race, ethnicity, and origin ACS 2023
- Neighborhood character
- Diverse neighborhood (Simpson 0.58)
- Race & ethnicity
- White 60% Hispanic / Latino 19% Black 16% Two or more races 12% Native American 2%
- Hispanic origin (detail)
- Mexican 17%
- Common ancestry
- Romanian 2% Slovak 1% Lithuanian 1%
- Foreign-born
- 6% · Canada
- Languages at home
- 86% English-only · Spanish 14%
Political lean MEDSL · Angelina
- 2024 margin
- Solid R (+52.0) · D 23.7% · R 75.7%
- 2008→2024 swing
- -17.0pp toward R · 2008: -35.0pp · 2024: -52.0pp
- All cycles
- 2024: R+52.0 2020: R+46.1 2016: R+47.3 2012: R+43.9 2008: R+35.0
Not yet ingested
- Civics
- —
Market trends
- HPI YoY
- ▼ -71.71%
- Current HPI
- 213.4236
- Rent YoY
- —
- Metro
- Lufkin, TX
- State GDP YoY
- ▲ 3.95%
- F500 in state
- 110
Industry mix (Fortune 500 HQ in TX)
| Industry | F500 HQs | Revenue |
|---|---|---|
| Energy | 16 | $1,198B |
|
||
| Technology | 5 | $198B |
|
||
| Engineering / Construction | 4 | $72B |
|
||
| Energy Services | 3 | $60B |
|
||
| Utilities | 3 | $41B |
|
||
| Healthcare | 2 | $330B |
|
||
Price history
1 event — show timeline
- 2026-04-15 Listed $160,000 Deep East Texas MLS
Cash-flow waterfall
monthlySold comps — $/sqft
last 12 mo · ≤1 miLoading sold comps…