 Multi-family
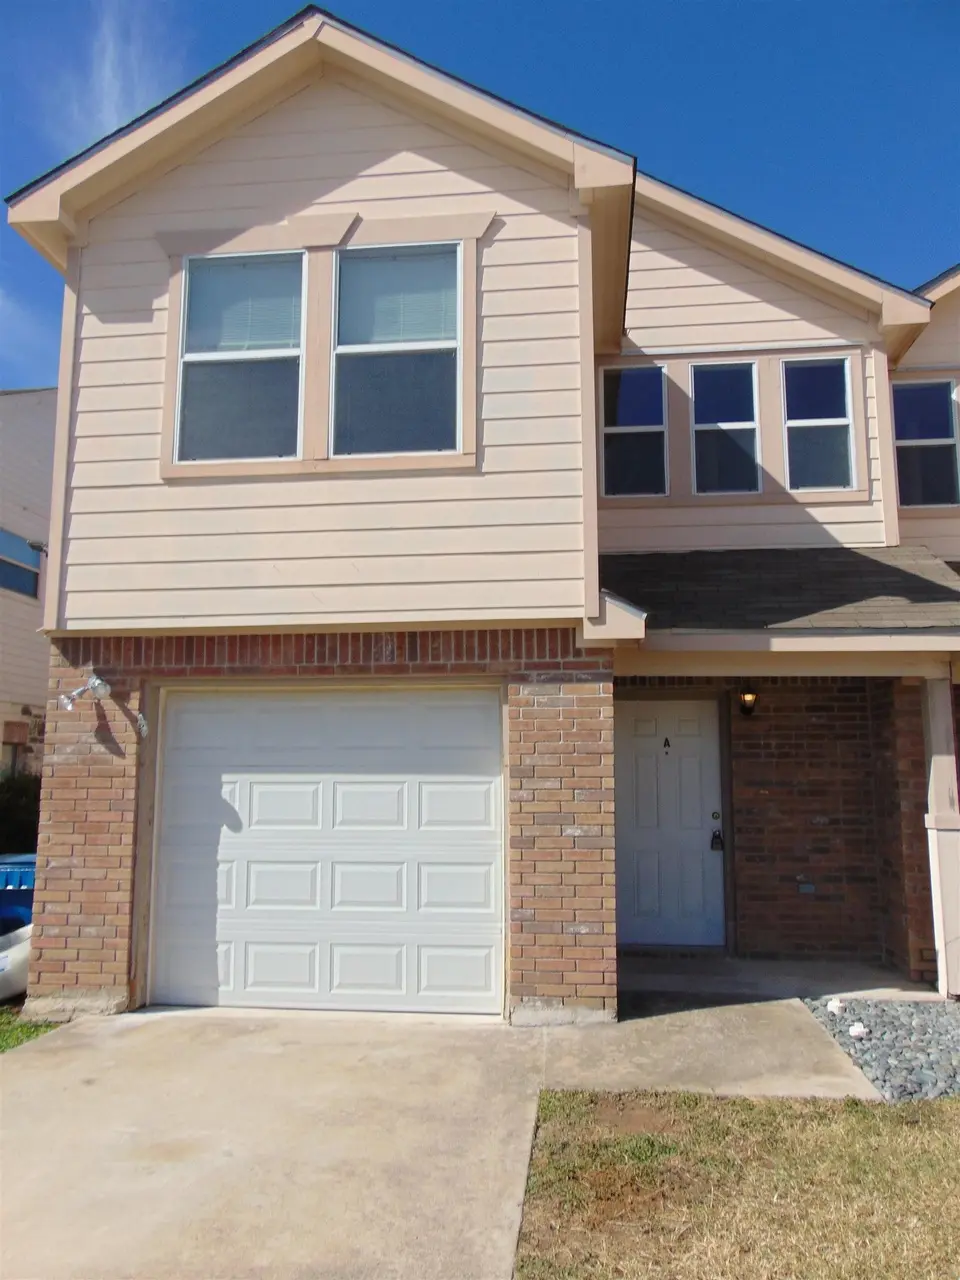
1600 B Claremont Cir · Marble Falls, TX
Flood risk 1/10 · Minimal
- FEMA flood zone
- X (unshaded)
- Chance of flooding over 30 yrs
- 0.0%
- Est. flood insurance / yr
- $507 – $1,088
Fire risk 4/10 · Minor
- Est. fire insurance / yr
- $1,222 – $2,270
Heat risk 8/10 · Major
- Hot days now (above 107°F)
- 7 days/yr
- Hot days in 30 yrs
- 24 days/yr
Wind risk 6/10 · Moderate
- Chance of severe wind over 30 yrs
- 57.0%
Air-quality risk 1/10 · Minimal
- Unhealthy air days now
- 0 days/yr
- Unhealthy air days in 30 yrs
- 0 days/yr
Risk factors via First Street. Map © Google.
Why this score? — see what drove the D grade
The composite is a weighted blend of 9 inputs, each scored 0–100. Each bar is that input's sub-score; the figure is the points it added to the 100-point composite (weight × sub-score).
- Cash flow +15.0/30.0
- ARV discount +7.5/15.0
- 1% rule +5.0/10.0
- DSCR +5.0/10.0
- Livability +3.5/5.0
- Schools +3.0/10.0
- Condition / age +2.5/5.0
- Rent growth +2.3/5.0
- Appreciation +0.0/10.0
$1,550
🖨 Deal sheet (PDF) 📄 Offer letter ✓ Due diligence
Multi-family units
County records classify this as Multi-Family (2-4 Unit). Listing-text estimate: 1 unit. estimate disagrees with records
Listing remarks
Enjoy extra privacy in this charming 3-bedroom, 2.5-bath home perfectly situated at the end of a quiet cul-de-sac. The interior has been refreshed with brand-new flooring throughout and features a modern kitchen complete with sleek granite countertops and high-quality custom cabinetry. Includes a convenient single-car attached garage with an automatic opener. This home is move-in ready.
Key facts
- Custom cabinetry
- Brand-new flooring
- Quiet cul-de-sac
Tags
Property features AI
Exterior
- Utilities: Public water; Public sewer
- Home design: Duplex (residential income)
- Construction: Wood siding; Synthetic stucco; Slab foundation
- Exterior features: Composition roof
Interior
- Kitchen: Dishwasher; Disposal; Electric range
- Flooring: Carpet; Laminate
- Heating & cooling: Central heating; Ceiling fan(s); Cooling available
- Interior features: Ceiling fan(s); Central heating; Has heating; Has cooling
- Laundry & utility: Electric dryer hookup
Neighborhood map
What this means for you Summary
Snapshot
- This is a 3-bed/2.0-bath multifamily listed at $2k.
Deal economics
- At list price, monthly cash flow is $3k ($36k/yr) — positive.
- The deal already cash-flows at list — no discount required.
- Meets the 1% rule at list price ($4k rent vs $2k).
- Recommended offer: $2k (1.5% below list) — sets the bar for market timing.
- Cap rate 2318.5% vs local median 3.8% in Marble Falls — top-decile yield for the area; either an underpriced asset or a hidden risk that comps aren't pricing in. Stress-test before assuming the spread holds.
Location & tenants
- Location reads 70/100 on livability (#367 in TX) — a middle-class / working-renter tenant base. Strengths: cost of living A+, health & safety A+, housing A; Watch: crime C-, employment D, amenities F.
- Marble Falls ISD (town): math 32% / reading 38% proficiency, ranked #511 of 826 in TX (top 62%) — families likely to look elsewhere, expect single-tenant / working-renter base with shorter leases.
- Zoned schools: Marble Falls El (math 41% / reading 38%, grade F, #1,545 of 4,322 statewide, top 38%, 570 students, 70% FRL); Marble Falls Middle (math 32% / reading 37%, grade F, #858 of 1,662 statewide, top 54%, 911 students, 67% FRL); Marble Falls H S (math 29% / reading 47%, grade F, #880 of 1,632 statewide, top 54%, 1,145 students, 61% FRL).
- Market conditions: Rents soft (-0.6%/yr); 764 active listings in the ZIP; 14 comparable units currently listed for rent nearby; rentals at typical pace (median 25d on market — plan ~3-4 weeks tenant-placement turnaround); 891 units permitted in Burnet County in 2024 (76 in 5+ unit buildings).
- At $3,794/mo this rent would consume 61% of the median local household income ($74k/yr) (locally 354% of renters already pay >50% of income on rent) — very limited rent-growth headroom before tenants either downsize or default.
Forward outlook
- Local home prices are declining (-3.0%/yr); year-one equity from $10 of loan paydown is wiped out by about $46 of value loss. Plan a longer hold.
- Burnet County population projected at +22% by 2050 — long-run rental-demand tailwind backs the buy-and-hold thesis.
- At projected returns (-3.0% appreciation + 0.0% rent growth), your $434 cash investment doubles in ~1 year — after that, you're playing with house money.
Negotiation context
- It's been on market 15 days — a 2% lower offer ($2k) is reasonable based on typical stale-listing flexibility.
Risks & watch-outs
- Climate carrying-cost: major wind risk, 57% chance of damaging wind over 30y; extreme-heat days projected 7→24/yr by 2055 (HVAC capex compounding) — expect insurance premiums to compound above CPI over the hold.
Questions for the listing agent
- Is there a deadline driving the sale (1031 exchange, divorce, estate, relocation)? That informs how much negotiation room exists.
- Schools are D-rated, which usually means shorter tenancies and higher turnover. Who's the typical renter profile here, and what's been the actual vacancy rate?
- The area grade is low — what's the realistic commute time and amenity access for the typical tenant pool here? Any planned neighborhood developments (good or bad) we should know about?
- What's the average days-on-market for RENTAL listings here right now (not sales)? A rising rental-DOM trend means longer vacancies and softer asking-rent achievability than the comps imply.
- What's the recent tenant-quality profile in this submarket — average credit score on applications, eviction rate, late-payment / NSF rate, and stable-employment percentage? A property-management company in the area should have these aggregated.
- How much new apartment / multifamily construction is in the pipeline within 1–3 miles? Heavy new supply (>2% of stock underway) typically softens rents 12–24 months out; light construction supports rent growth.
Investment metrics
- 1% rule
- 244.77% ✓
- Cap rate
- 2318.46%
- Cash-on-cash
- 8257.74%
- DSCR
- 368.42
- GRM
- 0.0
CMA / ARV
No comps found within radius.
Projected returns pro-forma
-3.0% appreciation · 0.0% rent growth · sell at horizon
- IRR
- —
- Equity multiple
- 413.22×
- Total profit
- $178,902
- Equity at exit
- $231
- IRR
- —
- Equity multiple
- 825.84×
- Total profit
- $357,980
- Equity at exit
- $134
Cash invested: $434 (down + closing). Projections, not guarantees.
Landlord ↔ Tenant lean methodology
- Overall (STATE)
- 87 Strongly Landlord-Friendly
- State Texas
- 87 Strongly Landlord-Friendly · R+5
- County
- — inherits STATE
- City
- — inherits STATE
ZIP-level market 78654
- Home prices YoY
- -31.8%
- Rents YoY
- -0.6%
- Active inventory
- 764
- Price-to-rent
- 0.1×
Monthly cashflow live
- Estimated rent
- $3,794 medium interval (Pro) →
- Mortgage (P&I)
- −$8
- Tax est. 1.5%
- −$2 /mo · $23/yr
- Insurance
- −$1
- HOA
- −$0
- Vacancy / Maint / Mgmt
- −$797
- Net cashflow
- $2,987
Break-even live
Sensitivity live
| Price | -10% $2,988 | -5% $2,987 | +0% $2,987 | +5% $2,986 | +10% $2,985 |
|---|---|---|---|---|---|
| Rent | -10% $2,687 | -5% $2,837 | +0% $2,987 | +5% $3,136 | +10% $3,286 |
| Rate | -1.0pp $2,987 | -0.5pp $2,987 | base $2,987 | +0.5pp $2,986 | +1.0pp $2,986 |
2-unit breakdown (identical units grouped — click to expand)
| Units | Beds | Baths | Est. rent |
|---|---|---|---|
| 1× unit | 3 | 2 | $1,897 |
| 1× unit | 3 | 1 | $1,897 |
| Total (2 units) | $3,794 | ||
UW: 25.0% down · 7.5% · 30yr · 1.5% tax · 5.0% vac · 8.0% maint · 8.0% mgmt
Financing live
Cash to close
- Down payment
- $388
- Closing costs
- $46
- Reserves months
- —
- Total cash needed
- —
Loan-product check · same deal, 3 products live
Conventional
25% down · 7.5% · 30yr
- Down + closing
- —
- Monthly P&I
- —
- Monthly cashflow
- —
- DSCR
- —
- Eligible?
- —
Personal DTI + credit; lowest rate.
DSCR
20% down · 8.5% · 30yr
- Down + closing
- —
- Monthly P&I
- —
- Monthly cashflow
- —
- DSCR
- —
- Eligible?
- —
No personal income docs; deal must DSCR.
Hard money
10% down · 12.0% · 12mo
- Down + closing
- —
- Monthly P&I
- —
- Monthly cashflow
- —
- DSCR
- —
- Eligible?
- —
Short-term bridge; refi at stabilization.
Rent comps 14 comps
| Address | Beds | Baths | Sqft | Rent | $/sqft | DOM | Units | Dist |
|---|---|---|---|---|---|---|---|---|
| 702 Claremont Pkwy Unit B Marble Falls, TX | 3.0 | 2.0 | 1368 | $1,595 | $1.17 | 45d | 1 | 0.02mi |
| 1511 N Claremont Cir Unit A Marble Falls, TX | 3.0 | 2.0 | 1200 | $1,475 | $1.23 | 25d | 1 | 0.05mi |
| 719 Claremont Pkwy Unit A Marble Falls, TX | 3.0 | 2.5 | 1368 | $1,645 | $1.20 | 45d | 1 | 0.07mi |
| 725 Claremont Pkwy Unit A Marble Falls, TX | 3.0 | 2.5 | 1402 | $1,595 | $1.14 | 25d | 1 | 0.10mi |
| 2003 Bluebonnet Dr Marble Falls, TX | 3.0 | 2.0 | 1334 | $1,550 | $1.16 | 25d | 1 | 0.67mi |
| 1601 Mustang Dr Marble Falls, TX | 1.0–3.0 | 1.0–2.5 | 1049 | $2,270 | $2.16 | 0d | 79 | 0.72mi |
| 1112 Northwood Dr Marble Falls, TX | 2.0 | 1.0 | 923 | $1,350 | $1.46 | 25d | 1 | 0.78mi |
| 1700 Mustang Dr Unit 208 Marble Falls, TX | 3.0 | 2.0 | 1140 | $1,200 | $1.05 | 19d | 1 | 0.80mi |
| 107 Peruna Dr Marble Falls, TX | 3.0 | 2.5 | 1201 | $1,650 | $1.37 | 45d | 1 | 0.84mi |
| 111 Peruna Dr Marble Falls, TX | 3.0 | 2.5 | 1219 | $1,595 | $1.31 | 16d | 1 | 0.85mi |
| 125 Peruna Dr Marble Falls, TX | 3.0 | 2.5 | 1210 | $1,700 | $1.40 | 25d | 1 | 0.88mi |
| 224 Peruna Dr Marble Falls, TX | 3.0 | 2.5 | 1201 | $1,500 | $1.25 | 45d | 1 | 0.94mi |
| 304 Avenue P Unit A Marble Falls, TX | 3.0 | 2.0 | 1500 | $2,200 | $1.47 | 16d | 1 | 1.12mi |
| 1611 2nd St Marble Falls, TX | 3.0 | 1.0 | 975 | $1,395 | $1.43 | 25d | 1 | 1.22mi |
Listing history 2 events
-
2026-05-05status Pending
-
2026-04-20$1,550 Active
ⓘ Source: listings_history table (triggers on properties + properties_extension) + one-shot
backfill from property_details.listing_events for pre-trigger history.
Climate risk First Street
- Flood 1/10 Low FEMA zone X (unshaded) · 0% chance over 30 yrs
- Wildfire 4/10 Moderate
- Heat 8/10 Severe 7 d/yr ≥107°F today · 24 d/yr by 30 yrs out
- Wind 6/10 Major 57% chance of damaging wind over 30 yrs
- Air quality 1/10 Low 0 unhealthy d/yr today · 0 by 30 yrs out
Nearby sold comps map
Loading sold comps map…
Walkable amenities ~0.75 mi
Loading nearby amenities…
Taxation est. · year 1
- Rental income
- $45,528
- − Mortgage interest
- −$87
- − Property taxes
- −$23
- − Insurance
- −$8
- − Repairs & maintenance
- −$3,642
- − Management
- −$3,642
- − Depreciation
- −$45
- Taxable income
- $38,081
- Est. tax owed @ 24.0%
- −$9,139
- After-tax cash flow
- $26,699/yr
For passive investors: Depreciation is non-cash, so a rental often shows a tax loss while cash-flowing — sheltering income. Rental losses are passive: they offset passive income freely, and up to $25,000/yr can offset ordinary (W-2) income if you actively participate and your MAGI is under $100k (phasing out to $0 by $150k); unused losses carry forward. On sale, claimed depreciation is recaptured at up to 25%, and gains may owe capital-gains tax (a 1031 exchange can defer both). Figures are a year-1 estimate at your 24.0% rate — not tax advice; consult a CPA.
Schools (NCES district)
- District
- Marble Falls ISD
- NCES district ID
- 4829010
- Math proficiency
- 32% ▼ -8.00%
- Reading proficiency
- 38% ▼ -4.00%
- Median HH income
- $49,663
- Composite
- 30.3/100
- National rank
- #6278
- State rank
- #511 of 826 in TX
Livability — Marble Falls
- Score
- 70/100
- State rank
- #367
- US rank
- #7802
Category grades
Schools grade is shown separately in the Schools card above.
Census & demographics
- Census place
- Marble Falls, TX
- County
- Burnet County · 35,210 people
- City population
- 20,650
- Metro
- Austin-Round Rock-Georgetown, TX
- Population (ZIP)
- 20,650
- Household income
- $74,130
- Rent vs Own
- Severe rent burden
- 354.0
Population outlook (Burnet County) Hauer SSP2
- Today (2025)
- 50,492 people
- By 2030
- 52,995 · +5.0%
- By 2040
- 57,528 · +13.9%
- By 2050
- 61,444 · +21.7%
- By 2075
- 71,098 · +40.8%
- By 2100
- 74,634 · +47.8%
Race, ethnicity, and origin ACS 2023
- Neighborhood character
- Predominantly White (68%)
- Race & ethnicity
- White 68% Hispanic / Latino 28% Two or more races 8%
- Hispanic origin (detail)
- Mexican 24%
- Common ancestry
- Serbian 2% Italian 2% Slovak 2%
- Foreign-born
- 8% · Canada
- Languages at home
- 81% English-only · Spanish 18% Other Indo-European 1%
Political lean MEDSL · Burnet
- 2024 margin
- Solid R (+55.7) · D 21.7% · R 77.4%
- 2008→2024 swing
- -11.6pp toward R · 2008: -44.1pp · 2024: -55.7pp
- All cycles
- 2024: R+55.7 2020: R+53.1 2016: R+56.8 2012: R+54.6 2008: R+44.1
Not yet ingested
- Civics
- —
Market trends
- HPI YoY
- ▼ -118.02%
- Current HPI
- 252.9861
- Rent YoY
- ▼ -0.62%
- Metro
- Austin-Round Rock-Georgetown, TX
- State GDP YoY
- ▲ 3.95%
- F500 in state
- 110
Industry mix (Fortune 500 HQ in TX)
| Industry | F500 HQs | Revenue |
|---|---|---|
| Energy | 16 | $1,198B |
|
||
| Technology | 5 | $198B |
|
||
| Engineering / Construction | 4 | $72B |
|
||
| Energy Services | 3 | $60B |
|
||
| Utilities | 3 | $41B |
|
||
| Healthcare | 2 | $330B |
|
||
Price history
2 events — show timeline
- 2026-05-05 Pending — HLMLS as distributed by MLS GRID
- 2026-04-20 Listed $1,550 HLMLS as distributed by MLS GRID
Cash-flow waterfall
monthlySold comps — $/sqft
last 12 mo · ≤1 miLoading sold comps…