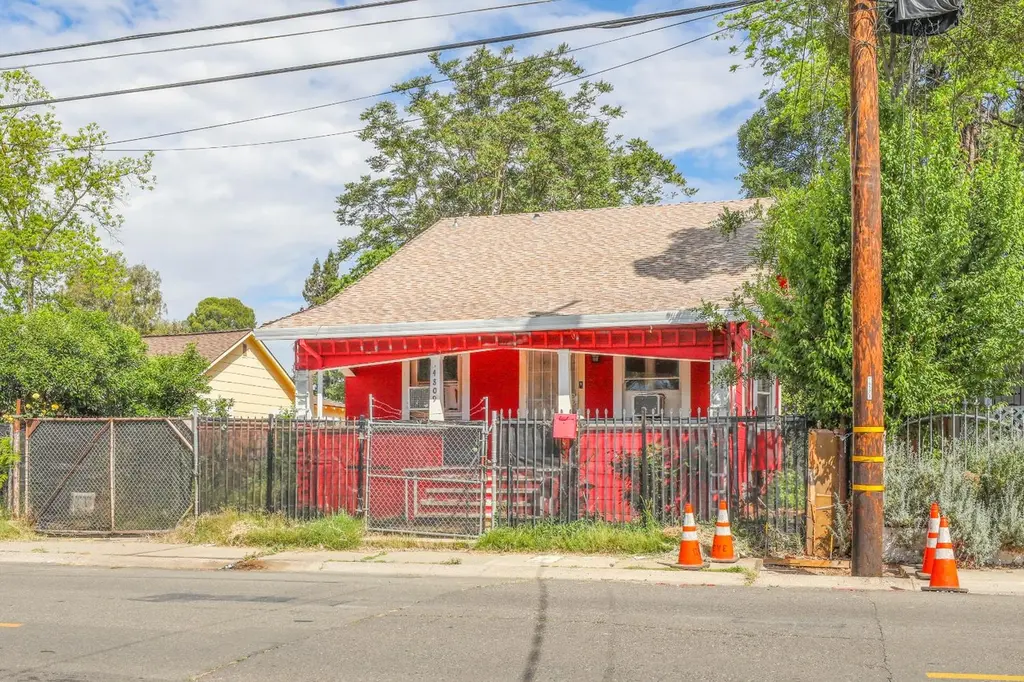
4809 Parker Ave · Fruitridge Pocket, CA
Flood risk 1/10 · Minimal
- FEMA flood zone
- X (unshaded)
- Chance of flooding over 30 yrs
- 0.0%
- Est. flood insurance / yr
- $507 – $1,088
Fire risk 1/10 · Minimal
- Est. fire insurance / yr
- $659 – $1,223
Heat risk 7/10 · Major
- Hot days now (above 102°F)
- 7 days/yr
- Hot days in 30 yrs
- 15 days/yr
Wind risk 1/10 · Minimal
- Chance of severe wind over 30 yrs
- —
Air-quality risk 10/10 · Severe
- Unhealthy air days now
- 28 days/yr
- Unhealthy air days in 30 yrs
- 33 days/yr
Risk factors via First Street. Map © Google.
Why this score? — see what drove the C- grade
The composite is a weighted blend of 9 inputs, each scored 0–100. Each bar is that input's sub-score; the figure is the points it added to the 100-point composite (weight × sub-score).
- Cash flow +16.3/30.0
- ARV discount +15.0/15.0
- DSCR +5.0/10.0
- Rent growth +3.7/5.0
- Schools +3.5/10.0
- 1% rule +3.4/10.0
- Livability +2.9/5.0
- Condition / age +2.5/5.0
- Appreciation +0.0/10.0
$279,800
🖨 Deal sheet 📄 Offer letter ✓ Due diligence
Listing remarks
Investor and contractor opportunity in Sacramento! Property is a fixer-upper being sold strictly in as-is condition, offering significant upside for buyers ready to bring their vision and sweat equity. Properties at this price point and with this level of potential don't stay on the market long schedule your showing today.
Key facts
- 8,712 sq ft lot
- Parking
- Built 1922
Property features AI
Finance
- HOA & community: No association
Exterior
- Parking: Detached parking
- Utilities: 220-volt electric service; Public water; Public sewer; Public district irrigation
- Home design: Detached single-family residence; Built in 1922; One story
- Construction: Shingle roof
- Exterior features: No horses allowed; Lot features: see remarks
Interior
- Kitchen: Tile countertops
- Bedrooms: Three bedrooms (all on main level)
- Flooring: Wood flooring; Other flooring
- Bathrooms: One full bathroom with tub/shower and window
- Heating & cooling: No central heating; No central cooling
- Interior features: Great room living area; Dining and family room combined; Street-level entrance
- Laundry & utility: Washer/dryer hookups only
Neighborhood map
What this means for you Summary
Snapshot
- This is a 3-bed/1.0-bath single-family listed at $280k.
Deal economics
- At list price, monthly cash flow is $153 ($2k/yr) — positive.
- The deal already cash-flows at list — no discount required.
- To meet the 1% rule (rent ≥ 1% of price), the offer needs to be $235k (16.1% below list).
- Recommended offer: $235k (16.1% below list) — sets the bar for 1% rule.
Location & tenants
- Location reads 57/100 on livability (#735 in CA) — a working-class tenant base; expect higher turnover. Watch: amenities C-, crime F, commute F.
- Sacramento City Unified (urban): math 32% / reading 43% proficiency, ranked #804 of 1,400 in CA (top 57%) — families likely to look elsewhere, expect single-tenant / working-renter base with shorter leases; 63% free/reduced lunch — lower-income household profile, screen leases tightly.
- Market conditions: Rents rising fast (+4.6%/yr); 121 active listings in the ZIP; 40 comparable units currently listed for rent nearby; rentals at typical pace (median 22d on market — plan ~3-4 weeks tenant-placement turnaround); solid renter incomes; 6,825 units permitted in Sacramento County in 2024 (1,752 in 5+ unit buildings).
- This rent runs 36% of the median local income ($78k/yr) — at the standard rent-burdened threshold; future hikes will face affordability resistance.
Forward outlook
- Local home prices are declining (-3.0%/yr); year-one equity from $2k of loan paydown is wiped out by about $8k of value loss. Plan a longer hold.
- Sacramento County population projected at +17% by 2050 — long-run rental-demand tailwind backs the buy-and-hold thesis.
Negotiation context
- It's been on market 26 days — a 2% lower offer ($276k) is reasonable based on typical stale-listing flexibility.
Risks & watch-outs
- Watch-outs: built in 1922 — expect roof / HVAC / electrical / plumbing capex.
- Climate carrying-cost: extreme-heat days projected 7→15/yr by 2055 (HVAC capex compounding) — expect insurance premiums to compound above CPI over the hold.
Questions for the listing agent
- Built in 1922 — when were the roof, HVAC, electrical panel, plumbing, and water heater last replaced?
- Is there a deadline driving the sale (1031 exchange, divorce, estate, relocation)? That informs how much negotiation room exists.
- Crime grade is F in this area — have there been break-ins, vandalism, or insurance claims at this property in the last 3 years? What carrier currently insures it and at what premium?
- What's the average days-on-market for RENTAL listings here right now (not sales)? A rising rental-DOM trend means longer vacancies and softer asking-rent achievability than the comps imply.
- What's the recent tenant-quality profile in this submarket — average credit score on applications, eviction rate, late-payment / NSF rate, and stable-employment percentage? A property-management company in the area should have these aggregated.
- How much new for-sale + rental construction is in the pipeline within 1–3 miles? Heavy new supply typically softens prices + rents 12–24 months out; constrained supply supports both.
Investment metrics
- 1% rule
- 0.84% ✗
- Cap rate
- 6.95%
- Cash-on-cash
- 2.34%
- DSCR
- 1.10
- GRM
- 9.9
CMA / ARV
- ARV (median comp)
- $377,211
- List price
- $279,800
- Delta
- -25.82%
- Verdict
- UNDERPRICED
- Comps
- 20 within 1.0 mi
Show comp detail 12 sales within ~0.75 mi
| Address | Dist | Beds/Ba | Sqft | Sold | Price | $/sf | Match |
|---|---|---|---|---|---|---|---|
| 4137 44th St | 0.33mi | 3/2.0 | 1,088 (+2%) | 2mo | $425,000 | $391 | 77 |
| 5100 48th St | 0.43mi | 3/2.0 | 1,046 (-2%) | 2mo | $450,000 | $430 | 70 |
| 4537 Brent Ct | 0.50mi | 3/1.0 | 1,020 (-5%) | 3mo | $400,000 | $392 | 66 |
| 5841 18th Ave | 0.64mi | 3/1.0 | 1,054 (-2%) | 2mo | $475,000 | $451 | 66 |
| 5808 21st Ave | 0.66mi | 3/1.0 | 1,039 (-3%) | 1mo | $398,000 | $383 | 63 |
| 5032 8th Ave | 0.63mi | 2/1.0 (-1) | 1,079 (+1%) | 2mo | $635,000 | $589 | 63 |
| 5301 Ethel Way | 0.56mi | 3/1.0 | 1,145 (+7%) | 2mo | $375,000 | $328 | 60 |
| 4012 47th St | 0.24mi | 3/1.5 | 912 (-15%) | 2mo | $379,000 | $416 | 60 |
| 4921 Mcglashan St | 0.30mi | 3/2.0 | 1,210 (+13%) | 2mo | $408,000 | $337 | 59 |
| 4424 12th Ave | 0.49mi | 3/1.0 | 1,200 (+12%) | 2mo | $415,000 | $346 | 56 |
| 4580 26th Ave | 0.54mi | 2/2.0 (-1) | 1,145 (+7%) | 2mo | $425,000 | $371 | 52 |
| 4200 22nd Ave | 0.47mi | 4/2.0 (+1) | 1,196 (+12%) | 3mo | $430,000 | $360 | 47 |
Match score weights: distance 35% · size 25% · config 20% · recency 20%. Top-matched comps best support the ARV.
Projected returns pro-forma
-3.0% appreciation · 4.62% rent growth · sell at horizon
- IRR
- -11.0%
- Equity multiple
- 0.59×
- Total profit
- $-31,812
- Equity at exit
- $41,719
- IRR
- 0.2%
- Equity multiple
- 1.01×
- Total profit
- $908
- Equity at exit
- $24,192
Cash invested: $78,344 (down + closing). Projections, not guarantees.
Landlord ↔ Tenant lean methodology
- Overall (STATE)
- 18 Strongly Tenant-Friendly
- State California
- 18 Strongly Tenant-Friendly · D+13
- County
- — inherits STATE
- City
- — inherits STATE
ZIP-level market 95820
- Rents YoY
- 4.6%
- Active inventory
- 121
- Price-to-rent
- 9.9×
Monthly cashflow live
- Estimated rent
- $2,348 high interval (Pro) →
- Mortgage (P&I)
- −$1,467
- Tax from tax record
- −$118 /mo · $1,415/yr
- Insurance
- −$117
- HOA
- −$0
- Vacancy / Maint / Mgmt
- −$493
- Net cashflow
- $153
Break-even live
UW: 25.0% down · 7.5% · 30yr · 1.5% tax · 5.0% vac · 8.0% maint · 8.0% mgmt
Financing live
Cash to close
- Down payment
- $69,950
- Closing costs
- $8,394
- Reserves months
- —
- Total cash needed
- —
Loan-product check · same deal, 3 products live
Conventional
25% down · 7.5% · 30yr
- Down + closing
- —
- Monthly P&I
- —
- Monthly cashflow
- —
- DSCR
- —
- Eligible?
- —
Personal DTI + credit; lowest rate.
DSCR
20% down · 8.5% · 30yr
- Down + closing
- —
- Monthly P&I
- —
- Monthly cashflow
- —
- DSCR
- —
- Eligible?
- —
No personal income docs; deal must DSCR.
Hard money
10% down · 12.0% · 12mo
- Down + closing
- —
- Monthly P&I
- —
- Monthly cashflow
- —
- DSCR
- —
- Eligible?
- —
Short-term bridge; refi at stabilization.
Rent comps 40 comps
| Address | Beds | Baths | Sqft | Rent | $/sqft | DOM | Units | Dist |
|---|---|---|---|---|---|---|---|---|
| 4311 48th St Sacramento, CA | 3.0 | 1.0 | 1313 | $2,150 | $1.64 | 44d | 1 | 0.07mi |
| 4204 51st St Sacramento, CA | 3.0 | 1.0 | 1050 | $2,450 | $2.33 | 3d | 1 | 0.13mi |
| 4204 51st St Unit A Sacramento, CA | 3.0 | 1.0 | 1050 | $2,450 | $2.33 | 24d | 1 | 0.13mi |
| 4028 52nd St Unit 4028 Sacramento, CA | 2.0 | 2.0 | 1100 | $2,200 | $2.00 | 44d | 1 | 0.26mi |
| 5301 20th Ave Sacramento, CA | 3.0 | 1.0 | 1053 | $2,650 | $2.52 | 44d | 1 | 0.29mi |
| 4930 Bonniemae Way Sacramento, CA | 3.0 | 2.0 | 1289 | $2,500 | $1.94 | 44d | 1 | 0.32mi |
| 4957 13th Ave Sacramento, CA | 2.0 | 1.0 | 879 | $2,095 | $2.38 | 44d | 1 | 0.36mi |
| 3962 44th St Sacramento, CA | 3.0 | 3.0 | 1081 | $2,550 | $2.36 | 7d | 1 | 0.44mi |
| 3962 44th St Sacramento, CA | 3.0 | 3.0 | 1081 | $2,495 | $2.31 | 22d | 1 | 0.44mi |
| 4901 11th Ave Sacramento, CA | 2.0 | 2.0 | 912 | $2,500 | $2.74 | 4d | 1 | 0.48mi |
| 5123 11th Ave Sacramento, CA | 2.0 | 1.0 | 762 | $2,300 | $3.02 | 18d | 1 | 0.51mi |
| 5538 20th Ave Sacramento, CA | 2.0 | 1.0 | 1120 | $2,395 | $2.14 | 44d | 1 | 0.52mi |
| 5017 10th Ave Sacramento, CA | 3.0 | 2.0 | 1400 | $2,600 | $1.86 | 16d | 1 | 0.56mi |
| 4501 58th St Sacramento, CA | 2.0 | 1.0 | 786 | $1,916 | $2.44 | 4d | 1 | 0.58mi |
| 4116 W Nichols Ave Sacramento, CA | 2.0 | 1.0 | 870 | $1,799 | $2.07 | 18d | 1 | 0.61mi |
| 4001 58th St Sacramento, CA | 2.0 | 1.0 | 800 | $2,750 | $3.44 | 7d | 1 | 0.62mi |
| 5356 8th Ave Unit 5356 Sacramento, CA | 2.0 | 1.0 | 745 | $3,200 | $4.30 | 16d | 1 | 0.72mi |
| 3521 San Jose Way Sacramento, CA | 2.0 | 1.0 | 818 | $1,990 | $2.43 | 24d | 1 | 0.75mi |
| 5724 Falconer Way Unit 2 Sacramento, CA | 2.0 | 1.5 | 750 | $1,500 | $2.00 | 44d | 1 | 0.78mi |
| 5726 Falconer Way Unit 6 Sacramento, CA | 2.0 | 1.0 | 750 | $1,400 | $1.87 | 24d | 1 | 0.78mi |
| 5726 Falconer Way Unit 4 Sacramento, CA | 2.0 | 1.0 | 750 | $1,350 | $1.80 | 24d | 1 | 0.78mi |
| 5720 Falconer Way Apt B Sacramento, CA | 2.0 | 1.0 | 750 | $1,350 | $1.80 | 24d | 1 | 0.78mi |
| 3042 53rd St Sacramento, CA | 3.0 | 2.0 | 1115 | $2,225 | $2.00 | 44d | 1 | 0.79mi |
| 5321 57th St Sacramento, CA | 4.0 | 2.0 | 1248 | $2,399 | $1.92 | 44d | 1 | 0.80mi |
| 5730 Falconer Way Unit B Sacramento, CA | 2.0 | 1.0 | 750 | $1,400 | $1.87 | 24d | 1 | 0.81mi |
| 5730 Falconer Way Unit D Sacramento, CA | 2.0 | 1.0 | 750 | $1,350 | $1.80 | 20d | 1 | 0.81mi |
| 3431 58th St Sacramento, CA | 2.0 | 2.0 | 902 | $2,899 | $3.21 | 7d | 1 | 0.83mi |
| 5364 Young St Unit 6 Sacramento, CA | 2.0 | 1.0 | 750 | $1,545 | $2.06 | 4d | 1 | 0.85mi |
| 5701 Fruitridge Rd Sacramento, CA | 2.0 | 1.0 | 875 | $1,495 | $1.71 | 44d | 1 | 0.86mi |
| 5630 Odea Dr #4 Sacramento, CA | 2.0 | 1.0 | 847 | $1,375 | $1.62 | 22d | 1 | 0.90mi |
| 5619 42nd St Unit 5619-1 Sacramento, CA | 2.0 | 1.0 | 925 | $1,625 | $1.76 | 12d | 1 | 0.91mi |
| 5656 Odea Dr Sacramento, CA | 2.0 | 1.0 | 850 | $1,750 | $2.06 | 4d | 1 | 0.92mi |
| 5656 Odea Dr Sacramento, CA | 2.0 | 1.0 | 850 | $1,750 | $2.06 | 7d | 1 | 0.92mi |
| 5544 33rd Ave Unit NA Sacramento, CA | 2.0 | 1.0 | 1200 | $2,250 | $1.88 | 7d | 1 | 0.94mi |
| 4500 63rd St Sacramento, CA | 1.0–2.0 | 1.0 | 675 | $1,695 | $2.51 | 15d | 2 | 0.95mi |
| 3210 40th St Unit 1/2 Sacramento, CA | 3.0 | 1.0 | 1280 | $1,990 | $1.55 | 15d | 1 | 0.95mi |
| 3116 40th St Unit B Sacramento, CA | 3.0 | 1.0 | 1029 | $2,200 | $2.14 | 44d | 1 | 0.98mi |
| 3900 38th St Sacramento, CA | 3.0 | 2.0 | 1119 | $2,540 | $2.27 | 24d | 1 | 1.01mi |
| 5812 Laurine Way Sacramento, CA | 2.0 | 1.0 | 790 | $2,199 | $2.78 | 22d | 1 | 1.03mi |
| 2761 Stockton Blvd Sacramento, CA | 2.0 | 1.0–2.0 | 734 | $2,842 | $3.87 | 44d | 1 | 1.08mi |
Listing history 5 events
-
2026-06-07statusdays on market $279,800 Pending 26 DOM
-
2026-06-05days on market $279,800 Active 25 DOM
-
2026-06-03days on market $279,800 Active 24 DOM
-
2026-06-02days on market $279,800 Active 23 DOM
-
2026-06-02pricestatus $279,800 Active 22 DOM
ⓘ Source: listings_history table (triggers on properties + properties_extension) + one-shot
backfill from property_details.listing_events for pre-trigger history.
Tax reassessment forecast CA · Resets to sale price
- Current annual tax
- $1,415 · $118/mo
- Projected year-2 tax
- $2,126 · $177/mo
- Expected delta
- +$712/yr (+$59/mo · 50.3%)
ⓘ Screening estimate from a state-policy table — verify with the county assessor before closing.
Climate risk First Street
- Flood 1/10 Low FEMA zone X (unshaded) · 0% chance over 30 yrs
- Wildfire 1/10 Low
- Heat 7/10 Severe 7 d/yr ≥102°F today · 15 d/yr by 30 yrs out
- Wind 1/10 Low
- Air quality 10/10 Extreme 28 unhealthy d/yr today · 33 by 30 yrs out
Nearby sold comps map
Loading sold comps map…
Walkable amenities ~0.75 mi
Loading nearby amenities…
Taxation est. · year 1
- Rental income
- $28,174
- − Mortgage interest
- −$15,673
- − Property taxes
- −$1,415
- − Insurance
- −$1,399
- − Repairs & maintenance
- −$2,254
- − Management
- −$2,254
- − Depreciation
- −$8,140
- Taxable loss
- −$2,960
- Est. tax savings @ 24.0%
- +$710
- After-tax cash flow
- $2,547/yr
For passive investors: Depreciation is non-cash, so a rental often shows a tax loss while cash-flowing — sheltering income. Rental losses are passive: they offset passive income freely, and up to $25,000/yr can offset ordinary (W-2) income if you actively participate and your MAGI is under $100k (phasing out to $0 by $150k); unused losses carry forward. On sale, claimed depreciation is recaptured at up to 25%, and gains may owe capital-gains tax (a 1031 exchange can defer both). Figures are a year-1 estimate at your 24.0% rate — not tax advice; consult a CPA.
Schools (NCES district)
- District
- Sacramento City Unified
- NCES district ID
- 0633840
- Math proficiency
- 32% ▬ 0.00%
- Reading proficiency
- 43% ▲ 3.00%
- Median HH income
- $49,280
- Composite
- 34.86/100
- National rank
- #10000
- State rank
- #804 of 1400 in CA
Livability — Fruitridge Pocket
- Score
- 57/100
- State rank
- #735
- US rank
- #21657
Category grades
Schools grade is shown separately in the Schools card above.
Census & demographics
- Census place
- Fruitridge Pocket, CA
- County
- Sacramento County · 1,539,646 people
- Metro
- Sacramento-Roseville-Folsom, CA
- Population (ZIP)
- 35,410
- Household income
- $78,436
- Rent vs Own
- Severe rent burden
- 1255.0
Population outlook (Sacramento County) Hauer SSP2
- Today (2025)
- 1,660,763 people
- By 2030
- 1,732,990 · +4.3%
- By 2040
- 1,855,755 · +11.7%
- By 2050
- 1,941,335 · +16.9%
- By 2075
- 2,046,162 · +23.2%
- By 2100
- 1,961,444 · +18.1%
Race, ethnicity, and origin ACS 2023
- Neighborhood character
- Highly diverse neighborhood (Simpson 0.72)
- Race & ethnicity
- Hispanic / Latino 41% White 31% Two or more races 17% Black 11% Asian 11% Pacific Islander 2%
- Hispanic origin (detail)
- Mexican 34% Puerto Rican 2%
- Common ancestry
- Italian 2% Russian 1% Slovak 1%
- Foreign-born
- 19% · Canada, Vietnam, China
- Languages at home
- 65% English-only · Spanish 23% Other Asian/Pacific 5% Chinese 1%
Political lean MEDSL · Sacramento
- 2024 margin
- D (+19.7) · D 58.1% · R 38.4% · Other 3.5%
- 2008→2024 swing
- +0.7pp no change · 2008: 19.0pp · 2024: 19.7pp
- All cycles
- 2024: D+19.7 2020: D+25.3 2016: D+23.7 2012: D+16.3 2008: D+19.0
Not yet ingested
- Civics
- —
Market trends
- HPI YoY
- ▼ -473.17%
- Current HPI
- 413.4424
- Rent YoY
- ▲ 4.62%
- Metro
- Sacramento-Roseville-Folsom, CA
- State GDP YoY
- ▲ 3.21%
- F500 in state
- 116
Industry mix (Fortune 500 HQ in CA)
| Industry | F500 HQs | Revenue |
|---|---|---|
| Technology | 27 | $1,492B |
|
||
| Financial Services | 3 | $174B |
|
||
| Retail | 3 | $44B |
|
||
| Insurance | 3 | $26B |
|
||
| Media / Entertainment | 2 | $115B |
|
||
| Pharmaceuticals / Biotech | 2 | $62B |
|
||
Property tax history
+6.3%/yrLatest (2025): $1,415 · +1.5% YoY. Source: county tax records.
Cash-flow waterfall
monthlySold comps — $/sqft
last 12 mo · ≤1 miLoading sold comps…