412 S Water St · Gallatin, MO
Flood risk 1/10 · Minimal
- FEMA flood zone
- X (unshaded)
- Chance of flooding over 30 yrs
- 0.0%
- Est. flood insurance / yr
- $507 – $1,088
Fire risk 4/10 · Minor
- Est. fire insurance / yr
- $1,054 – $1,958
Heat risk 4/10 · Minor
- Hot days now (above 106°F)
- 7 days/yr
- Hot days in 30 yrs
- 15 days/yr
Wind risk 2/10 · Minimal
- Chance of severe wind over 30 yrs
- —
Air-quality risk 2/10 · Minimal
- Unhealthy air days now
- 0 days/yr
- Unhealthy air days in 30 yrs
- 1 days/yr
Risk factors via First Street. Map © Google.
Why this score? — see what drove the B+ grade
The composite is a weighted blend of 9 inputs, each scored 0–100. Each bar is that input's sub-score; the figure is the points it added to the 100-point composite (weight × sub-score).
- Cash flow +30.0/30.0
- DSCR +10.0/10.0
- Appreciation +10.0/10.0
- 1% rule +9.3/10.0
- ARV discount +7.5/15.0
- Schools +4.0/10.0
- Livability +3.1/5.0
- Rent growth +2.5/5.0
- Condition / age +2.5/5.0
$65,000
🖨 Deal sheet (PDF) 📄 Offer letter ✓ Due diligence
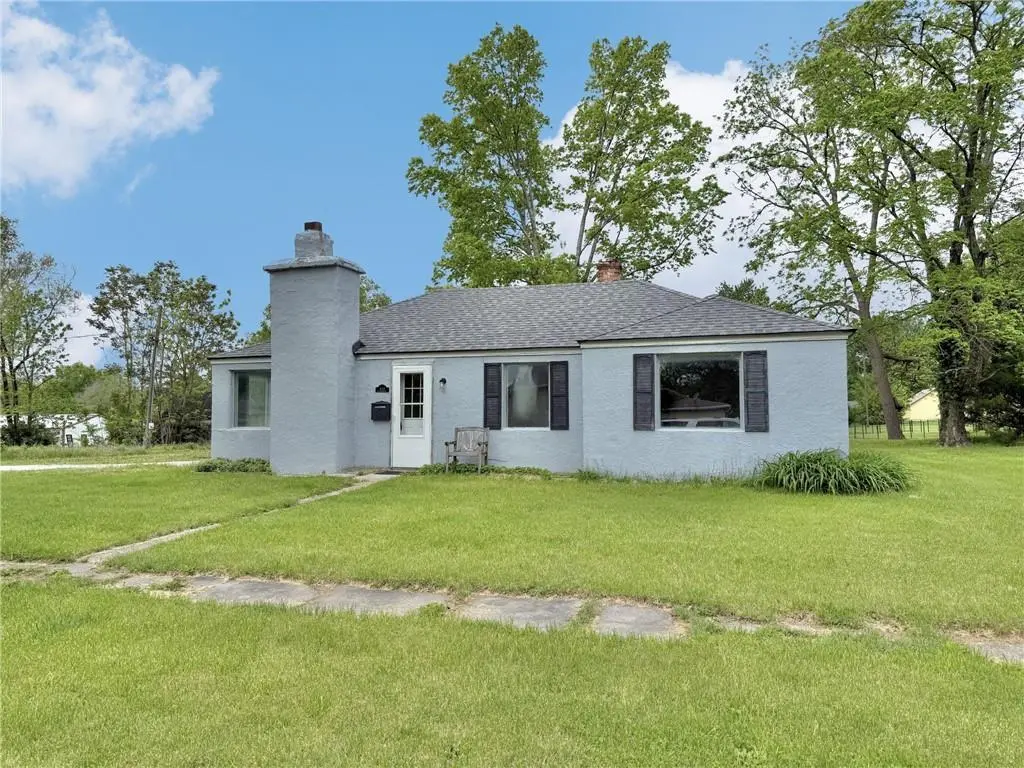
Listing remarks
This practical 1,008 sq ft home offers affordable, easy living all on one level! Featuring 2 bedrooms and 1 full bathroom, the layout includes a comfortable living room, functional kitchen with pantry, and convenient laundry hookups right in the kitchen. Forced air heat and central air provide year-round comfort, while newer carpet and original wood floors add a nice blend of updates and character. Sitting on a spacious lot with plenty of off-street parking and located close to the city swimming pool, this home is a great opportunity for buyers looking for cheap living in a small town where inventory is limited and affordable homes are hard to find!
Key facts
- Functional kitchen
- Spacious lot
- Off-street parking
Tags
Property features AI
Finance
- HOA & community: No association fees
Exterior
- Parking: Off-street parking
- Utilities: Public water; Public sewer
- Home design: Single-family residence; Ranch floor plan; Residential property
- Construction: Stucco and frame construction; Composition roof
- Exterior features: City lot; Lot approximately 75 x 115 feet
Interior
- Kitchen: Electric range
- Bedrooms: 2 bedrooms on the main level
- Flooring: Carpet; Tile; Vinyl; Wood
- Bathrooms: 1 full bathroom on the main level
- Heating & cooling: Forced-air heating (natural gas); Electric cooling
- Interior features: Eat-in kitchen; Living room with a wood-burning fireplace
- Laundry & utility: Laundry on the main level
Neighborhood map
What this means for you Summary
Snapshot
- This is a 2-bed/3.0-bath other listed at $65k.
Deal economics
- At list price, monthly cash flow is $349 ($4k/yr) — positive.
- The deal already cash-flows at list — no discount required.
- Meets the 1% rule at list price ($931 rent vs $65k).
Location & tenants
- Location reads 61/100 on livability (#426 in MO) — a middle-class / working-renter tenant base. Strengths: cost of living A+, housing A+, crime A-; Watch: schools D+, amenities F, commute F.
- Gallatin R-V (rural): math 47% / reading 48% proficiency, ranked #66 of 324 in MO (top 20%) — families likely to look elsewhere, expect single-tenant / working-renter base with shorter leases.
- Market conditions: 125 active listings in the ZIP.
Forward outlook
- In year one you build about $7k of equity ($449 loan paydown + $6k appreciation (10.0% local appreciation)).
- Daviess County population projected at -17% by 2050 — secular population decline; favor cash flow + early exit over multi-decade hold.
- At projected returns (10.0% appreciation + 3.0% rent growth), your $18k cash investment doubles in ~2 years — after that, you're playing with house money.
- By year 5, paydown + projected appreciation supports a ~$32k cash-out refi (75% LTV) — recoverable capital for the next deal without selling this one.
Negotiation context
- Only 2 days on market — expect competitive offers; lowballing is unlikely to land.
Risks & watch-outs
- Watch-outs: built in 1915 — expect roof / HVAC / electrical / plumbing capex.
Questions for the listing agent
- Built in 1915 — when were the roof, HVAC, electrical panel, plumbing, and water heater last replaced?
- Is there a deadline driving the sale (1031 exchange, divorce, estate, relocation)? That informs how much negotiation room exists.
- Schools are D-rated, which usually means shorter tenancies and higher turnover. Who's the typical renter profile here, and what's been the actual vacancy rate?
- What's the average days-on-market for RENTAL listings here right now (not sales)? A rising rental-DOM trend means longer vacancies and softer asking-rent achievability than the comps imply.
- What's the recent tenant-quality profile in this submarket — average credit score on applications, eviction rate, late-payment / NSF rate, and stable-employment percentage? A property-management company in the area should have these aggregated.
- How much new for-sale + rental construction is in the pipeline within 1–3 miles? Heavy new supply typically softens prices + rents 12–24 months out; constrained supply supports both.
Investment metrics
- 1% rule
- 1.43% ✓
- Cap rate
- 12.73%
- Cash-on-cash
- 22.99%
- DSCR
- 2.02
- GRM
- 5.8
CMA / ARV
No comps found within radius.
Projected returns pro-forma
10.0% appreciation · 3.0% rent growth · sell at horizon
- IRR
- 41.5%
- Equity multiple
- 4.16×
- Total profit
- $57,586
- Equity at exit
- $58,557
- IRR
- 35.8%
- Equity multiple
- 9.36×
- Total profit
- $152,067
- Equity at exit
- $126,281
Cash invested: $18,200 (down + closing). Projections, not guarantees.
Landlord ↔ Tenant lean methodology
- Overall (STATE)
- 81 Strongly Landlord-Friendly
- State Missouri
- 81 Strongly Landlord-Friendly · R+10
- County
- — inherits STATE
- City
- — inherits STATE
ZIP-level market 64640
- Home prices YoY
- 11.1%
- Active inventory
- 125
- Price-to-rent
- 5.8×
Monthly cashflow live
- Estimated rent
- $931 medium interval (Pro) →
- Mortgage (P&I)
- −$341
- Tax from tax record
- −$19 /mo · $224/yr
- Insurance
- −$27
- HOA
- −$0
- Vacancy / Maint / Mgmt
- −$195
- Net cashflow
- $349
Break-even live
Sensitivity live
| Price | -10% $386 | -5% $367 | +0% $349 | +5% $330 | +10% $312 |
|---|---|---|---|---|---|
| Rent | -10% $275 | -5% $312 | +0% $349 | +5% $385 | +10% $422 |
| Rate | -1.0pp $381 | -0.5pp $365 | base $349 | +0.5pp $332 | +1.0pp $315 |
UW: 25.0% down · 7.5% · 30yr · 1.5% tax · 5.0% vac · 8.0% maint · 8.0% mgmt
Financing live
Cash to close
- Down payment
- $16,250
- Closing costs
- $1,950
- Reserves months
- —
- Total cash needed
- —
Loan-product check · same deal, 3 products live
Conventional
25% down · 7.5% · 30yr
- Down + closing
- —
- Monthly P&I
- —
- Monthly cashflow
- —
- DSCR
- —
- Eligible?
- —
Personal DTI + credit; lowest rate.
DSCR
20% down · 8.5% · 30yr
- Down + closing
- —
- Monthly P&I
- —
- Monthly cashflow
- —
- DSCR
- —
- Eligible?
- —
No personal income docs; deal must DSCR.
Hard money
10% down · 12.0% · 12mo
- Down + closing
- —
- Monthly P&I
- —
- Monthly cashflow
- —
- DSCR
- —
- Eligible?
- —
Short-term bridge; refi at stabilization.
Listing history 3 events
-
2026-04-30status Pending
-
2026-04-28$65,000 Active
-
2001-01-02soldstatus
ⓘ Source: listings_history table (triggers on properties + properties_extension) + one-shot
backfill from property_details.listing_events for pre-trigger history.
Tax reassessment forecast MO · Resets to sale price
- Current annual tax
- $224 · $19/mo
- Projected year-2 tax
- $630 · $53/mo
- Expected delta
- +$407/yr (+$34/mo · 182.0%)
ⓘ Screening estimate from a state-policy table — verify with the county assessor before closing.
Climate risk First Street
- Flood 1/10 Low FEMA zone X (unshaded) · 0% chance over 30 yrs
- Wildfire 4/10 Moderate
- Heat 4/10 Moderate 7 d/yr ≥106°F today · 15 d/yr by 30 yrs out
- Wind 2/10 Low
- Air quality 2/10 Low 0 unhealthy d/yr today · 1 by 30 yrs out
Nearby sold comps map
Loading sold comps map…
Walkable amenities ~0.75 mi
Loading nearby amenities…
Taxation est. · year 1
- Rental income
- $11,169
- − Mortgage interest
- −$3,641
- − Property taxes
- −$224
- − Insurance
- −$325
- − Repairs & maintenance
- −$894
- − Management
- −$894
- − Depreciation
- −$1,891
- Taxable income
- $3,301
- Est. tax owed @ 24.0%
- −$792
- After-tax cash flow
- $3,392/yr
For passive investors: Depreciation is non-cash, so a rental often shows a tax loss while cash-flowing — sheltering income. Rental losses are passive: they offset passive income freely, and up to $25,000/yr can offset ordinary (W-2) income if you actively participate and your MAGI is under $100k (phasing out to $0 by $150k); unused losses carry forward. On sale, claimed depreciation is recaptured at up to 25%, and gains may owe capital-gains tax (a 1031 exchange can defer both). Figures are a year-1 estimate at your 24.0% rate — not tax advice; consult a CPA.
Schools (NCES district)
- District
- Gallatin R-V
- NCES district ID
- 2912660
- Math proficiency
- 47% ▲ 10.00%
- Reading proficiency
- 48% ▲ 6.00%
- Median HH income
- $42,284
- Composite
- 39.98/100
- National rank
- #3832
- State rank
- #66 of 324 in MO
Livability — Gallatin
- Score
- 61/100
- State rank
- #426
- US rank
- #17634
Category grades
Schools grade is shown separately in the Schools card above.
Census & demographics
- Census place
- Gallatin, MO
- Population (ZIP)
- 3,183
Population outlook (Daviess County) Hauer SSP2
- Today (2025)
- 7,695 people
- By 2030
- 7,386 · -4.0%
- By 2040
- 6,860 · -10.9%
- By 2050
- 6,375 · -17.2%
- By 2075
- 5,084 · -33.9%
- By 2100
- 3,583 · -53.4%
Race, ethnicity, and origin ACS 2023
- Neighborhood character
- Predominantly White (96%)
- Race & ethnicity
- White 96% Hispanic / Latino 2% Two or more races 1%
- Common ancestry
- Romanian 6% Slovak 3% Lithuanian 1%
- Foreign-born
- 1% · Canada
- Languages at home
- 98% English-only · German/W. Germanic 1% Spanish 1%
Political lean MEDSL · Daviess
- 2024 margin
- Solid R (+63.3) · D 17.9% · R 81.2%
- 2008→2024 swing
- -40.5pp toward R · 2008: -22.8pp · 2024: -63.3pp
- All cycles
- 2024: R+63.3 2020: R+60.2 2016: R+55.1 2012: R+33.0 2008: R+22.8
Not yet ingested
- Civics
- —
Market trends
- HPI YoY
- ▲ 29.00%
- Current HPI
- 290.2333
- Rent YoY
- —
- Metro
- —
- State GDP YoY
- ▲ 1.84%
- F500 in state
- 20
Industry mix (Fortune 500 HQ in MO)
| Industry | F500 HQs | Revenue |
|---|---|---|
| Healthcare | 1 | $163B |
|
||
| Insurance | 1 | $21B |
|
||
| Industrial Technology | 1 | $17B |
|
||
| Retail | 1 | $16B |
|
||
| Industrial Distribution | 1 | $10B |
|
||
| Utilities | 1 | $9B |
|
||
Price history
3 events — show timeline
- 2026-04-30 Pending — Heartland MLS as Distributed by MLS Grid
- 2026-04-28 Listed $65,000 Heartland MLS as Distributed by MLS Grid
- 2001-01-02 Sold (Public Records) — Public Records
Property tax history
+1.7%/yrLatest (2025): $224 · +8.4% YoY. Source: county tax records.
Cash-flow waterfall
monthlySold comps — $/sqft
last 12 mo · ≤1 miLoading sold comps…