 Fourplex
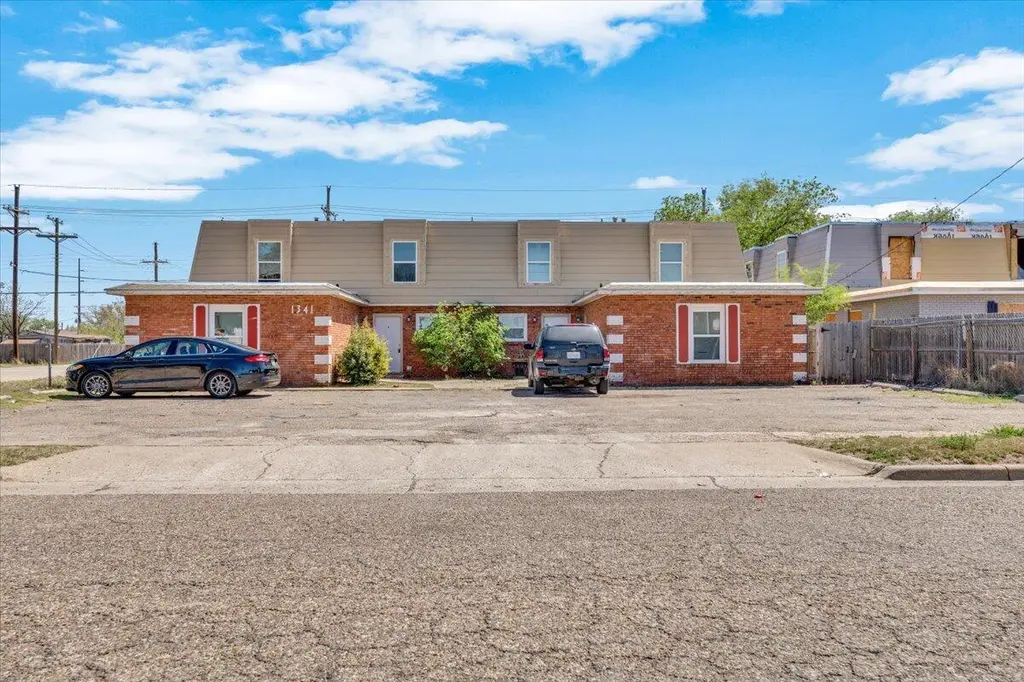
1341 65th Dr · Lubbock, TX
Flood risk 3/10 · Minor
- FEMA flood zone
- X (unshaded)
- Chance of flooding over 30 yrs
- 0.17%
- Est. flood insurance / yr
- $507 – $1,088
Fire risk 1/10 · Minimal
- Est. fire insurance / yr
- $1,222 – $2,270
Heat risk 5/10 · Moderate
- Hot days now (above 99°F)
- 7 days/yr
- Hot days in 30 yrs
- 20 days/yr
Wind risk 2/10 · Minimal
- Chance of severe wind over 30 yrs
- —
Air-quality risk 2/10 · Minimal
- Unhealthy air days now
- 1 days/yr
- Unhealthy air days in 30 yrs
- 1 days/yr
Risk factors via First Street. Map © Google.
Why this score? — see what drove the B grade
The composite is a weighted blend of 9 inputs, each scored 0–100. Each bar is that input's sub-score; the figure is the points it added to the 100-point composite (weight × sub-score).
- Cash flow +30.0/30.0
- 1% rule +10.0/10.0
- DSCR +10.0/10.0
- ARV discount +7.5/15.0
- Livability +4.0/5.0
- Rent growth +3.5/5.0
- Schools +3.1/10.0
- Condition / age +2.5/5.0
- Appreciation +0.0/10.0
$240,000
🖨 Deal sheet 📄 Offer letter ✓ Due diligence
Multi-family units
County records classify this as Multi-Family (2-4 Unit). Listing-text estimate: 4 units. confirmed
Listing remarks MLS
Investor Opportunity in Lubbock! Welcome to 1341 65th Street—a rare quadplex in a growing area of the city. This multi-family property features four spacious units: two 2-bedroom, 1.5-bath units and two 3-bedroom, 2-bath units, offering a versatile mix of layouts to suit a variety of tenants. Each unit is designed for comfortable living with open layouts and functional floorplans. The property includes a dedicated parking lot, providing convenient off-street parking for all residents. Located near schools, shopping, and major roadways, 1341 65th is well positioned in a desirable Lubbock neighborhood. This is a great opportunity to expand your real estate portfolio with a well-maintained, income-producing asset.
Key facts
- Growing area
- 0.28 acre lot
- Built 1964
Tags
Neighborhood map
What this means for you Summary
Snapshot
- This is a 2×2bd/1.5ba + 2×3bd/2ba units multifamily listed at $240k.
Deal economics
- At list price, monthly cash flow is $1k ($16k/yr) — positive. Per door: $324/mo.
- The deal already cash-flows at list — no discount required.
- Meets the 1% rule at list price ($4k rent vs $240k).
- Recommended offer: $211k (12.0% below list) — sets the bar for market timing.
Location & tenants
- Location reads 80/100 on livability (#37 in TX, #1,749 nationally) — a professional / high-income tenant draw. Strengths: commute A+, cost of living A+, housing A+; Watch: employment C-, schools D+, crime F.
- Lubbock ISD (urban): math 36% / reading 39% proficiency, ranked #481 of 826 in TX (top 58%) — families likely to look elsewhere, expect single-tenant / working-renter base with shorter leases; 60% free/reduced lunch — lower-income household profile, screen leases tightly.
- Market conditions: Rents rising (+3.9%/yr); 110 active listings in the ZIP; 2,219 units permitted in Lubbock County in 2024 (252 in 5+ unit buildings).
- At $4,125/mo this rent would consume 101% of the median local household income ($49k/yr) (locally 676% of renters already pay >50% of income on rent) — very limited rent-growth headroom before tenants either downsize or default.
Forward outlook
- Local home prices are declining (-3.0%/yr); year-one equity from $2k of loan paydown is wiped out by about $7k of value loss. Plan a longer hold.
- Lubbock County population projected at +39% by 2050 — long-run rental-demand tailwind backs the buy-and-hold thesis.
- At projected returns (-3.0% appreciation + 3.9% rent growth), your $67k cash investment doubles in ~5 years — after that, you're playing with house money.
Negotiation context
- It's been on market 207 days — a 12% lower offer ($211k) is reasonable based on typical stale-listing flexibility.
- 6 sale attempts since 6y ago with the ask held roughly flat each time — persistent listings suggest the price (not the market) is what's stuck; bring a comps-based counter.
Risks & watch-outs
- Watch-outs: property tax is 3.0% of price.
- Climate carrying-cost: extreme-heat days projected 7→20/yr by 2055 (HVAC capex compounding) — expect insurance premiums to compound above CPI over the hold.
Questions for the listing agent
- It's been on market 207 days. Have you received any prior offers? Is the seller open to a 12% concession, seller financing, or rate buy-down credit?
- Can we see the unit-by-unit rent roll, current vacancy, and any below-market leases? What's the average tenancy length?
- What capital expenditures (roof, boiler, parking lot, exteriors) have been made in the last 5 years, and what's planned in the next 2?
- Built in 1964 — when were the roof, HVAC, electrical panel, plumbing, and water heater last replaced?
- Property tax is high relative to price — has the assessment been appealed recently, and will the sale trigger a re-assessment?
- Why hasn't it sold? Are there any deal-killer items the seller is aware of (foundation, flood, title, zoning, code violations)?
- Is there a deadline driving the sale (1031 exchange, divorce, estate, relocation)? That informs how much negotiation room exists.
- Schools are D-rated, which usually means shorter tenancies and higher turnover. Who's the typical renter profile here, and what's been the actual vacancy rate?
- Crime grade is F in this area — have there been break-ins, vandalism, or insurance claims at this property in the last 3 years? What carrier currently insures it and at what premium?
- What's the average days-on-market for RENTAL listings here right now (not sales)? A rising rental-DOM trend means longer vacancies and softer asking-rent achievability than the comps imply.
- What's the recent tenant-quality profile in this submarket — average credit score on applications, eviction rate, late-payment / NSF rate, and stable-employment percentage? A property-management company in the area should have these aggregated.
- How much new apartment / multifamily construction is in the pipeline within 1–3 miles? Heavy new supply (>2% of stock underway) typically softens rents 12–24 months out; light construction supports rent growth.
Investment metrics
- 1% rule
- 1.72% ✓
- Cap rate
- 12.78%
- Cash-on-cash
- 23.17%
- DSCR
- 2.03
- GRM
- 4.8
CMA / ARV
No comps found within radius.
Projected returns pro-forma
-3.0% appreciation · 3.87% rent growth · sell at horizon
- IRR
- 17.3%
- Equity multiple
- 1.71×
- Total profit
- $47,656
- Equity at exit
- $35,785
- IRR
- 26.5%
- Equity multiple
- 3.44×
- Total profit
- $164,152
- Equity at exit
- $20,751
Cash invested: $67,200 (down + closing). Projections, not guarantees.
Landlord ↔ Tenant lean methodology
- Overall (STATE)
- 87 Strongly Landlord-Friendly
- State Texas
- 87 Strongly Landlord-Friendly · R+5
- County
- — inherits STATE
- City
- — inherits STATE
ZIP-level market 79412
- Home prices YoY
- -15.3%
- Rents YoY
- 3.9%
- Active inventory
- 110
- Price-to-rent
- 20.6×
Monthly cashflow live
- Estimated rent
- $4,125 high interval (Pro) →
- Mortgage (P&I)
- −$1,259
- Tax from tax record
- −$602 /mo · $7,229/yr
- Insurance
- −$100
- HOA
- −$0
- Vacancy / Maint / Mgmt
- −$866
- Net cashflow
- $1,298
Break-even live
4-unit breakdown (identical units grouped — click to expand)
| Units | Beds | Baths | Est. rent |
|---|---|---|---|
| 2× units | 2 | 1.5 | $1,940 |
| #1 | 2 | 1.5 | $970 |
| #2 | 2 | 1.5 | $970 |
| 2× units | 3 | 2 | $2,186 |
| #3 | 3 | 2 | $1,093 |
| #4 | 3 | 2 | $1,093 |
| Total (4 units) | $4,125 | ||
UW: 25.0% down · 7.5% · 30yr · 1.5% tax · 5.0% vac · 8.0% maint · 8.0% mgmt
Financing live
Cash to close
- Down payment
- $60,000
- Closing costs
- $7,200
- Reserves months
- —
- Total cash needed
- —
Loan-product check · same deal, 3 products live
Conventional
25% down · 7.5% · 30yr
- Down + closing
- —
- Monthly P&I
- —
- Monthly cashflow
- —
- DSCR
- —
- Eligible?
- —
Personal DTI + credit; lowest rate.
DSCR
20% down · 8.5% · 30yr
- Down + closing
- —
- Monthly P&I
- —
- Monthly cashflow
- —
- DSCR
- —
- Eligible?
- —
No personal income docs; deal must DSCR.
Hard money
10% down · 12.0% · 12mo
- Down + closing
- —
- Monthly P&I
- —
- Monthly cashflow
- —
- DSCR
- —
- Eligible?
- —
Short-term bridge; refi at stabilization.
Listing history 16 events
-
2025-10-29$240,000 Active 739-char remark
Show marketing remark (739 chars)
Investor Opportunity in Lubbock! Welcome to 1341 65th Street—a rare quadplex in a growing area of the city. This multi-family property features four spacious units: two 2-bedroom, 1.5-bath units and two 3-bedroom, 2-bath units, offering a versatile mix of layouts to suit a variety of tenants. Each unit is designed for comfortable living with open layouts and functional floorplans. The property includes a dedicated parking lot, providing convenient off-street parking for all residents. Located near schools, shopping, and major roadways, 1341 65th is well positioned in a desirable Lubbock neighborhood. This is a great opportunity to expand your real estate portfolio with a well-maintained, income-producing asset.
-
2025-09-12price $265,000
-
2024-03-14historical $750
-
2023-11-21$750
-
2023-10-08historical $750
-
2023-10-05$750
-
2023-09-24historical $750
-
2023-09-23$750
-
2023-02-28soldstatus Closed
-
2023-02-28soldstatus
-
2023-01-15status Pending
-
2023-01-10$270,000 Active
-
2021-01-29soldstatus
-
2021-01-29soldstatus
-
2020-09-23$270,000
-
2006-08-25soldstatus
ⓘ Source: listings_history table (triggers on properties + properties_extension) + one-shot
backfill from property_details.listing_events for pre-trigger history.
Tax reassessment forecast TX · Resets to sale price
- Current annual tax
- $7,229 · $602/mo
- Projected year-2 tax
- $7,229 · $602/mo
- Expected delta
- $0/yr ($0/mo · 0.0%)
ⓘ Screening estimate from a state-policy table — verify with the county assessor before closing.
Climate risk First Street
- Flood 3/10 Moderate FEMA zone X (unshaded) · 17% chance over 30 yrs
- Wildfire 1/10 Low
- Heat 5/10 Major 7 d/yr ≥99°F today · 20 d/yr by 30 yrs out
- Wind 2/10 Low
- Air quality 2/10 Low 1 unhealthy d/yr today · 1 by 30 yrs out
Nearby sold comps map
Loading sold comps map…
Walkable amenities ~0.75 mi
Loading nearby amenities…
Taxation est. · year 1
- Rental income
- $49,500
- − Mortgage interest
- −$13,444
- − Property taxes
- −$7,229
- − Insurance
- −$1,200
- − Repairs & maintenance
- −$3,960
- − Management
- −$3,960
- − Depreciation
- −$6,982
- Taxable income
- $12,726
- Est. tax owed @ 24.0%
- −$3,054
- After-tax cash flow
- $12,519/yr
For passive investors: Depreciation is non-cash, so a rental often shows a tax loss while cash-flowing — sheltering income. Rental losses are passive: they offset passive income freely, and up to $25,000/yr can offset ordinary (W-2) income if you actively participate and your MAGI is under $100k (phasing out to $0 by $150k); unused losses carry forward. On sale, claimed depreciation is recaptured at up to 25%, and gains may owe capital-gains tax (a 1031 exchange can defer both). Figures are a year-1 estimate at your 24.0% rate — not tax advice; consult a CPA.
Schools (NCES district)
- District
- Lubbock ISD
- NCES district ID
- 4828500
- Math proficiency
- 36% ▼ -8.00%
- Reading proficiency
- 39% ▼ -1.00%
- Median HH income
- $39,820
- Composite
- 31.44/100
- National rank
- #5984
- State rank
- #481 of 826 in TX
Livability — Lubbock
- Score
- 80/100
- State rank
- #37
- US rank
- #1749
Category grades
Schools grade is shown separately in the Schools card above.
Census & demographics
- Census place
- Lubbock, TX
- County
- Lubbock County · 293,542 people
- City population
- 283,030
- Metro
- Lubbock, TX
- Population (ZIP)
- 15,018
- Household income
- $48,878
- Rent vs Own
- Severe rent burden
- 676.0
Population outlook (Lubbock County) Hauer SSP2
- Today (2025)
- 345,960 people
- By 2030
- 371,449 · +7.4%
- By 2040
- 424,539 · +22.7%
- By 2050
- 481,150 · +39.1%
- By 2075
- 633,467 · +83.1%
- By 2100
- 746,853 · +115.9%
Race, ethnicity, and origin ACS 2023
- Neighborhood character
- Diverse neighborhood (Simpson 0.56)
- Race & ethnicity
- Hispanic / Latino 61% Two or more races 25% White 25% Black 10%
- Hispanic origin (detail)
- Mexican 51% Puerto Rican 2%
- Common ancestry
- Lithuanian 1% Serbian 1% Italian 1%
- Foreign-born
- 5% · Canada
- Languages at home
- 67% English-only · Spanish 32% Arabic 1%
Political lean MEDSL · Lubbock
- 2024 margin
- Solid R (+39.5) · D 29.7% · R 69.2% · Other 1.0%
- 2008→2024 swing
- -2.8pp toward R · 2008: -36.7pp · 2024: -39.5pp
- All cycles
- 2024: R+39.5 2020: R+32.2 2016: R+38.4 2012: R+40.9 2008: R+36.7
Not yet ingested
- Civics
- —
Market trends
- HPI YoY
- ▼ -33.95%
- Current HPI
- 188.4033
- Rent YoY
- ▲ 3.87%
- Metro
- Lubbock, TX
- State GDP YoY
- ▲ 3.95%
- F500 in state
- 110
Industry mix (Fortune 500 HQ in TX)
| Industry | F500 HQs | Revenue |
|---|---|---|
| Energy | 16 | $1,198B |
|
||
| Technology | 5 | $198B |
|
||
| Engineering / Construction | 4 | $72B |
|
||
| Energy Services | 3 | $60B |
|
||
| Utilities | 3 | $41B |
|
||
| Healthcare | 2 | $330B |
|
||
Price history
-11.1% since first listed16 events — show timeline
- 2025-10-29 Listed $240,000 LARMLS
- 2025-09-12 Price Changed $265,000 LARMLS
- 2024-03-14 Rental Removed $750 APPFOLIO
- 2023-11-21 Listed for Rent $750 APPFOLIO
- 2023-10-08 Rental Removed $750 APPFOLIO
- 2023-10-05 Listed for Rent $750 APPFOLIO
- 2023-09-24 Rental Removed $750 APPFOLIO
- 2023-09-23 Listed for Rent $750 APPFOLIO
- 2023-02-28 Sold (Public Records) — Public Records
- 2023-02-28 Sold (MLS) — LARMLS
- 2023-01-15 Pending — LARMLS
- 2023-01-10 Listed $270,000 LARMLS
- 2021-01-29 Sold (Public Records) — Public Records
- 2021-01-29 Sold (MLS) — LARMLS
- 2020-09-23 Listed $270,000 LARMLS
- 2006-08-25 Sold (Public Records) — Public Records
Property tax history
+9.6%/yrLatest (2025): $7,229 · -2.6% YoY. Source: county tax records.
Cash-flow waterfall
monthlySold comps — $/sqft
last 12 mo · ≤1 miLoading sold comps…