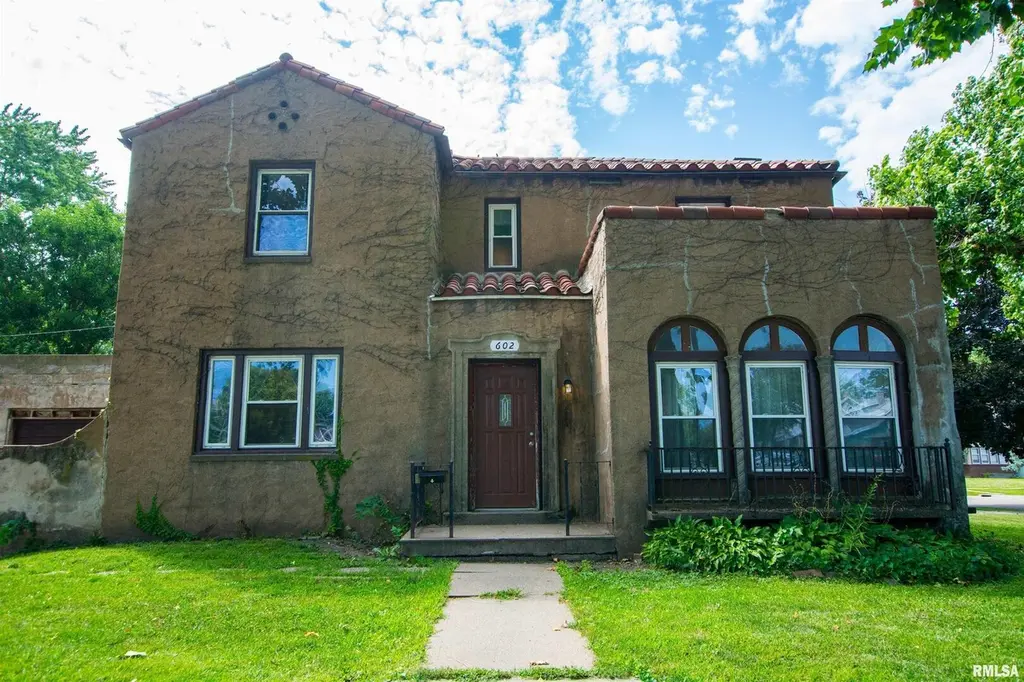
602 S 9th St · Clinton, IA
Flood risk 4/10 · Minor
- FEMA flood zone
- X
- Chance of flooding over 30 yrs
- 0.23%
- Est. flood insurance / yr
- $473 – $860
Fire risk 3/10 · Minor
- Est. fire insurance / yr
- $902 – $1,676
Heat risk 3/10 · Minor
- Hot days now (above 103°F)
- 7 days/yr
- Hot days in 30 yrs
- 16 days/yr
Wind risk 2/10 · Minimal
- Chance of severe wind over 30 yrs
- —
Air-quality risk 3/10 · Minor
- Unhealthy air days now
- 2 days/yr
- Unhealthy air days in 30 yrs
- 3 days/yr
Risk factors via First Street. Map © Google.
Why this score? — see what drove the B- grade
The composite is a weighted blend of 9 inputs, each scored 0–100. Each bar is that input's sub-score; the figure is the points it added to the 100-point composite (weight × sub-score).
- Cash flow +23.6/30.0
- ARV discount +15.0/15.0
- DSCR +7.6/10.0
- 1% rule +6.5/10.0
- Schools +4.5/10.0
- Livability +3.8/5.0
- Rent growth +2.5/5.0
- Condition / age +2.5/5.0
- Appreciation +0.0/10.0
$130,000
🖨 Deal sheet (PDF) 📄 Offer letter ✓ Due diligence
Listing remarks
Step into timeless charm with this beautiful home situated on a desirable corner lot in Clinton. Rich in character and historic appeal, this spacious residence features four bedrooms, one and a half baths, generous closet space, built-in shelving, and a fireplace that serves as the heart of the family room. Original architectural details shine throughout, including arched front windows and refinished hardwood floors in all bedrooms. The main level offers a formal dining room, an inviting eat-in kitchen, and a bright four-season front porch perfect for relaxing year-round. The updated full bathroom features tile finishes that blend modern convenience with the home's historic character. Compl
Key facts
- Formal dining room
- Built-in shelving
- Corner lot
Tags
Property features AI
Finance
- Other: Living area reported as estimated; Approximately 1,966 finished square feet (total finished/unfinshed reported as 3,012); Basement area present (1,046 listed)
- Financial info: Financial details not provided
- HOA & community: No master association fee required
Exterior
- Parking: Parking details not provided
- Security: No security features specified
- Utilities: Public water; Public sewer
- Home design: Detached single-family home; 2 stories; Facing direction not specified
- Construction: Stucco exterior; Block foundation; Metal and tile roof; Built approximately 91–100 years ago; Home was built before 1978
- Exterior features: Corner lot; Level lot; School bus service
Interior
- Kitchen: Range; Microwave; Dishwasher; Refrigerator; Tile flooring in kitchen
- Bedrooms: 4 bedrooms (master and three additional bedrooms on second level)
- Flooring: Hardwood flooring in bedrooms; Carpet in living room; Luxury vinyl in dining room; Tile in kitchen
- Bathrooms: 1 full bathroom; 1 half bathroom
- Heating & cooling: Natural gas heating; Central air conditioning
- Interior features: Heated sun room; Family room with fireplace; Living room; Dining room; Cellar basement
- Laundry & utility: Washer; Dryer; Dedicated laundry room in basement
Neighborhood map
What this means for you Summary
Snapshot
- This is a 3-bed/2.0-bath single-family listed at $130k.
Deal economics
- At list price, monthly cash flow is $246 ($3k/yr) — positive.
- The deal already cash-flows at list — no discount required.
- Meets the 1% rule at list price ($1k rent vs $130k).
- Recommended offer: $128k (1.5% below list) — sets the bar for market timing.
- Cap rate 8.6% vs local median 6.7% in Clinton — meaningfully above typical; check what's discounted (condition, days-on-market, listing class) to confirm the premium yield is real.
Location & tenants
- Location reads 75/100 on livability (#222 in IA, #4,192 nationally) — a middle-class / working-renter tenant base. Strengths: cost of living A+, housing A+, health & safety A+; Watch: amenities C-, crime D, employment D.
- Clinton Community School District (town): math 52% / reading 56% proficiency, ranked #273 of 289 in IA (top 94%) — acceptable for families but not a draw, mixed tenant base, ~2y average lease.
- Market conditions: 246 active listings in the ZIP; 4 comparable units currently listed for rent nearby; rentals lingering (median 45d on market — plan ~5-8 weeks vacancy on turnover, expect pricing pressure); 100% of comp listings sitting > 30 days — soft ceiling on asking rent; 116 units permitted in Clinton County in 2024 (50 in 5+ unit buildings).
Forward outlook
- Local home prices are declining (-3.0%/yr); year-one equity from $899 of loan paydown is wiped out by about $4k of value loss. Plan a longer hold.
- Clinton County population projected at -19% by 2050 — secular population decline; favor cash flow + early exit over multi-decade hold.
Negotiation context
- It's been on market 17 days — a 2% lower offer ($128k) is reasonable based on typical stale-listing flexibility.
- 15 sale attempts since 3y ago with the ask held roughly flat each time — persistent listings suggest the price (not the market) is what's stuck; bring a comps-based counter.
Risks & watch-outs
- Watch-outs: built in 1928 — expect roof / HVAC / electrical / plumbing capex.
Questions for the listing agent
- Built in 1928 — when were the roof, HVAC, electrical panel, plumbing, and water heater last replaced?
- Is there a deadline driving the sale (1031 exchange, divorce, estate, relocation)? That informs how much negotiation room exists.
- Schools are B-rated — typically a magnet for longer-tenancy family renters. What's the average tenant stay here, and is there a school-zone premium baked into asking?
- Crime grade is D in this area — have there been break-ins, vandalism, or insurance claims at this property in the last 3 years? What carrier currently insures it and at what premium?
- What's the average days-on-market for RENTAL listings here right now (not sales)? A rising rental-DOM trend means longer vacancies and softer asking-rent achievability than the comps imply.
- What's the recent tenant-quality profile in this submarket — average credit score on applications, eviction rate, late-payment / NSF rate, and stable-employment percentage? A property-management company in the area should have these aggregated.
- How much new for-sale + rental construction is in the pipeline within 1–3 miles? Heavy new supply typically softens prices + rents 12–24 months out; constrained supply supports both.
Investment metrics
- 1% rule
- 1.15% ✓
- Cap rate
- 8.56%
- Cash-on-cash
- 8.11%
- DSCR
- 1.36
- GRM
- 7.3
CMA / ARV
- ARV (median comp)
- $161,093
- List price
- $130,000
- Delta
- -25.51%
- Verdict
- UNDERPRICED
- Comps
- 20 within 1.0 mi
Show comp detail 10 sales within ~0.75 mi
| Address | Dist | Beds/Ba | Sqft | Sold | Price | $/sf | Match |
|---|---|---|---|---|---|---|---|
| 626 Argyle Ct | 0.09mi | 4/2.0 (+1) | 1,830 (-10%) | 1mo | $145,000 | $79 | 74 |
| 1228 Caroline Ave | 0.43mi | 3/1.5 | 1,919 (-6%) | 0mo | $189,900 | $99 | 69 |
| 1202 14th Ave S | 0.68mi | 3/1.5 | 1,990 (-2%) | 7mo | $151,000 | $76 | 57 |
| 910 2nd Ave S | 0.38mi | 4/2.5 (+1) | 2,262 (+11%) | 1mo | $226,000 | $100 | 55 |
| 413 Ruth Pl | 0.51mi | 3/1.5 | 1,832 (-10%) | 8mo | $130,000 | $71 | 51 |
| 704 9th Ave S | 0.39mi | 3/1.0 | 1,740 (-14%) | 5mo | $37,500 | $22 | 50 |
| 1125 Briarcliff Ln | 0.51mi | 2/1.5 (-1) | 1,756 (-14%) | 0mo | $164,700 | $94 | 47 |
| 254 S 14th St | 0.63mi | 3/2.5 | 1,936 (-5%) | 22mo | $199,900 | $103 | 43 |
| 1200 Woodlawn Ave | 0.35mi | 2/2.5 (-1) | 1,766 (-13%) | 17mo | $245,000 | $139 | 41 |
| 215 Myra Pl | 0.54mi | 3/2.0 | 1,787 (-12%) | 23mo | $215,000 | $120 | 36 |
Match score weights: distance 35% · size 25% · config 20% · recency 20%. Top-matched comps best support the ARV.
Projected returns pro-forma
-3.0% appreciation · 3.0% rent growth · sell at horizon
- IRR
- -3.9%
- Equity multiple
- 0.85×
- Total profit
- $-5,359
- Equity at exit
- $19,383
- IRR
- 5.8%
- Equity multiple
- 1.43×
- Total profit
- $15,683
- Equity at exit
- $11,240
Cash invested: $36,400 (down + closing). Projections, not guarantees.
Landlord ↔ Tenant lean methodology
- Overall (STATE)
- 83 Strongly Landlord-Friendly
- State Iowa
- 83 Strongly Landlord-Friendly · R+6
- County
- — inherits STATE
- City
- — inherits STATE
ZIP-level market 52732
- Home prices YoY
- -34.9%
- Active inventory
- 246
- Price-to-rent
- 7.3×
Monthly cashflow live
- Estimated rent
- $1,494 medium interval (Pro) →
- Mortgage (P&I)
- −$682
- Tax from tax record
- −$198 /mo · $2,380/yr
- Insurance
- −$54
- HOA
- −$0
- Vacancy / Maint / Mgmt
- −$314
- Net cashflow
- $246
Break-even live
Sensitivity live
| Price | -10% $320 | -5% $283 | +0% $246 | +5% $209 | +10% $172 |
|---|---|---|---|---|---|
| Rent | -10% $128 | -5% $187 | +0% $246 | +5% $305 | +10% $364 |
| Rate | -1.0pp $311 | -0.5pp $279 | base $246 | +0.5pp $212 | +1.0pp $178 |
UW: 25.0% down · 7.5% · 30yr · 1.5% tax · 5.0% vac · 8.0% maint · 8.0% mgmt
Financing live
Cash to close
- Down payment
- $32,500
- Closing costs
- $3,900
- Reserves months
- —
- Total cash needed
- —
Loan-product check · same deal, 3 products live
Conventional
25% down · 7.5% · 30yr
- Down + closing
- —
- Monthly P&I
- —
- Monthly cashflow
- —
- DSCR
- —
- Eligible?
- —
Personal DTI + credit; lowest rate.
DSCR
20% down · 8.5% · 30yr
- Down + closing
- —
- Monthly P&I
- —
- Monthly cashflow
- —
- DSCR
- —
- Eligible?
- —
No personal income docs; deal must DSCR.
Hard money
10% down · 12.0% · 12mo
- Down + closing
- —
- Monthly P&I
- —
- Monthly cashflow
- —
- DSCR
- —
- Eligible?
- —
Short-term bridge; refi at stabilization.
Rent comps 4 comps
| Address | Beds | Baths | Sqft | Rent | $/sqft | DOM | Units | Dist |
|---|---|---|---|---|---|---|---|---|
| 1004 S 4th St Clinton, IA | 3.0 | 2.5 | 1467 | $1,700 | $1.16 | 44d | 1 | 0.78mi |
| 1002 S 4th St Clinton, IA | 3.0 | 2.5 | 1467 | $1,750 | $1.19 | 44d | 1 | 0.78mi |
| 1006 S 4th St Clinton, IA | 3.0 | 2.5 | 1467 | $1,700 | $1.16 | 44d | 1 | 0.78mi |
| 1008 S 4th St Clinton, IA | 3.0 | 2.5 | 1467 | $1,750 | $1.19 | 44d | 1 | 0.79mi |
Listing history 50 events
-
2026-06-19days on market $130,000 Active 17 DOM
-
2026-06-18days on market $130,000 Active 16 DOM
-
2026-06-17days on market $130,000 Active 15 DOM
-
2026-06-16days on market $130,000 Active 14 DOM
-
2026-06-15days on market $130,000 Active 13 DOM
-
2026-06-14days on market $130,000 Active 11 DOM
-
2026-06-12days on market $130,000 Active 10 DOM
-
2026-06-09days on market $130,000 Active 7 DOM
-
2026-06-08days on market $130,000 Active 6 DOM
-
2026-06-07days on market $130,000 Active 5 DOM
-
2026-06-07days on market $130,000 Active 4 DOM
-
2026-06-03remarks 699-char remark
-
2026-06-03pricedays on market $130,000 Active 1 DOM
-
2026-05-06historical
-
2026-03-28price
-
2026-03-08price
-
2026-02-06Active
-
2026-02-06historical
-
2026-01-15status Active
-
2026-01-14historical
-
2026-01-08status Active
-
2026-01-06historical
-
2026-01-05historical
-
2026-01-02status Active
-
2026-01-02historical
-
2025-12-30price
-
2025-12-30price
-
2025-12-27price
-
2025-12-17historical
-
2025-12-17historical
-
2025-12-07Active
-
2025-12-05historical
-
2025-11-13price
-
2025-10-20historical
-
2025-10-19Active
-
2025-10-19Active
-
2025-03-19historical
-
2025-03-18historical
-
2025-02-01Active
-
2025-01-31historical
-
2025-01-30historical
-
2025-01-10price
-
2024-12-18price
-
2024-11-19Active
-
2023-11-06soldstatus $123,000
-
2023-11-03soldstatus $123,000
-
2023-11-03soldstatus $123,000 Closed
-
2023-09-28historical Under Contract
-
2023-09-22status Active
-
2023-09-21historical Under Contract
ⓘ Source: listings_history table (triggers on properties + properties_extension) + one-shot
backfill from property_details.listing_events for pre-trigger history.
Tax reassessment forecast IA · Partial reset (capped growth)
- Current annual tax
- $2,380 · $198/mo
- Projected year-2 tax
- $2,380 · $198/mo
- Expected delta
- $0/yr ($0/mo · 0.0%)
ⓘ Screening estimate from a state-policy table — verify with the county assessor before closing.
Climate risk First Street
- Flood 4/10 Moderate FEMA zone X · 23% chance over 30 yrs
- Wildfire 3/10 Moderate
- Heat 3/10 Moderate 7 d/yr ≥103°F today · 16 d/yr by 30 yrs out
- Wind 2/10 Low
- Air quality 3/10 Moderate 2 unhealthy d/yr today · 3 by 30 yrs out
Nearby sold comps map
Loading sold comps map…
Walkable amenities ~0.75 mi
Loading nearby amenities…
Taxation est. · year 1
- Rental income
- $17,926
- − Mortgage interest
- −$7,282
- − Property taxes
- −$2,380
- − Insurance
- −$650
- − Repairs & maintenance
- −$1,434
- − Management
- −$1,434
- − Depreciation
- −$3,782
- Taxable income
- $964
- Est. tax owed @ 24.0%
- −$231
- After-tax cash flow
- $2,720/yr
For passive investors: Depreciation is non-cash, so a rental often shows a tax loss while cash-flowing — sheltering income. Rental losses are passive: they offset passive income freely, and up to $25,000/yr can offset ordinary (W-2) income if you actively participate and your MAGI is under $100k (phasing out to $0 by $150k); unused losses carry forward. On sale, claimed depreciation is recaptured at up to 25%, and gains may owe capital-gains tax (a 1031 exchange can defer both). Figures are a year-1 estimate at your 24.0% rate — not tax advice; consult a CPA.
Schools (NCES district)
- District
- Clinton Community School District
- NCES district ID
- 1907710
- Math proficiency
- 52% ▼ -13.00%
- Reading proficiency
- 56% ▼ -8.00%
- Median HH income
- $40,900
- Composite
- 45.22/100
- National rank
- #2666
- State rank
- #273 of 289 in IA
Livability — Clinton
- Score
- 75/100
- State rank
- #222
- US rank
- #4192
Category grades
Schools grade is shown separately in the Schools card above.
Census & demographics
- Census place
- Clinton, IA
- County
- Clinton County · 25,880 people
- City population
- 25,880
- Metro
- Clinton, IA
- Population (ZIP)
- 25,880
- Household income
- $61,105
- Rent vs Own
- Severe rent burden
- 889.0
Population outlook (Clinton County) Hauer SSP2
- Today (2025)
- 44,817 people
- By 2030
- 43,090 · -3.9%
- By 2040
- 39,513 · -11.8%
- By 2050
- 36,209 · -19.2%
- By 2075
- 31,888 · -28.8%
- By 2100
- 30,382 · -32.2%
Race, ethnicity, and origin ACS 2023
- Neighborhood character
- Predominantly White (86%)
- Race & ethnicity
- White 86% Two or more races 7% Hispanic / Latino 5% Black 4%
- Common ancestry
- Iranian 4% Portuguese 2% Lithuanian 2%
- Foreign-born
- 2% · Canada
- Languages at home
- 97% English-only · Spanish 2% Arabic 1%
Political lean MEDSL · Clinton
- 2024 margin
- R (+18.9) · D 39.8% · R 58.6% · Other 1.6%
- 2008→2024 swing
- -41.9pp toward R · 2008: 23.0pp · 2024: -18.9pp
- All cycles
- 2024: R+18.9 2020: R+10.3 2016: R+5.1 2012: D+22.9 2008: D+23.0
Not yet ingested
- Civics
- —
Market trends
- HPI YoY
- ▼ -83.23%
- Current HPI
- 155.3426
- Rent YoY
- —
- Metro
- Clinton, IA
- State GDP YoY
- ▲ 2.48%
- F500 in state
- 4
Industry mix (Fortune 500 HQ in IA)
| Industry | F500 HQs | Revenue |
|---|---|---|
| Financial Services | 1 | $16B |
|
||
| Retail / Convenience | 1 | $15B |
|
||
Price history
-5.3% since first listed49 events — show timeline
- 2026-05-24 Relisted — MRED as Distributed by MLS Grid
- 2026-05-24 Relisted — MRED as Distributed by MLS Grid
- 2026-05-22 Relisted — MRED as Distributed by MLS Grid
- 2026-05-06 Listing Removed — MRED as Distributed by MLS Grid
- 2026-03-28 Price Changed — MRED as Distributed by MLS Grid
- 2026-03-08 Price Changed — MRED as Distributed by MLS Grid
- 2026-02-06 Listed — MRED as Distributed by MLS Grid
- 2026-02-06 Listing Removed — MRED as Distributed by MLS Grid
- 2026-02-06 Listing Removed — MRED as Distributed by MLS Grid
- 2026-02-06 Listing Removed — MRED as Distributed by MLS Grid
- 2026-02-06 Listing Removed — MRED as Distributed by MLS Grid
- 2026-01-15 Relisted — MRED as Distributed by MLS Grid
- 2026-01-14 Listing Removed — MRED as Distributed by MLS Grid
- 2026-01-08 Relisted — MRED as Distributed by MLS Grid
- 2026-01-06 Listing Removed — RMLSA as Distributed by MLS Grid
- 2026-01-05 Listing Removed — MRED as Distributed by MLS Grid
- 2026-01-02 Relisted — MRED as Distributed by MLS Grid
- 2026-01-02 Listing Removed — MRED as Distributed by MLS Grid
- 2025-12-30 Price Changed — MRED as Distributed by MLS Grid
- 2025-12-30 Price Changed — MRED as Distributed by MLS Grid
- 2025-12-27 Price Changed — MRED as Distributed by MLS Grid
- 2025-12-17 Listing Removed — MRED as Distributed by MLS Grid
- 2025-12-17 Listing Removed — MRED as Distributed by MLS Grid
- 2025-12-07 Listed — RMLSA as Distributed by MLS Grid
- 2025-12-05 Listing Removed — RMLSA as Distributed by MLS Grid
- 2025-11-13 Price Changed — RMLSA as Distributed by MLS Grid
- 2025-10-20 Listing Removed — RMLSA as Distributed by MLS Grid
- 2025-10-19 Listed — RMLSA as Distributed by MLS Grid
- 2025-10-19 Listed — RMLSA as Distributed by MLS Grid
- 2025-03-19 Listing Removed — RMLSA as Distributed by MLS Grid
- 2025-03-18 Listing Removed — MRED as Distributed by MLS Grid
- 2025-02-01 Listed — RMLSA as Distributed by MLS Grid
- 2025-01-31 Listing Removed — RMLSA as Distributed by MLS Grid
- 2025-01-30 Listing Removed — MRED as Distributed by MLS Grid
- 2025-01-10 Price Changed — RMLSA as Distributed by MLS Grid
- 2024-12-18 Price Changed — RMLSA as Distributed by MLS Grid
- 2024-11-19 Listed — RMLSA as Distributed by MLS Grid
- 2023-11-06 Sold (Public Records) $123,000 Public Records
- 2023-11-03 Sold (MLS) $123,000 RMLSA as Distributed by MLS Grid
- 2023-11-03 Sold (MLS) $123,000 MRED as Distributed by MLS Grid
- 2023-09-28 Contingent — RMLSA as Distributed by MLS Grid
- 2023-09-22 Relisted — RMLSA as Distributed by MLS Grid
- 2023-09-21 Contingent — RMLSA as Distributed by MLS Grid
- 2023-08-21 Listed $129,900 RMLSA as Distributed by MLS Grid
- 2023-08-21 Listed $129,900 MRED as Distributed by MLS Grid
- 2022-10-05 Listing Removed — RMLSA as Distributed by MLS Grid
- 2022-10-05 Listing Removed — RMLSA as Distributed by MLS Grid
- 2021-08-06 Listing Removed — RMLSA as Distributed by MLS Grid
- 2014-04-30 Listing Removed — MRED as Distributed by MLS Grid
Property tax history
+4.3%/yrLatest (2025): $2,380 · +44.1% YoY. Source: county tax records.
Cash-flow waterfall
monthlySold comps — $/sqft
last 12 mo · ≤1 miLoading sold comps…