 Duplex
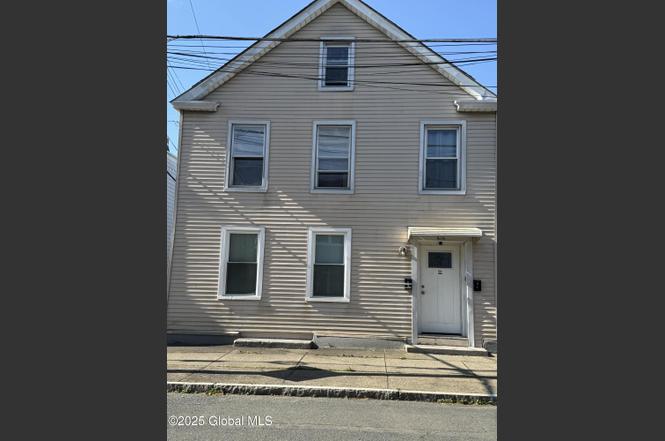
616 23rd St · Watervliet, NY
Flood risk 3/10 · Minor
- FEMA flood zone
- X (unshaded)
- Chance of flooding over 30 yrs
- 0.1%
- Est. flood insurance / yr
- $507 – $1,088
Fire risk 3/10 · Minor
- Est. fire insurance / yr
- $691 – $1,283
Heat risk 4/10 · Minor
- Hot days now (above 96°F)
- 7 days/yr
- Hot days in 30 yrs
- 17 days/yr
Wind risk 3/10 · Minor
- Chance of severe wind over 30 yrs
- 6.0%
Air-quality risk 2/10 · Minimal
- Unhealthy air days now
- 0 days/yr
- Unhealthy air days in 30 yrs
- 1 days/yr
Risk factors via First Street. Map © Google.
Why this score? — see what drove the C- grade
The composite is a weighted blend of 9 inputs, each scored 0–100. Each bar is that input's sub-score; the figure is the points it added to the 100-point composite (weight × sub-score).
- Cash flow +22.2/30.0
- DSCR +7.1/10.0
- 1% rule +6.3/10.0
- Rent growth +4.2/5.0
- Livability +4.2/5.0
- Schools +3.4/10.0
- ARV discount +2.5/15.0
- Condition / age +2.5/5.0
- Appreciation +0.0/10.0
$296,000
🖨 Deal sheet 📄 Offer letter ✓ Due diligence
Multi-family units
County records classify this as Multi-Family (2-4 Unit). Listing-text estimate: 2 units. confirmed
Listing remarks
OPEN HOUSE 3/22/26 from 11-1pm. .. .Great Investment Opportunity. Well maintained 2 Family House with Garage. , located in the heart of the City of Watervliet, close to restaurants and shopping center. Second floor is a 3-bedroom unit, and first floor is a one-bedroom unit. Hardwood floors, newer vinyl windows, granite kitchen counters, newer appliances, central air and forced air heat units, 1st floor tenant rent includes use of garage. Both floors have washer/dryer hookups. Separate utilities. Both units are leased until June 2026. Call to schedule your private showing.
Key facts
- 2 family house
- Garage
- Newer appliances
Tags
Neighborhood map
What this means for you Summary
Snapshot
- This is a 2 × 2-bed/1.0-bath units multifamily listed at $296k.
Deal economics
- At list price, monthly cash flow is $483 ($6k/yr) — positive. Per door: $242/mo.
- The deal already cash-flows at list — no discount required.
- Meets the 1% rule at list price ($3k rent vs $296k).
- Recommended offer: $292k (1.5% below list) — sets the bar for market timing.
- Cap rate 8.3% vs local median 5.9% in Watervliet — top-decile yield for the area; either an underpriced asset or a hidden risk that comps aren't pricing in. Stress-test before assuming the spread holds.
Location & tenants
- Location reads 84/100 on livability (#51 in NY, #786 nationally) — a professional / high-income tenant draw. Strengths: amenities A+, housing A+, health & safety A+; Watch: crime D+, schools D.
- Watervliet City School District (suburban): math 36% / reading 45% proficiency, ranked #524 of 590 in NY (top 89%) — families likely to look elsewhere, expect single-tenant / working-renter base with shorter leases.
- Market conditions: Rents rising fast (+6.6%/yr); 72 active listings in the ZIP; 12 comparable units currently listed for rent nearby; rentals at typical pace (median 19d on market — plan ~3-4 weeks tenant-placement turnaround); 675 units permitted in Albany County in 2024 (451 in 5+ unit buildings).
- At $3,333/mo this rent would consume 61% of the median local household income ($65k/yr) (locally 1224% of renters already pay >50% of income on rent) — very limited rent-growth headroom before tenants either downsize or default.
Forward outlook
- Local home prices are declining (-3.0%/yr); year-one equity from $2k of loan paydown is wiped out by about $9k of value loss. Plan a longer hold.
- Albany County population projected at +9% by 2050 — modest demand growth; plan on rents tracking national, not racing it.
- At projected returns (-3.0% appreciation + 6.6% rent growth), your $83k cash investment doubles in ~9 years — after that, you're playing with house money.
Negotiation context
- It's been on market 26 days — a 2% lower offer ($292k) is reasonable based on typical stale-listing flexibility.
- 2 sale attempts with the ask held roughly flat each time — persistent listings suggest the price (not the market) is what's stuck; bring a comps-based counter.
- Current owner paid $131k; list at $296k implies a 126% gain — meaningful room to come down on a strong offer.
Risks & watch-outs
- Watch-outs: built in 1900 — expect roof / HVAC / electrical / plumbing capex.
Questions for the listing agent
- Can we see the unit-by-unit rent roll, current vacancy, and any below-market leases? What's the average tenancy length?
- What capital expenditures (roof, boiler, parking lot, exteriors) have been made in the last 5 years, and what's planned in the next 2?
- Built in 1900 — when were the roof, HVAC, electrical panel, plumbing, and water heater last replaced?
- Is there a deadline driving the sale (1031 exchange, divorce, estate, relocation)? That informs how much negotiation room exists.
- Schools are D-rated, which usually means shorter tenancies and higher turnover. Who's the typical renter profile here, and what's been the actual vacancy rate?
- Crime grade is D in this area — have there been break-ins, vandalism, or insurance claims at this property in the last 3 years? What carrier currently insures it and at what premium?
- What's the average days-on-market for RENTAL listings here right now (not sales)? A rising rental-DOM trend means longer vacancies and softer asking-rent achievability than the comps imply.
- What's the recent tenant-quality profile in this submarket — average credit score on applications, eviction rate, late-payment / NSF rate, and stable-employment percentage? A property-management company in the area should have these aggregated.
- How much new apartment / multifamily construction is in the pipeline within 1–3 miles? Heavy new supply (>2% of stock underway) typically softens rents 12–24 months out; light construction supports rent growth.
Investment metrics
- 1% rule
- 1.13% ✓
- Cap rate
- 8.25%
- Cash-on-cash
- 6.99%
- DSCR
- 1.31
- GRM
- 7.4
CMA / ARV
- ARV (on-the-fly)
- $266,250
- Comps found
- 12
Show comp detail 12 sales within ~0.75 mi
| Address | Dist | Beds/Ba | Sqft | Sold | Price | $/sf | Match |
|---|---|---|---|---|---|---|---|
| 818 24th St | 0.16mi | 4/2.0 (-1) | 2,066 (-3%) | 8mo | $274,000 | $133 | 76 |
| 2325 6th Ave | 0.08mi | 5/2.0 | 1,872 (-12%) | 5mo | $230,000 | $123 | 72 |
| 2327 12th Ave | 0.38mi | 4/2.0 (-1) | 2,068 (-3%) | 5mo | $290,000 | $140 | 68 |
| 1551 4th Ave | 0.37mi | 6/2.0 (+1) | 2,058 (-3%) | 5mo | $230,000 | $112 | 68 |
| 1801 9th Ave | 0.28mi | 6/3.0 (+1) | 2,244 (+5%) | 2mo | $340,000 | $152 | 68 |
| 2127 2nd Ave | 0.24mi | 5/2.0 | 2,345 (+10%) | 8mo | $188,000 | $80 | 66 |
| 2315 3rd Ave | 0.18mi | 6/2.0 (+1) | 2,334 (+10%) | 6mo | $221,100 | $95 | 66 |
| 1506-08 7th Ave | 0.42mi | 4/4.0 (-1) | 2,108 (-1%) | 0mo | $190,000 | $90 | 66 |
| 25 13th St | 0.70mi | 5/2.0 | 2,106 (-1%) | 1mo | $289,900 | $138 | 64 |
| 1316 5th Ave | 0.59mi | 5/2.0 | 2,346 (+10%) | 5mo | $280,000 | $119 | 51 |
| 9 Archibald St | 0.65mi | 6/2.0 (+1) | 1,963 (-8%) | 6mo | $275,000 | $140 | 46 |
| 1235 5th Ave | 0.64mi | 4/3.0 (-1) | 2,328 (+9%) | 6mo | $290,000 | $125 | 40 |
Match score weights: distance 35% · size 25% · config 20% · recency 20%. Top-matched comps best support the ARV.
Projected returns pro-forma
-3.0% appreciation · 6.61% rent growth · sell at horizon
- IRR
- -1.4%
- Equity multiple
- 0.95×
- Total profit
- $-4,541
- Equity at exit
- $44,135
- IRR
- 11.9%
- Equity multiple
- 2.10×
- Total profit
- $91,575
- Equity at exit
- $25,593
Cash invested: $82,880 (down + closing). Projections, not guarantees.
Landlord ↔ Tenant lean methodology
- Overall (STATE)
- 15 Strongly Tenant-Friendly
- State New York
- 15 Strongly Tenant-Friendly · D+10
- County
- — inherits STATE
- City
- — inherits STATE
ZIP-level market 12189
- Home prices YoY
- -28.7%
- Rents YoY
- 6.6%
- Active inventory
- 72
- Price-to-rent
- 14.8×
Monthly cashflow live
- Estimated rent
- $3,333 high interval (Pro) →
- Mortgage (P&I)
- −$1,552
- Tax from tax record
- −$474 /mo · $5,693/yr
- Insurance
- −$123
- HOA
- −$0
- Vacancy / Maint / Mgmt
- −$700
- Net cashflow
- $483
Break-even live
2-unit breakdown (identical units grouped — click to expand)
| Units | Beds | Baths | Est. rent |
|---|---|---|---|
| 2× units | 2 | 1 | $3,334 |
| #1 | 2 | 1 | $1,667 |
| #2 | 2 | 1 | $1,667 |
| Total (2 units) | $3,333 | ||
UW: 25.0% down · 7.5% · 30yr · 1.5% tax · 5.0% vac · 8.0% maint · 8.0% mgmt
Financing live
Cash to close
- Down payment
- $74,000
- Closing costs
- $8,880
- Reserves months
- —
- Total cash needed
- —
Loan-product check · same deal, 3 products live
Conventional
25% down · 7.5% · 30yr
- Down + closing
- —
- Monthly P&I
- —
- Monthly cashflow
- —
- DSCR
- —
- Eligible?
- —
Personal DTI + credit; lowest rate.
DSCR
20% down · 8.5% · 30yr
- Down + closing
- —
- Monthly P&I
- —
- Monthly cashflow
- —
- DSCR
- —
- Eligible?
- —
No personal income docs; deal must DSCR.
Hard money
10% down · 12.0% · 12mo
- Down + closing
- —
- Monthly P&I
- —
- Monthly cashflow
- —
- DSCR
- —
- Eligible?
- —
Short-term bridge; refi at stabilization.
Rent comps 12 comps
| Address | Beds | Baths | Sqft | Rent | $/sqft | DOM | Units | Dist |
|---|---|---|---|---|---|---|---|---|
| 17 State St Troy, NY | 4.0 | 1.0–1.5 | 1810 | $3,635 | $2.01 | 14d | 7 | 0.74mi |
| 150 2nd St Troy, NY | 4.0 | 1.5 | 2442 | $3,000 | $1.23 | 21d | 1 | 0.84mi |
| 1520 6th Ave Troy, NY | 2.0–4.0 | 2.0–4.0 | 1209 | $1,349 | $1.12 | 23d | 8 | 1.03mi |
| 904 Peoples Ave Troy, NY | 4.0 | 1.0 | 1800 | $645 | $0.36 | 19d | 1 | 1.24mi |
| 136 9th St Unit 3 Troy, NY | 4.0 | 1.0 | 1500 | $595 | $0.40 | 19d | 1 | 1.27mi |
| 164 9th St Unit 1 Troy, NY | 4.0 | 2.0 | 1400 | $1,800 | $1.29 | 23d | 1 | 1.30mi |
| 53 13th St Troy, NY | 4.0 | 1.0 | 1500 | $650 | $0.43 | 19d | 1 | 1.40mi |
| 97 14th St Unit 2 Troy, NY | 5.0 | 2.0 | 1600 | $625 | $0.39 | 19d | 1 | 1.42mi |
| 97 14th St Troy, NY | 4.0 | 2.0 | 1500 | $650 | $0.43 | 19d | 1 | 1.42mi |
| 79 14th St Unit 2 Troy, NY | 4.0 | 1.0 | 1500 | $650 | $0.43 | 19d | 1 | 1.43mi |
| 51 14th St Unit 2 Troy, NY | 4.0 | 2.0 | 2000 | $725 | $0.36 | 19d | 1 | 1.44mi |
| 88 14th St Unit 2 Troy, NY | 4.0 | 1.0 | 1500 | $650 | $0.43 | 19d | 1 | 1.44mi |
Listing history 6 events
-
2026-03-26status Pending
-
2026-02-28$296,000 Active
-
2025-12-04historical
-
2025-07-22price $305,000
-
2025-06-03$314,000 Active
-
2017-11-13soldstatus $131,000
ⓘ Source: listings_history table (triggers on properties + properties_extension) + one-shot
backfill from property_details.listing_events for pre-trigger history.
Tax reassessment forecast NY · Partial reset (capped growth)
- Current annual tax
- $5,693 · $474/mo
- Projected year-2 tax
- $5,693 · $474/mo
- Expected delta
- $0/yr ($0/mo · 0.0%)
ⓘ Screening estimate from a state-policy table — verify with the county assessor before closing.
Climate risk First Street
- Flood 3/10 Moderate FEMA zone X (unshaded) · 10% chance over 30 yrs
- Wildfire 3/10 Moderate
- Heat 4/10 Moderate 7 d/yr ≥96°F today · 17 d/yr by 30 yrs out
- Wind 3/10 Moderate 6% chance of damaging wind over 30 yrs
- Air quality 2/10 Low 0 unhealthy d/yr today · 1 by 30 yrs out
Nearby sold comps map
Loading sold comps map…
Walkable amenities ~0.75 mi
Loading nearby amenities…
Taxation est. · year 1
- Rental income
- $39,996
- − Mortgage interest
- −$16,581
- − Property taxes
- −$5,693
- − Insurance
- −$1,480
- − Repairs & maintenance
- −$3,200
- − Management
- −$3,200
- − Depreciation
- −$8,611
- Taxable income
- $1,232
- Est. tax owed @ 24.0%
- −$296
- After-tax cash flow
- $5,501/yr
For passive investors: Depreciation is non-cash, so a rental often shows a tax loss while cash-flowing — sheltering income. Rental losses are passive: they offset passive income freely, and up to $25,000/yr can offset ordinary (W-2) income if you actively participate and your MAGI is under $100k (phasing out to $0 by $150k); unused losses carry forward. On sale, claimed depreciation is recaptured at up to 25%, and gains may owe capital-gains tax (a 1031 exchange can defer both). Figures are a year-1 estimate at your 24.0% rate — not tax advice; consult a CPA.
Schools (NCES district)
- District
- Watervliet City School District
- NCES district ID
- 3630210
- Math proficiency
- 36% ▼ -2.00%
- Reading proficiency
- 45% ▬ 0.00%
- Median HH income
- $43,276
- Composite
- 34.23/100
- National rank
- #5261
- State rank
- #524 of 590 in NY
Livability — Watervliet
- Score
- 84/100
- State rank
- #51
- US rank
- #786
Category grades
Schools grade is shown separately in the Schools card above.
Census & demographics
- Census place
- Watervliet, NY
- County
- Albany County · 196,626 people
- City population
- 18,656
- Metro
- Albany-Schenectady-Troy, NY
- Population (ZIP)
- 18,656
- Household income
- $65,276
- Rent vs Own
- Severe rent burden
- 1224.0
Population outlook (Albany County) Hauer SSP2
- Today (2025)
- 320,794 people
- By 2030
- 327,401 · +2.1%
- By 2040
- 338,218 · +5.4%
- By 2050
- 348,467 · +8.6%
- By 2075
- 381,693 · +19.0%
- By 2100
- 393,809 · +22.8%
Race, ethnicity, and origin ACS 2023
- Neighborhood character
- Predominantly White (72%)
- Race & ethnicity
- White 72% Two or more races 8% Asian 8% Black 8% Hispanic / Latino 6%
- Hispanic origin (detail)
- Mexican 2% Puerto Rican 2% Dominican 1%
- Common ancestry
- Lithuanian 6% Romanian 5% Scotch-Irish 4%
- Foreign-born
- 11% · Canada, China, South Korea
- Languages at home
- 88% English-only · Other Indo-European 4% Spanish 2% Other Asian/Pacific 2%
Political lean MEDSL · Albany
- 2024 margin
- Strong D (+25.8) · D 62.9% · R 37.1%
- 2008→2024 swing
- -3.6pp toward R · 2008: 29.4pp · 2024: 25.8pp
- All cycles
- 2024: D+25.8 2020: D+31.4 2016: D+24.3 2012: D+31.0 2008: D+29.4
Not yet ingested
- Civics
- —
Market trends
- HPI YoY
- ▼ -110.16%
- Current HPI
- 273.8109
- Rent YoY
- ▲ 6.61%
- Metro
- Albany-Schenectady-Troy, NY
- State GDP YoY
- ▲ 2.60%
- F500 in state
- 92
Industry mix (Fortune 500 HQ in NY)
| Industry | F500 HQs | Revenue |
|---|---|---|
| Financial Services | 10 | $950B |
|
||
| Consumer Goods | 9 | $162B |
|
||
| Insurance | 4 | $225B |
|
||
| Telecommunications | 2 | $144B |
|
||
| Pharmaceuticals | 2 | $112B |
|
||
| Media / Entertainment | 2 | $69B |
|
||
Price history
+126.0% since first listed6 events — show timeline
- 2026-03-26 Pending — Global MLS
- 2026-02-28 Listed $296,000 Global MLS
- 2025-12-04 Listing Removed — Global MLS
- 2025-07-22 Price Changed $305,000 Global MLS
- 2025-06-03 Listed $314,000 Global MLS
- 2017-11-13 Sold (Public Records) $131,000 Public Records
Property tax history
+4.6%/yrLatest (2025): $5,693 · +2.8% YoY. Source: county tax records.
Cash-flow waterfall
monthlySold comps — $/sqft
last 12 mo · ≤1 miLoading sold comps…