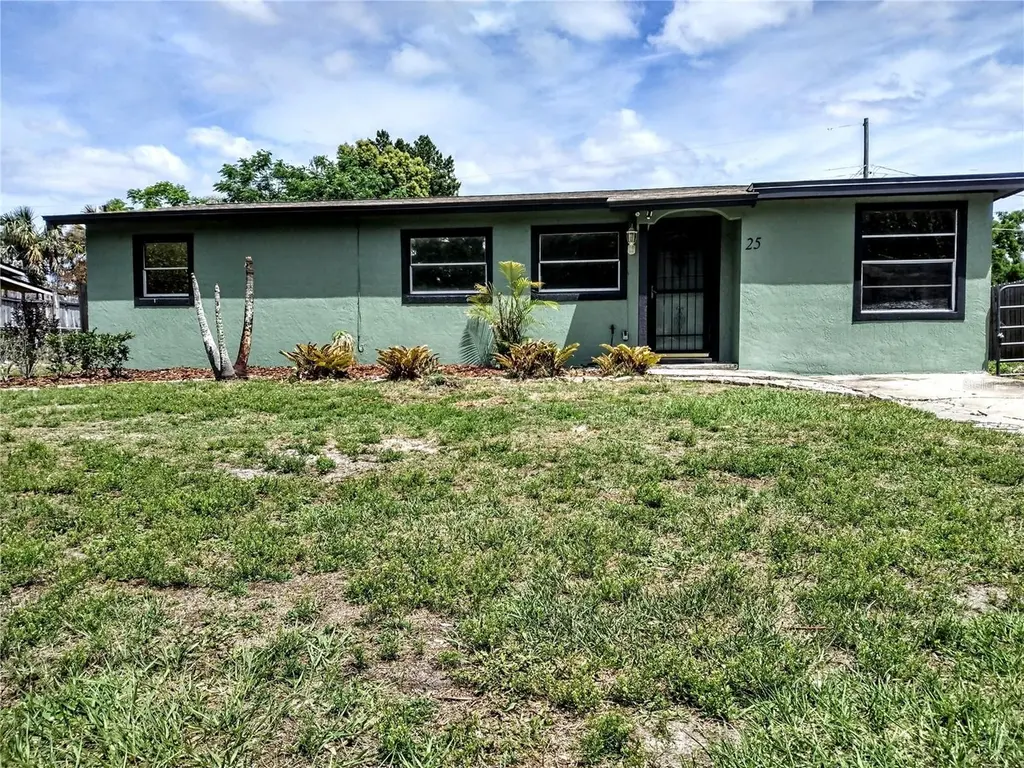
25 W Sandpiper St · Apopka, FL
Flood risk 1/10 · Minimal
- FEMA flood zone
- X (unshaded)
- Chance of flooding over 30 yrs
- 0.0%
- Est. flood insurance / yr
- $507 – $1,088
Fire risk 3/10 · Minor
- Est. fire insurance / yr
- $947 – $1,759
Heat risk 8/10 · Major
- Hot days now (above 108°F)
- 7 days/yr
- Hot days in 30 yrs
- 22 days/yr
Wind risk 9/10 · Severe
- Chance of severe wind over 30 yrs
- 99.0%
Air-quality risk 2/10 · Minimal
- Unhealthy air days now
- 1 days/yr
- Unhealthy air days in 30 yrs
- 2 days/yr
Risk factors via First Street. Map © Google.
Why this score? — see what drove the D grade
The composite is a weighted blend of 9 inputs, each scored 0–100. Each bar is that input's sub-score; the figure is the points it added to the 100-point composite (weight × sub-score).
- Cash flow +13.9/30.0
- ARV discount +8.0/15.0
- DSCR +4.2/10.0
- Schools +4.1/10.0
- Livability +3.3/5.0
- 1% rule +3.0/10.0
- Condition / age +2.5/5.0
- Rent growth +2.0/5.0
- Appreciation +0.0/10.0
$249,999
🖨 Deal sheet (PDF) 📄 Offer letter ✓ Due diligence
Listing remarks
Welcome home to this beautiful gem! This 3 bedroom 1 bath home offers a perfect blend of comfort, functionality, and style. Designed for modern living, the open living and dining room combo is great for entertaining. The MODERN kitchen boasts stylish wood cabinets, decorative laminate countertops, and modern stainless steel appliances. Bedroom 3 is versatile endless potential for a home office, den, or guest space. Enjoy the convenience of an INDOOR LAUNDRY ROOM. The MODERN bathroom is a shower/tub combo. The flow is perfect for daily living and entertaining. The true highlight is the SPACIOUS backyard, featuring a covered awning - perfect spot for outdoor dining, entertaining, or relaxing
Key facts
- Spacious backyard
- Covered awning
- Modern kitchen
Tags
Property features AI
Finance
- Other: Total lot approximately 0.2 acres (owner provided)
- Financial info: Property is homesteaded; No lease restrictions indicated
- HOA & community: No association indicated
Exterior
- Parking: Directions provided for property location
- Security: Smoke detector(s)
- Utilities: Public water; Public sewer / sewer connected; Public utilities
- Home design: Single family residence; One story; Home faces south; Residential property
- Construction: Block and stucco construction; Shingle roof; Slab foundation; Built with approximately 1,129 total building area (owner provided)
- Exterior features: Awning(s); City limits; Paved lot; Asphalt road
Interior
- Kitchen: Dishwasher; Microwave; Range; Refrigerator; Electric water heater
- Bedrooms: 3 bedrooms
- Flooring: Carpet; Ceramic tile
- Bathrooms: 1 full bathroom
- Heating & cooling: Central heating; Central air conditioning
- Interior features: Ceiling fans; Living room/dining room combo; Thermostat; Smoke detector(s)
- Laundry & utility: Inside laundry room
Neighborhood map
What this means for you Summary
Snapshot
- This is a 2-bed/1.0-bath single-family listed at $250k.
Deal economics
- At list price, monthly cash flow is $27 ($322/yr) — positive.
- The deal already cash-flows at list — no discount required.
- To meet the 1% rule (rent ≥ 1% of price), the offer needs to be $200k (19.9% below list).
- Recommended offer: $200k (19.9% below list) — sets the bar for 1% rule.
- Cap rate 6.4% vs local median 3.7% in Apopka — top-decile yield for the area; either an underpriced asset or a hidden risk that comps aren't pricing in. Stress-test before assuming the spread holds.
Location & tenants
- Location reads 66/100 on livability (#594 in FL) — a middle-class / working-renter tenant base. Strengths: housing A+, cost of living B+, employment B; Watch: crime D-, amenities F, commute F.
- Orange (suburban): math 46% / reading 51% proficiency, ranked #43 of 73 in FL (top 59%) — families likely to look elsewhere, expect single-tenant / working-renter base with shorter leases.
- Zoned schools: Dream Lake Elementary (math 52% / reading 52%, grade C-, #990 of 2,144 statewide, top 48%, 694 students, 65% FRL); Apopka High (math 19% / reading 47%, grade F, #406 of 667 statewide, top 61%, 3,507 students, 42% FRL) — zoned schools at 53% FRL track the district average.
- Market conditions: Rents soft (-2.1%/yr); 662 active listings in the ZIP; 11 comparable units currently listed for rent nearby; rentals at typical pace (median 16d on market — plan ~3-4 weeks tenant-placement turnaround); solid renter incomes; 8,053 units permitted in Orange County in 2024 (3,133 in 5+ unit buildings).
Forward outlook
- Local home prices are declining (-3.0%/yr); year-one equity from $2k of loan paydown is wiped out by about $8k of value loss. Plan a longer hold.
- Orange County population projected at +52% by 2050 — long-run rental-demand tailwind backs the buy-and-hold thesis.
Negotiation context
- It's been on market 28 days — a 2% lower offer ($246k) is reasonable based on typical stale-listing flexibility.
- Current owner paid $105k; list at $250k implies a 138% gain — meaningful room to come down on a strong offer.
Risks & watch-outs
- Climate carrying-cost: severe wind risk, 99% chance of damaging wind over 30y; extreme-heat days projected 7→22/yr by 2055 (HVAC capex compounding) — expect insurance premiums to compound above CPI over the hold.
Questions for the listing agent
- Built in 1960 — when were the roof, HVAC, electrical panel, plumbing, and water heater last replaced?
- Is there a deadline driving the sale (1031 exchange, divorce, estate, relocation)? That informs how much negotiation room exists.
- Schools are D-rated, which usually means shorter tenancies and higher turnover. Who's the typical renter profile here, and what's been the actual vacancy rate?
- Crime grade is D in this area — have there been break-ins, vandalism, or insurance claims at this property in the last 3 years? What carrier currently insures it and at what premium?
- The area grade is low — what's the realistic commute time and amenity access for the typical tenant pool here? Any planned neighborhood developments (good or bad) we should know about?
- What's the average days-on-market for RENTAL listings here right now (not sales)? A rising rental-DOM trend means longer vacancies and softer asking-rent achievability than the comps imply.
- What's the recent tenant-quality profile in this submarket — average credit score on applications, eviction rate, late-payment / NSF rate, and stable-employment percentage? A property-management company in the area should have these aggregated.
- How much new for-sale + rental construction is in the pipeline within 1–3 miles? Heavy new supply typically softens prices + rents 12–24 months out; constrained supply supports both.
Investment metrics
- 1% rule
- 0.80% ✗
- Cap rate
- 6.42%
- Cash-on-cash
- 0.46%
- DSCR
- 1.02
- GRM
- 10.4
CMA / ARV
- ARV (on-the-fly)
- $252,568
- Comps found
- 4
Show comp detail 4 sales within ~0.75 mi
| Address | Dist | Beds/Ba | Sqft | Sold | Price | $/sf | Match |
|---|---|---|---|---|---|---|---|
| 26 E Albatross St | 0.25mi | 3/1.5 (+1) | 1,036 (-1%) | 17mo | $250,000 | $241 | 65 |
| 551 Moonbeam Rd | 0.40mi | 3/1.0 (+1) | 1,131 (+8%) | 4mo | $258,000 | $228 | 60 |
| 663 O Shea Ct | 0.37mi | 2/1.0 | 957 (-9%) | 20mo | $275,000 | $287 | 52 |
| 486 Spreading Oak Cir | 0.73mi | 2/2.0 | 998 (-5%) | 4mo | $235,000 | $235 | 50 |
Match score weights: distance 35% · size 25% · config 20% · recency 20%. Top-matched comps best support the ARV.
Projected returns pro-forma
-3.0% appreciation · 0.0% rent growth · sell at horizon
- IRR
- -18.7%
- Equity multiple
- 0.36×
- Total profit
- $-44,748
- Equity at exit
- $37,276
- IRR
- -17.8%
- Equity multiple
- 0.15×
- Total profit
- $-59,754
- Equity at exit
- $21,615
Cash invested: $70,000 (down + closing). Projections, not guarantees.
Landlord ↔ Tenant lean methodology
- Overall (STATE)
- 87 Strongly Landlord-Friendly
- State Florida
- 87 Strongly Landlord-Friendly · R+3
- County
- — inherits STATE
- City
- — inherits STATE
ZIP-level market 32712
- Home prices YoY
- -34.5%
- Rents YoY
- -2.1%
- Active inventory
- 662
- Price-to-rent
- 10.4×
Monthly cashflow live
- Estimated rent
- $2,002 high interval (Pro) →
- Mortgage (P&I)
- −$1,311
- Tax from tax record
- −$140 /mo · $1,679/yr
- Insurance
- −$104
- HOA
- −$0
- Vacancy / Maint / Mgmt
- −$421
- Net cashflow
- $27
Break-even live
Sensitivity live
| Price | -10% $168 | -5% $98 | +0% $27 | +5% $-44 | +10% $-115 |
|---|---|---|---|---|---|
| Rent | -10% $-131 | -5% $-52 | +0% $27 | +5% $106 | +10% $185 |
| Rate | -1.0pp $153 | -0.5pp $90 | base $27 | +0.5pp $-38 | +1.0pp $-104 |
UW: 25.0% down · 7.5% · 30yr · 1.5% tax · 5.0% vac · 8.0% maint · 8.0% mgmt
Financing live
Cash to close
- Down payment
- $62,500
- Closing costs
- $7,500
- Reserves months
- —
- Total cash needed
- —
Loan-product check · same deal, 3 products live
Conventional
25% down · 7.5% · 30yr
- Down + closing
- —
- Monthly P&I
- —
- Monthly cashflow
- —
- DSCR
- —
- Eligible?
- —
Personal DTI + credit; lowest rate.
DSCR
20% down · 8.5% · 30yr
- Down + closing
- —
- Monthly P&I
- —
- Monthly cashflow
- —
- DSCR
- —
- Eligible?
- —
No personal income docs; deal must DSCR.
Hard money
10% down · 12.0% · 12mo
- Down + closing
- —
- Monthly P&I
- —
- Monthly cashflow
- —
- DSCR
- —
- Eligible?
- —
Short-term bridge; refi at stabilization.
Rent comps 11 comps
| Address | Beds | Baths | Sqft | Rent | $/sqft | DOM | Units | Dist |
|---|---|---|---|---|---|---|---|---|
| 3 E Sandpiper St Apopka, FL | 3.0 | 2.0 | 1414 | $1,895 | $1.34 | 24d | 1 | 0.11mi |
| 121 Summerset Dr Apopka, FL | 3.0 | 2.0 | 1155 | $1,971 | $1.71 | 3d | 1 | 0.39mi |
| 63 Jett Loop Apopka, FL | 3.0 | 2.0 | 1463 | $2,050 | $1.40 | 3d | 1 | 0.55mi |
| 220 Bonnie Glen Ln Apopka, FL | 3.0 | 2.0 | 1141 | $2,175 | $1.91 | 5d | 1 | 0.59mi |
| 440 Breezeway Dr Apopka, FL | 3.0 | 2.0 | 1148 | $1,956 | $1.70 | 22d | 1 | 0.71mi |
| 930 Loch Carron #1212 Apopka, FL | 3.0 | 2.0 | 1457 | $2,100 | $1.44 | 5d | 1 | 1.00mi |
| 1103 Errol Place Cir Apopka, FL | 3.0 | 2.0 | 852 | $2,099 | $2.46 | 18d | 1 | 1.31mi |
| 1355 Villa Ln Apopka, FL | 2.0 | 2.5 | 1073 | $1,695 | $1.58 | 20d | 1 | 1.40mi |
| 1106 Villa Ln #81 Apopka, FL | 2.0 | 2.0 | 980 | $1,600 | $1.63 | 8d | 1 | 1.41mi |
| 1118 Villa Ln #87 Apopka, FL | 2.0 | 2.0 | 980 | $1,890 | $1.93 | 24d | 1 | 1.41mi |
| 850 E Votaw Rd Apopka, FL | 2.0 | 1.0 | 912 | $1,595 | $1.75 | 15d | 1 | 1.45mi |
Listing history 6 events
-
2026-05-13status Pending
-
2026-04-14$249,999 Active
-
2017-09-15soldstatus $105,000
-
1987-01-01soldstatus $46,400
-
1978-11-01soldstatus $23,500
-
1977-06-01soldstatus $18,000
ⓘ Source: listings_history table (triggers on properties + properties_extension) + one-shot
backfill from property_details.listing_events for pre-trigger history.
Tax reassessment forecast FL · Resets to sale price
- Current annual tax
- $1,679 · $140/mo
- Projected year-2 tax
- $2,075 · $173/mo
- Expected delta
- +$396/yr (+$33/mo · 23.6%)
ⓘ Screening estimate from a state-policy table — verify with the county assessor before closing.
Climate risk First Street
- Flood 1/10 Low FEMA zone X (unshaded) · 0% chance over 30 yrs
- Wildfire 3/10 Moderate
- Heat 8/10 Severe 7 d/yr ≥108°F today · 22 d/yr by 30 yrs out
- Wind 9/10 Extreme 99% chance of damaging wind over 30 yrs
- Air quality 2/10 Low 1 unhealthy d/yr today · 2 by 30 yrs out
Nearby sold comps map
Loading sold comps map…
Walkable amenities ~0.75 mi
Loading nearby amenities…
Taxation est. · year 1
- Rental income
- $24,029
- − Mortgage interest
- −$14,004
- − Property taxes
- −$1,679
- − Insurance
- −$1,250
- − Repairs & maintenance
- −$1,922
- − Management
- −$1,922
- − Depreciation
- −$7,273
- Taxable loss
- −$4,021
- Est. tax savings @ 24.0%
- +$965
- After-tax cash flow
- $1,287/yr
For passive investors: Depreciation is non-cash, so a rental often shows a tax loss while cash-flowing — sheltering income. Rental losses are passive: they offset passive income freely, and up to $25,000/yr can offset ordinary (W-2) income if you actively participate and your MAGI is under $100k (phasing out to $0 by $150k); unused losses carry forward. On sale, claimed depreciation is recaptured at up to 25%, and gains may owe capital-gains tax (a 1031 exchange can defer both). Figures are a year-1 estimate at your 24.0% rate — not tax advice; consult a CPA.
Schools (NCES district)
- District
- Orange
- NCES district ID
- 1201440
- Math proficiency
- 46% ▼ -9.00%
- Reading proficiency
- 51% ▼ -2.00%
- Median HH income
- $49,350
- Composite
- 41.47/100
- National rank
- #3461
- State rank
- #43 of 73 in FL
Livability — Apopka
- Score
- 66/100
- State rank
- #594
- US rank
- #11020
Category grades
Schools grade is shown separately in the Schools card above.
Census & demographics
- Census place
- Apopka, FL
- County
- Orange County · 1,471,359 people
- City population
- 109,852
- Metro
- Orlando-Kissimmee-Sanford, FL
- Population (ZIP)
- 50,583
- Household income
- $108,734
- Rent vs Own
- Severe rent burden
- 876.0
Population outlook (Orange County) Hauer SSP2
- Today (2025)
- 1,618,226 people
- By 2030
- 1,787,404 · +10.5%
- By 2040
- 2,125,621 · +31.4%
- By 2050
- 2,454,016 · +51.6%
- By 2075
- 3,173,711 · +96.1%
- By 2100
- 3,607,781 · +122.9%
Race, ethnicity, and origin ACS 2023
- Neighborhood character
- Diverse neighborhood (Simpson 0.67)
- Race & ethnicity
- White 48% Hispanic / Latino 26% Two or more races 19% Black 16% Asian 4%
- Hispanic origin (detail)
- Mexican 6% Puerto Rican 7% Cuban 2% Dominican 1%
- Common ancestry
- Romanian 2% Lithuanian 1% Slovak 1%
- Foreign-born
- 19% · Canada, Jamaica, China
- Languages at home
- 73% English-only · Spanish 21% Other Indo-European 1% French/Haitian/Cajun 1%
Political lean MEDSL · Orange
- 2024 margin
- D (+13.6) · D 56.1% · R 42.5% · Other 1.3%
- 2008→2024 swing
- -5.0pp toward R · 2008: 18.6pp · 2024: 13.6pp
- All cycles
- 2024: D+13.6 2020: D+23.1 2016: D+24.6 2012: D+18.2 2008: D+18.6
Not yet ingested
- Civics
- —
Market trends
- HPI YoY
- ▼ -149.12%
- Current HPI
- 283.4441
- Rent YoY
- ▼ -2.09%
- Metro
- Orlando-Kissimmee-Sanford, FL
- State GDP YoY
- ▲ 3.28%
- F500 in state
- 36
Industry mix (Fortune 500 HQ in FL)
| Industry | F500 HQs | Revenue |
|---|---|---|
| Industrial Technology | 2 | $29B |
|
||
| Insurance | 2 | $17B |
|
||
| Retail | 1 | $60B |
|
||
| Technology Distribution | 1 | $58B |
|
||
| Homebuilding | 1 | $35B |
|
||
| Technology Manufacturing | 1 | $35B |
|
||
Price history
+1288.9% since first listed6 events — show timeline
- 2026-05-13 Pending — Stellar MLS as Distributed by MLS Grid
- 2026-04-14 Listed $249,999 Stellar MLS as Distributed by MLS Grid
- 2017-09-15 Sold (Public Records) $105,000 Public Records
- 1987-01-01 Sold (Public Records) $46,400 Public Records
- 1978-11-01 Sold (Public Records) $23,500 Public Records
- 1977-06-01 Sold (Public Records) $18,000 Public Records
Property tax history
+16.1%/yrLatest (2025): $1,679 · +2.7% YoY. Source: county tax records.
Cash-flow waterfall
monthlySold comps — $/sqft
last 12 mo · ≤1 miLoading sold comps…