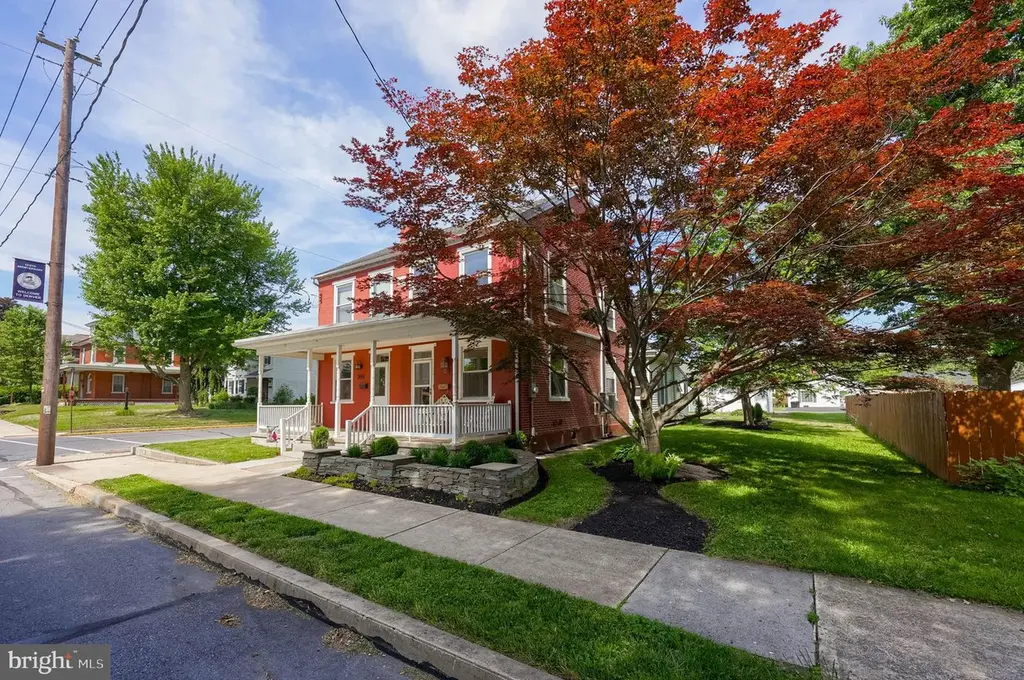
202 N 6th St · Denver, PA
Flood risk 1/10 · Minimal
- FEMA flood zone
- X (unshaded)
- Chance of flooding over 30 yrs
- 0.0%
- Est. flood insurance / yr
- $507 – $1,088
Fire risk 1/10 · Minimal
- Est. fire insurance / yr
- $511 – $949
Heat risk 5/10 · Moderate
- Hot days now (above 99°F)
- 7 days/yr
- Hot days in 30 yrs
- 15 days/yr
Wind risk 4/10 · Minor
- Chance of severe wind over 30 yrs
- 15.0%
Air-quality risk 5/10 · Moderate
- Unhealthy air days now
- 6 days/yr
- Unhealthy air days in 30 yrs
- 8 days/yr
Risk factors via First Street. Map © Google.
Why this score? — see what drove the B grade
The composite is a weighted blend of 9 inputs, each scored 0–100. Each bar is that input's sub-score; the figure is the points it added to the 100-point composite (weight × sub-score).
- Cash flow +30.0/30.0
- ARV discount +10.1/15.0
- DSCR +10.0/10.0
- 1% rule +9.0/10.0
- Schools +4.6/10.0
- Livability +3.7/5.0
- Rent growth +2.5/5.0
- Condition / age +2.5/5.0
- Appreciation +0.0/10.0
$249,800
🖨 Deal sheet (PDF) 📄 Offer letter ✓ Due diligence
Listing remarks MLS
* SHORT SALE * Buyer pays $5K loss mitigation fee.
Key facts
- 2 garage spots
- Built 1856
- Listed 7 days
Property features AI
Exterior
- Parking: Detached garage with two spaces and additional storage area; Driveway parking for one vehicle; Three total garage/parking spaces
- Utilities: Public water; Public sewer; Electric service available; Sewer available; Water available
- Home design: Semi-detached home; Very good condition; Fee simple ownership
- Construction: Brick construction; Stone foundation; Shingle roof; Above-grade and below-grade structures
- Exterior features: Level lot; Patio(s)
Interior
- Kitchen: Pantry (kitchen storage included)
- Bedrooms: Three bedrooms on the upper level; Rooms include Living Room, Dining Room, Bedroom 1, Bedroom 2, Bedroom 3
- Flooring: Carpet; Vinyl; Hardwood
- Bathrooms: Two full bathrooms (one on main level, one on upper level)
- Heating & cooling: Hot water heating (oil-fired); Ductless/mini-split cooling; Window air conditioning units; Electric hot water
- Interior features: Attic; Tub with shower; Pantry; Basement with poured concrete and sump pump; Not furnished
- Laundry & utility: Main floor laundry
Neighborhood map
What this means for you Summary
Snapshot
- This is a 3-bed/1.5-bath townhouse listed at $250k.
Deal economics
- At list price, monthly cash flow is $1k ($12k/yr) — positive.
- The deal already cash-flows at list — no discount required.
- Meets the 1% rule at list price ($4k rent vs $250k).
Location & tenants
- Location reads 73/100 on livability (#592 in PA) — a middle-class / working-renter tenant base. Strengths: crime A+, cost of living A+, housing A+; Watch: amenities F, commute F.
- Cocalico SD (suburban): math 45% / reading 60% proficiency, ranked #130 of 539 in PA (top 24%) — acceptable for families but not a draw, mixed tenant base, ~2y average lease.
- Zoned schools: Denver El Sch (math 51% / reading 63%, grade C+, #444 of 1,518 statewide, top 32%, 437 students, 46% FRL); Cocalico Ms (math 34% / reading 59%, grade D+, #172 of 512 statewide, top 35%, 682 students, 43% FRL); Cocalico Shs (math 78% / reading 24%, grade D+, #121 of 437 statewide, top 28%, 1,008 students, 38% FRL) — zoned schools average 42% FRL vs 22% district-wide (20 pts higher); higher-poverty schools than district average — tighter screening recommended.
- Market conditions: 75 active listings in the ZIP; 1 comparable units currently listed for rent nearby; 1,093 units permitted in Lancaster County in 2024 (201 in 5+ unit buildings).
Forward outlook
- Local home prices are declining (-3.0%/yr); year-one equity from $2k of loan paydown is wiped out by about $7k of value loss. Plan a longer hold.
- Lancaster County population projected at +5% by 2050 — modest demand growth; plan on rents tracking national, not racing it.
- At projected returns (-3.0% appreciation + 3.0% rent growth), your $70k cash investment doubles in ~7 years — after that, you're playing with house money.
Negotiation context
- Only 7 days on market — expect competitive offers; lowballing is unlikely to land.
- 7 sale attempts since 19y ago with the ask held roughly flat each time — persistent listings suggest the price (not the market) is what's stuck; bring a comps-based counter.
- Current owner paid $160k; list at $250k implies a 56% gain — meaningful room to come down on a strong offer.
Risks & watch-outs
- Watch-outs: built in 1856 — expect roof / HVAC / electrical / plumbing capex.
- Climate carrying-cost: extreme-heat days projected 7→15/yr by 2055 (HVAC capex compounding) — expect insurance premiums to compound above CPI over the hold.
Questions for the listing agent
- Built in 1856 — when were the roof, HVAC, electrical panel, plumbing, and water heater last replaced?
- Is there a deadline driving the sale (1031 exchange, divorce, estate, relocation)? That informs how much negotiation room exists.
- Schools are B-rated — typically a magnet for longer-tenancy family renters. What's the average tenant stay here, and is there a school-zone premium baked into asking?
- What's the average days-on-market for RENTAL listings here right now (not sales)? A rising rental-DOM trend means longer vacancies and softer asking-rent achievability than the comps imply.
- What's the recent tenant-quality profile in this submarket — average credit score on applications, eviction rate, late-payment / NSF rate, and stable-employment percentage? A property-management company in the area should have these aggregated.
- How much new for-sale + rental construction is in the pipeline within 1–3 miles? Heavy new supply typically softens prices + rents 12–24 months out; constrained supply supports both.
Investment metrics
- 1% rule
- 1.40% ✓
- Cap rate
- 11.26%
- Cash-on-cash
- 17.73%
- DSCR
- 1.79
- GRM
- 5.9
CMA / ARV
- ARV (on-the-fly)
- $265,356
- Comps found
- 12
Show comp detail 12 sales within ~0.75 mi
| Address | Dist | Beds/Ba | Sqft | Sold | Price | $/sf | Match |
|---|---|---|---|---|---|---|---|
| 424 Walnut St | 0.16mi | 3/1.5 | 1,665 (+2%) | 10mo | $281,000 | $169 | 82 |
| 128 N 4th St | 0.17mi | 3/1.5 | 1,686 (+3%) | 8mo | $243,000 | $144 | 81 |
| 412 Main St | 0.21mi | 3/1.5 | 1,620 (-1%) | 11mo | $220,000 | $136 | 79 |
| 346 Main St | 0.29mi | 3/1.5 | 1,700 (+4%) | 10mo | $264,900 | $156 | 72 |
| 434 Walnut St | 0.15mi | 3/1.0 | 1,601 (-2%) | 21mo | $260,000 | $162 | 70 |
| 715 Oak St | 0.25mi | 4/1.5 (+1) | 1,574 (-4%) | 10mo | $287,000 | $182 | 69 |
| 317 S 4th St | 0.42mi | 3/1.0 | 1,620 (-1%) | 19mo | $249,900 | $154 | 61 |
| 424 Locust St | 0.18mi | 3/1.5 | 1,440 (-12%) | 14mo | $240,000 | $167 | 60 |
| 110 Monroe St | 0.54mi | 3/1.5 | 1,588 (-3%) | 13mo | $267,500 | $168 | 59 |
| 702 Main St | 0.17mi | 3/2.5 | 1,792 (+9%) | 18mo | $270,000 | $151 | 57 |
| 222 Main St | 0.39mi | 3/1.5 | 1,430 (-13%) | 5mo | $137,500 | $96 | 56 |
| 732 Oak St | 0.22mi | 3/1.5 | 1,440 (-12%) | 19mo | $242,000 | $168 | 54 |
Match score weights: distance 35% · size 25% · config 20% · recency 20%. Top-matched comps best support the ARV.
Projected returns pro-forma
-3.0% appreciation · 3.0% rent growth · sell at horizon
- IRR
- 9.2%
- Equity multiple
- 1.36×
- Total profit
- $25,391
- Equity at exit
- $37,246
- IRR
- 18.4%
- Equity multiple
- 2.53×
- Total profit
- $107,082
- Equity at exit
- $21,598
Cash invested: $69,944 (down + closing). Projections, not guarantees.
Landlord ↔ Tenant lean methodology
- Overall (STATE)
- 62 Landlord-Friendly
- State Pennsylvania
- 62 Landlord-Friendly · EVEN
- County
- — inherits STATE
- City
- — inherits STATE
ZIP-level market 17517
- Home prices YoY
- -29.3%
- Active inventory
- 75
- Price-to-rent
- 5.9×
Monthly cashflow live
- Estimated rent
- $3,500 medium interval (Pro) →
- Mortgage (P&I)
- −$1,310
- Tax from tax record
- −$318 /mo · $3,811/yr
- Insurance
- −$104
- HOA
- −$0
- Vacancy / Maint / Mgmt
- −$735
- Net cashflow
- $1,033
Break-even live
Sensitivity live
| Price | -10% $1,175 | -5% $1,104 | +0% $1,033 | +5% $963 | +10% $892 |
|---|---|---|---|---|---|
| Rent | -10% $757 | -5% $895 | +0% $1,033 | +5% $1,172 | +10% $1,310 |
| Rate | -1.0pp $1,159 | -0.5pp $1,097 | base $1,033 | +0.5pp $969 | +1.0pp $903 |
UW: 25.0% down · 7.5% · 30yr · 1.5% tax · 5.0% vac · 8.0% maint · 8.0% mgmt
Financing live
Cash to close
- Down payment
- $62,450
- Closing costs
- $7,494
- Reserves months
- —
- Total cash needed
- —
Loan-product check · same deal, 3 products live
Conventional
25% down · 7.5% · 30yr
- Down + closing
- —
- Monthly P&I
- —
- Monthly cashflow
- —
- DSCR
- —
- Eligible?
- —
Personal DTI + credit; lowest rate.
DSCR
20% down · 8.5% · 30yr
- Down + closing
- —
- Monthly P&I
- —
- Monthly cashflow
- —
- DSCR
- —
- Eligible?
- —
No personal income docs; deal must DSCR.
Hard money
10% down · 12.0% · 12mo
- Down + closing
- —
- Monthly P&I
- —
- Monthly cashflow
- —
- DSCR
- —
- Eligible?
- —
Short-term bridge; refi at stabilization.
Rent comps 1 comps
| Address | Beds | Baths | Sqft | Rent | $/sqft | DOM | Units | Dist |
|---|---|---|---|---|---|---|---|---|
| 985 S Ridge Rd Denver, PA | 4.0 | 1.5 | 1521 | $3,500 | $2.30 | 45d | 1 | 0.68mi |
Listing history 6 events
-
2026-06-15status $249,800 Pending 7 DOM
-
2026-06-15days on market $249,800 Active 7 DOM
-
2026-06-14remarks 699-char remark
-
2026-06-14days on market $249,800 Active 5 DOM
-
2026-06-10days on market $249,800 Active 2 DOM
-
2026-06-09$249,800 Active 1 DOM
ⓘ Source: listings_history table (triggers on properties + properties_extension) + one-shot
backfill from property_details.listing_events for pre-trigger history.
Tax reassessment forecast PA · Partial reset (capped growth)
- Current annual tax
- $3,811 · $318/mo
- Projected year-2 tax
- $3,879 · $323/mo
- Expected delta
- +$68/yr (+$6/mo · 1.8%)
ⓘ Screening estimate from a state-policy table — verify with the county assessor before closing.
Climate risk First Street
- Flood 1/10 Low FEMA zone X (unshaded) · 0% chance over 30 yrs
- Wildfire 1/10 Low
- Heat 5/10 Major 7 d/yr ≥99°F today · 15 d/yr by 30 yrs out
- Wind 4/10 Moderate 15% chance of damaging wind over 30 yrs
- Air quality 5/10 Major 6 unhealthy d/yr today · 8 by 30 yrs out
Nearby sold comps map
Loading sold comps map…
Walkable amenities ~0.75 mi
Loading nearby amenities…
Taxation est. · year 1
- Rental income
- $42,000
- − Mortgage interest
- −$13,993
- − Property taxes
- −$3,811
- − Insurance
- −$1,249
- − Repairs & maintenance
- −$3,360
- − Management
- −$3,360
- − Depreciation
- −$7,267
- Taxable income
- $8,960
- Est. tax owed @ 24.0%
- −$2,150
- After-tax cash flow
- $10,249/yr
For passive investors: Depreciation is non-cash, so a rental often shows a tax loss while cash-flowing — sheltering income. Rental losses are passive: they offset passive income freely, and up to $25,000/yr can offset ordinary (W-2) income if you actively participate and your MAGI is under $100k (phasing out to $0 by $150k); unused losses carry forward. On sale, claimed depreciation is recaptured at up to 25%, and gains may owe capital-gains tax (a 1031 exchange can defer both). Figures are a year-1 estimate at your 24.0% rate — not tax advice; consult a CPA.
Schools (NCES district)
- District
- Cocalico SD
- NCES district ID
- 4206270
- Math proficiency
- 45% ▼ -6.00%
- Reading proficiency
- 60% ▼ -13.00%
- Median HH income
- $63,457
- Composite
- 46.09/100
- National rank
- #2512
- State rank
- #130 of 539 in PA
Livability — Denver
- Score
- 73/100
- State rank
- #592
- US rank
- #5643
Category grades
Schools grade is shown separately in the Schools card above.
Census & demographics
- Census place
- Denver, PA
- Population (ZIP)
- 15,045
Population outlook (Lancaster County) Hauer SSP2
- Today (2025)
- 561,011 people
- By 2030
- 570,969 · +1.8%
- By 2040
- 585,929 · +4.4%
- By 2050
- 591,056 · +5.4%
- By 2075
- 594,747 · +6.0%
- By 2100
- 558,850 · -0.4%
Race, ethnicity, and origin ACS 2023
- Neighborhood character
- Predominantly White (91%)
- Race & ethnicity
- White 91% Hispanic / Latino 5% Two or more races 3%
- Common ancestry
- Romanian 2% Scotch-Irish 2% Lithuanian 1%
- Foreign-born
- 4% · Canada
- Languages at home
- 90% English-only · German/W. Germanic 4% Russian/Polish/Slavic 2% Spanish 2%
Political lean MEDSL · Lancaster
- 2024 margin
- R (+15.9) · D 41.5% · R 57.5%
- 2008→2024 swing
- -4.1pp toward R · 2008: -11.8pp · 2024: -15.9pp
- All cycles
- 2024: R+15.9 2020: R+15.8 2016: R+19.7 2012: R+19.2 2008: R+11.8
Not yet ingested
- Civics
- —
Market trends
- HPI YoY
- ▼ -109.05%
- Current HPI
- 262.8646
- Rent YoY
- —
- Metro
- —
- State GDP YoY
- ▲ 1.68%
- F500 in state
- 34
Industry mix (Fortune 500 HQ in PA)
| Industry | F500 HQs | Revenue |
|---|---|---|
| Healthcare | 2 | $309B |
|
||
| Insurance | 2 | $27B |
|
||
| Telecommunications / Media | 1 | $124B |
|
||
| Industrial Distribution | 1 | $22B |
|
||
| Financial Services | 1 | $20B |
|
||
| Chemicals / Materials | 1 | $18B |
|
||
Price history
+74.8% since first listed22 events — show timeline
- 2026-06-08 Listed $249,800 BRIGHT MLS
- 2026-06-08 Coming Soon $249,800 BRIGHT MLS
- 2022-11-10 Sold (Public Records) $160,000 Public Records
- 2022-11-10 Sold (MLS) $160,000 BRIGHT MLS
- 2022-11-03 Pending — BRIGHT MLS
- 2022-10-25 Price Changed $164,900 BRIGHT MLS
- 2022-10-25 Relisted — BRIGHT MLS
- 2022-07-29 Price Changed $53,000 BRIGHT MLS
- 2022-07-29 Pending — BRIGHT MLS
- 2022-07-26 Price Changed $109,950 BRIGHT MLS
- 2022-07-26 Contingent — BRIGHT MLS
- 2022-07-11 Listed $169,900 BRIGHT MLS
- 2014-10-03 Listing Removed — BRIGHT MLS
- 2014-09-30 Listing Removed — BRIGHT MLS
- 2014-01-20 Listed $139,900 BRIGHT MLS
- 2014-01-20 Listed $139,900 BRIGHT MLS
- 2007-03-02 Sold (Public Records) $142,900 Public Records
- 2007-02-28 Sold (MLS) $142,900 BRIGHT MLS
- 2007-01-05 Listing Removed — BRIGHT MLS
- 2007-01-05 Listing Removed — BRIGHT MLS
- 2007-01-02 Listed $139,900 BRIGHT MLS
- 2007-01-02 Listed $142,900 BRIGHT MLS
Property tax history
+3.7%/yrLatest (2026): $3,811 · +5.7% YoY. Source: county tax records.
Cash-flow waterfall
monthlySold comps — $/sqft
last 12 mo · ≤1 miLoading sold comps…