 Duplex
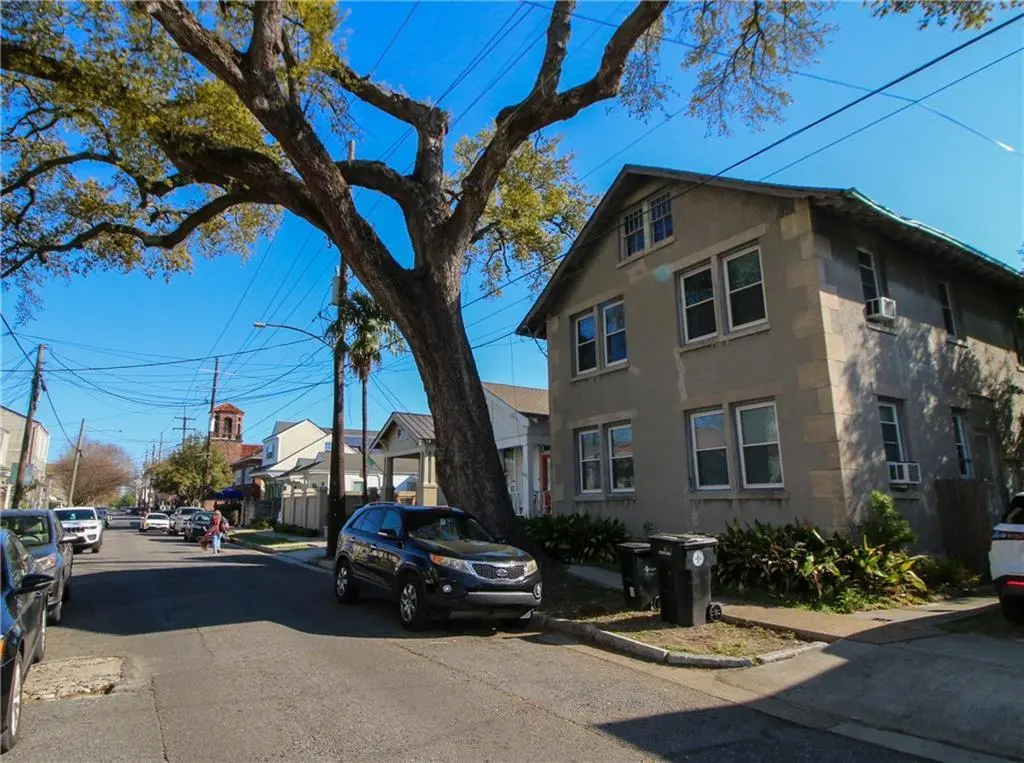
709-711 General Pershing St · New Orleans, LA
Flood risk 6/10 · Moderate
- FEMA flood zone
- X
- Chance of flooding over 30 yrs
- 0.57%
- Est. flood insurance / yr
- $507 – $1,088
Fire risk 1/10 · Minimal
- Est. fire insurance / yr
- $1,269 – $2,357
Heat risk 10/10 · Severe
- Hot days now (above 108°F)
- 7 days/yr
- Hot days in 30 yrs
- 21 days/yr
Wind risk 10/10 · Severe
- Chance of severe wind over 30 yrs
- 99.0%
Air-quality risk 3/10 · Minor
- Unhealthy air days now
- 3 days/yr
- Unhealthy air days in 30 yrs
- 4 days/yr
Risk factors via First Street. Map © Google.
Why this score? — see what drove the D+ grade
The composite is a weighted blend of 9 inputs, each scored 0–100. Each bar is that input's sub-score; the figure is the points it added to the 100-point composite (weight × sub-score).
- Cash flow +14.9/30.0
- ARV discount +10.5/15.0
- DSCR +4.6/10.0
- 1% rule +4.1/10.0
- Livability +4.0/5.0
- Condition / age +3.8/5.0
- Rent growth +2.1/5.0
- Schools +1.6/10.0
- Appreciation +0.0/10.0
$650,000
🖨 Deal sheet (PDF) 📄 Offer letter ✓ Due diligence
Multi-family units
County records classify this as Multi-Family (2-4 Unit). Listing-text estimate: 2 units. confirmed
Listing remarks MLS
Calling all Investors! BEST VALUE and BEST LOCATION UPTOWN! Solid 4plex, Family owned for 80+ years, very well maintained. Easily rented, 4 identical apartments featuring large separate bedrooms, wood floors thru-out. Windows replaced, electrical and plumbing updated. Kitchens and baths rehabbed in 2010. No siding. Stucco exterior and concrete walls mean very little maintenance. Each unit has several combo heat/AC units. Each apartment approximately 1000 sq ft, a rare spacious plus for tenants. Shed in rear contains additional storage and 2 laundry rooms for tenants' use.
Key facts
- Plumbing updated
- Wood floors
- Electrical updated
Tags
Neighborhood map
What this means for you Summary
Snapshot
- This is a 2 × 4-bed/2.0-bath units multifamily listed at $650k. Condition is rated good.
Deal economics
- At list price, monthly cash flow is $192 ($2k/yr) — positive. Per door: $96/mo.
- The deal already cash-flows at list — no discount required.
- To meet the 1% rule (rent ≥ 1% of price), the offer needs to be $593k (8.8% below list).
- Recommended offer: $592k (9.0% below list) — sets the bar for market timing.
- Cap rate 6.6% vs local median 4.4% in New Orleans — top-decile yield for the area; either an underpriced asset or a hidden risk that comps aren't pricing in. Stress-test before assuming the spread holds.
Location & tenants
- Location reads 81/100 on livability (#3 in LA, #1,383 nationally) — a professional / high-income tenant draw. Strengths: amenities A+, commute A+, health & safety A+; Watch: crime C-, employment D.
- Orleans Parish (urban): math 11% / reading 27% proficiency, ranked #69 of 98 in LA (top 70%) — low school quality limits family demand, transient renter base, plan for 1-2y turnover; 68% free/reduced lunch — lower-income household profile, screen leases tightly.
- Zoned schools: Benjamin Franklin Elem. Math And Science (math 12% / reading 23%, grade F, #479 of 646 statewide, top 75%, 747 students, 98% FRL, charter) — zoned schools average 98% FRL vs 68% district-wide (30 pts higher); higher-poverty schools than district average — tighter screening recommended.
- Market conditions: Rents soft (-1.4%/yr); 280 active listings in the ZIP; solid renter incomes; 710 units permitted in Orleans Parish in 2024 (244 in 5+ unit buildings).
- At $5,929/mo this rent would consume 79% of the median local household income ($90k/yr) (locally 1756% of renters already pay >50% of income on rent) — very limited rent-growth headroom before tenants either downsize or default.
Forward outlook
- Local home prices are declining (-3.0%/yr); year-one equity from $4k of loan paydown is wiped out by about $20k of value loss. Plan a longer hold.
- Orleans County population projected at +61% by 2050 — long-run rental-demand tailwind backs the buy-and-hold thesis.
Negotiation context
- It's been on market 93 days — a 9% lower offer ($592k) is reasonable based on typical stale-listing flexibility.
- 2 sale attempts with the ask held roughly flat each time — persistent listings suggest the price (not the market) is what's stuck; bring a comps-based counter.
Risks & watch-outs
- Watch-outs: built in 1940 — expect roof / HVAC / electrical / plumbing capex.
- Climate carrying-cost: major flood risk; severe wind risk, 99% chance of damaging wind over 30y; extreme-heat days projected 7→21/yr by 2055 (HVAC capex compounding) — expect insurance premiums to compound above CPI over the hold.
Questions for the listing agent
- It's been on market 93 days. Have you received any prior offers? Is the seller open to a 9% concession, seller financing, or rate buy-down credit?
- Can we see the unit-by-unit rent roll, current vacancy, and any below-market leases? What's the average tenancy length?
- What capital expenditures (roof, boiler, parking lot, exteriors) have been made in the last 5 years, and what's planned in the next 2?
- Built in 1940 — when were the roof, HVAC, electrical panel, plumbing, and water heater last replaced?
- Why hasn't it sold? Are there any deal-killer items the seller is aware of (foundation, flood, title, zoning, code violations)?
- Is there a deadline driving the sale (1031 exchange, divorce, estate, relocation)? That informs how much negotiation room exists.
- The area grade is low — what's the realistic commute time and amenity access for the typical tenant pool here? Any planned neighborhood developments (good or bad) we should know about?
- What's the average days-on-market for RENTAL listings here right now (not sales)? A rising rental-DOM trend means longer vacancies and softer asking-rent achievability than the comps imply.
- What's the recent tenant-quality profile in this submarket — average credit score on applications, eviction rate, late-payment / NSF rate, and stable-employment percentage? A property-management company in the area should have these aggregated.
- How much new apartment / multifamily construction is in the pipeline within 1–3 miles? Heavy new supply (>2% of stock underway) typically softens rents 12–24 months out; light construction supports rent growth.
Investment metrics
- 1% rule
- 0.91% ✗
- Cap rate
- 6.65%
- Cash-on-cash
- 1.27%
- DSCR
- 1.06
- GRM
- 9.1
CMA / ARV
- ARV (median comp)
- $695,898
- List price
- $650,000
- Delta
- -6.60%
- Verdict
- FAIR
- Comps
- 20 within 1.0 mi
Show comp detail 2 sales within ~0.75 mi
| Address | Dist | Beds/Ba | Sqft | Sold | Price | $/sf | Match |
|---|---|---|---|---|---|---|---|
| 1104-06 Jena St | 0.33mi | 8/— | 3,942 (-1%) | 22mo | $514,000 | $130 | 64 |
| 1420 Valence St | 0.55mi | 7/8.5 (-1) | 4,556 (+14%) | 23mo | $875,000 | $192 | 12 |
Match score weights: distance 35% · size 25% · config 20% · recency 20%. Top-matched comps best support the ARV.
Projected returns pro-forma
-3.0% appreciation · 0.0% rent growth · sell at horizon
- IRR
- -17.7%
- Equity multiple
- 0.39×
- Total profit
- $-110,391
- Equity at exit
- $96,917
- IRR
- -16.9%
- Equity multiple
- 0.19×
- Total profit
- $-147,175
- Equity at exit
- $56,200
Cash invested: $182,000 (down + closing). Projections, not guarantees.
Landlord ↔ Tenant lean methodology
- Overall (STATE)
- 90 Strongly Landlord-Friendly
- State Louisiana
- 90 Strongly Landlord-Friendly · R+12
- County
- — inherits STATE
- City
- — inherits STATE
ZIP-level market 70115
- Rents YoY
- -1.4%
- Active inventory
- 280
- Price-to-rent
- 18.3×
Monthly cashflow live
- Estimated rent
- $5,929 high interval (Pro) →
- Mortgage (P&I)
- −$3,409
- Tax est. 1.5%
- −$812 /mo · $9,750/yr
- Insurance
- −$271
- HOA
- −$0
- Vacancy / Maint / Mgmt
- −$1,245
- Net cashflow
- $192
Break-even live
Sensitivity live
| Price | -10% $641 | -5% $417 | +0% $192 | +5% $-33 | +10% $-257 |
|---|---|---|---|---|---|
| Rent | -10% $-276 | -5% $-42 | +0% $192 | +5% $426 | +10% $660 |
| Rate | -1.0pp $519 | -0.5pp $357 | base $192 | +0.5pp $23 | +1.0pp $-148 |
2-unit breakdown (identical units grouped — click to expand)
| Units | Beds | Baths | Est. rent |
|---|---|---|---|
| 2× units | 4 | 2 | $5,928 |
| #1 | 4 | 2 | $2,964 |
| #2 | 4 | 2 | $2,964 |
| Total (2 units) | $5,929 | ||
UW: 25.0% down · 7.5% · 30yr · 1.5% tax · 5.0% vac · 8.0% maint · 8.0% mgmt
Financing live
Cash to close
- Down payment
- $162,500
- Closing costs
- $19,500
- Reserves months
- —
- Total cash needed
- —
Loan-product check · same deal, 3 products live
Conventional
25% down · 7.5% · 30yr
- Down + closing
- —
- Monthly P&I
- —
- Monthly cashflow
- —
- DSCR
- —
- Eligible?
- —
Personal DTI + credit; lowest rate.
DSCR
20% down · 8.5% · 30yr
- Down + closing
- —
- Monthly P&I
- —
- Monthly cashflow
- —
- DSCR
- —
- Eligible?
- —
No personal income docs; deal must DSCR.
Hard money
10% down · 12.0% · 12mo
- Down + closing
- —
- Monthly P&I
- —
- Monthly cashflow
- —
- DSCR
- —
- Eligible?
- —
Short-term bridge; refi at stabilization.
Listing history 17 events
-
2026-06-21days on market $650,000 Active 93 DOM
-
2026-06-18days on market $650,000 Active 90 DOM
-
2026-06-17days on market $650,000 Active 89 DOM
-
2026-06-16days on market $650,000 Active 88 DOM
-
2026-06-15days on market $650,000 Active 87 DOM
-
2026-06-13days on market $650,000 Active 85 DOM
-
2026-06-10days on market $650,000 Active 82 DOM
-
2026-06-09days on market $650,000 Active 81 DOM
-
2026-06-08days on market $650,000 Active 80 DOM
-
2026-06-07days on market $650,000 Active 79 DOM
-
2026-06-05days on market $650,000 Active 76 DOM
-
2026-06-03days on market $650,000 Active 75 DOM
-
2026-06-02days on market $650,000 Active 74 DOM
-
2026-06-01days on market $650,000 Active 73 DOM
-
2026-05-31days on market $650,000 Active 72 DOM
-
2026-03-20$650,000 Active 578-char remark
Show marketing remark (578 chars)
Calling all Investors! BEST VALUE and BEST LOCATION UPTOWN! Solid 4plex, Family owned for 80+ years, very well maintained. Easily rented, 4 identical apartments featuring large separate bedrooms, wood floors thru-out. Windows replaced, electrical and plumbing updated. Kitchens and baths rehabbed in 2010. No siding. Stucco exterior and concrete walls mean very little maintenance. Each unit has several combo heat/AC units. Each apartment approximately 1000 sq ft, a rare spacious plus for tenants. Shed in rear contains additional storage and 2 laundry rooms for tenants' use.
ⓘ Source: listings_history table (triggers on properties + properties_extension) + one-shot
backfill from property_details.listing_events for pre-trigger history.
Climate risk First Street
- Flood 6/10 Major FEMA zone X · 57% chance over 30 yrs
- Wildfire 1/10 Low
- Heat 10/10 Extreme 7 d/yr ≥108°F today · 21 d/yr by 30 yrs out
- Wind 10/10 Extreme 99% chance of damaging wind over 30 yrs
- Air quality 3/10 Moderate 3 unhealthy d/yr today · 4 by 30 yrs out
Nearby sold comps map
Loading sold comps map…
Walkable amenities ~0.75 mi
Loading nearby amenities…
Taxation est. · year 1
- Rental income
- $71,148
- − Mortgage interest
- −$36,410
- − Property taxes
- −$9,750
- − Insurance
- −$3,250
- − Repairs & maintenance
- −$5,692
- − Management
- −$5,692
- − Depreciation
- −$18,909
- Taxable loss
- −$8,555
- Est. tax savings @ 24.0%
- +$2,053
- After-tax cash flow
- $4,356/yr
For passive investors: Depreciation is non-cash, so a rental often shows a tax loss while cash-flowing — sheltering income. Rental losses are passive: they offset passive income freely, and up to $25,000/yr can offset ordinary (W-2) income if you actively participate and your MAGI is under $100k (phasing out to $0 by $150k); unused losses carry forward. On sale, claimed depreciation is recaptured at up to 25%, and gains may owe capital-gains tax (a 1031 exchange can defer both). Figures are a year-1 estimate at your 24.0% rate — not tax advice; consult a CPA.
Condition & rehab AI · 12 photos
This 4plex is in good condition with updated kitchens and bathrooms, wood flooring, and a well-maintained exterior. It offers a great investment opportunity with potential for rental value increase through landscaping and curb appeal improvements.
Value-add opportunities
- Both Landscaping and curb appeal improvements — Enhances curb appeal and can attract more tenants.
- Both Painting exterior walls — Fresh paint can improve the home's appearance and value.
- Both Landscaping and curb appeal improvements — Enhances curb appeal and can attract more tenants.
Renovation cost estimate screening
Value-add ROI direction
- Both Landscaping and curb appeal improvements — Enhances curb appeal and can attract more tenants. ↑
- Both Painting exterior walls — Fresh paint can improve the home's appearance and value. ↑
- Both Landscaping and curb appeal improvements — Enhances curb appeal and can attract more tenants. ↑
ⓘ Cost ranges are severity-bucket heuristics (US national rule-of-thumb). Get contractor quotes + a written scope before underwriting a rehab budget.
Schools (NCES district)
- District
- Orleans Parish
- NCES district ID
- 2201170
- Math proficiency
- 11% ▼ -52.00%
- Reading proficiency
- 27% ▼ -46.00%
- Median HH income
- $37,011
- Composite
- 15.78/100
- National rank
- #9271
- State rank
- #69 of 98 in LA
Livability — New Orleans
- Score
- 81/100
- State rank
- #3
- US rank
- #1383
Category grades
Schools grade is shown separately in the Schools card above.
Census & demographics
- Census place
- New Orleans, LA
- County
- Orleans Parish · 338,817 people
- City population
- 338,817
- Metro
- New Orleans-Metairie, LA
- Population (ZIP)
- 31,183
- Household income
- $90,182
- Rent vs Own
- Severe rent burden
- 1756.0
Population outlook (Orleans County) Hauer SSP2
- Today (2025)
- 513,025 people
- By 2030
- 575,781 · +12.2%
- By 2040
- 700,174 · +36.5%
- By 2050
- 826,541 · +61.1%
- By 2075
- 1,123,374 · +119.0%
- By 2100
- 1,355,609 · +164.2%
Race, ethnicity, and origin ACS 2023
- Neighborhood character
- Diverse neighborhood (Simpson 0.58)
- Race & ethnicity
- White 59% Black 26% Two or more races 8% Hispanic / Latino 7% Asian 3%
- Hispanic origin (detail)
- Mexican 1%
- Common ancestry
- Lithuanian 8% Italian 3% Slovak 3%
- Foreign-born
- 5% · Canada, China
- Languages at home
- 91% English-only · Spanish 4% French/Haitian/Cajun 2% Other Indo-European 1%
Political lean MEDSL · Orleans
- 2024 margin
- Solid D (+67.0) · D 82.2% · R 15.2% · Other 2.7%
- 2008→2024 swing
- +6.7pp toward D · 2008: 60.3pp · 2024: 67.0pp
- All cycles
- 2024: D+67.0 2020: D+68.2 2016: D+66.2 2012: D+62.5 2008: D+60.3
Not yet ingested
- Civics
- —
Market trends
- HPI YoY
- ▼ -272.08%
- Current HPI
- 287.2138
- Rent YoY
- ▼ -1.42%
- Metro
- New Orleans-Metairie, LA
- State GDP YoY
- ▲ 3.29%
- F500 in state
- 10
Industry mix (Fortune 500 HQ in LA)
| Industry | F500 HQs | Revenue |
|---|---|---|
| Telecommunications | 2 | $23B |
|
||
| Utilities | 1 | $12B |
|
||
| Wholesale / Distribution | 1 | $5B |
|
||
| Advertising | 1 | $2B |
|
||
Price history
+0.0% since first listed2 events — show timeline
- 2026-03-20 Listed $650,000 AcadianaMLS
- 2026-03-20 Listed $650,000 GSREIN
Cash-flow waterfall
monthlySold comps — $/sqft
last 12 mo · ≤1 miLoading sold comps…