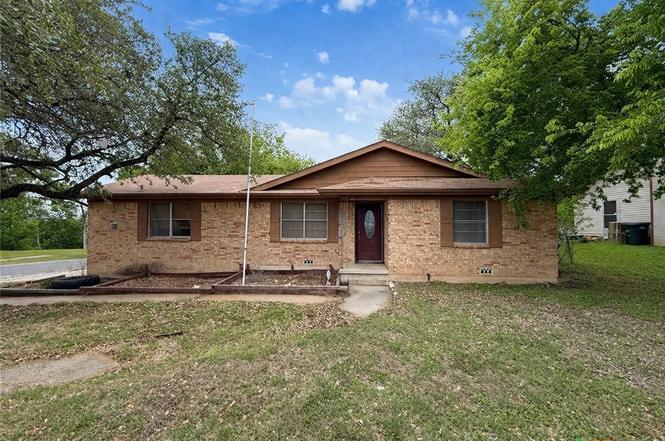
2301 Post Oak Ave · Copperas Cove, TX
Flood risk 1/10 · Minimal
- FEMA flood zone
- X (unshaded)
- Chance of flooding over 30 yrs
- 0.0%
- Est. flood insurance / yr
- $507 – $1,088
Fire risk 6/10 · Moderate
- Est. fire insurance / yr
- $1,222 – $2,270
Heat risk 7/10 · Major
- Hot days now (above 106°F)
- 6 days/yr
- Hot days in 30 yrs
- 20 days/yr
Wind risk 6/10 · Moderate
- Chance of severe wind over 30 yrs
- 56.0%
Air-quality risk 1/10 · Minimal
- Unhealthy air days now
- 0 days/yr
- Unhealthy air days in 30 yrs
- 0 days/yr
Risk factors via First Street. Map © Google.
Why this score? — see what drove the C- grade
The composite is a weighted blend of 9 inputs, each scored 0–100. Each bar is that input's sub-score; the figure is the points it added to the 100-point composite (weight × sub-score).
- Cash flow +16.0/30.0
- ARV discount +15.0/15.0
- 1% rule +5.2/10.0
- DSCR +5.0/10.0
- Schools +3.6/10.0
- Livability +3.2/5.0
- Condition / age +2.5/5.0
- Rent growth +2.4/5.0
- Appreciation +0.0/10.0
$139,999
🖨 Deal sheet (PDF) 📄 Offer letter ✓ Due diligence
Listing remarks
This spacious and versatile 3 bedroom, 2 bath home sits proudly on a desirable corner lot, offering both privacy and curb appeal. Inside, you’ll find a functional layout designed to fit a variety of lifestyles, including two additional rooms, perfect for a home office, playroom, guest space, or hobby area. The heart of the home is the large kitchen, featuring an abundance of cabinet space, ideal for anyone who loves to cook, entertain, or simply stay organized. Whether you're preparing everyday meals or hosting gatherings, this kitchen is ready to meet your needs. Step outside to enjoy a private backyard, providing a peaceful retreat for relaxing evenings, pets, or weekend BBQs. The c
Key facts
- Private backyard
- Large kitchen
- Two additional rooms
Tags
Property features AI
Exterior
- Utilities: Public water (not connected at lot); Public sewer (not connected at lot)
- Home design: Single-story; Resale property
- Construction: Brick construction; Composition/shingle roof; Pillar/post/pier foundation; Year built source: Assessor
- Exterior features: Private yard; Back yard fencing; City lot, less than quarter acre; City street frontage
Interior
- Kitchen: Gas range; Some gas appliances
- Bedrooms: Living Room listed as a primary room
- Flooring: Wood floors
- Bathrooms: 2 full bathrooms
- Heating & cooling: Central heating (natural gas); Central air conditioning
- Interior features: Ceiling fan(s)
- Laundry & utility: Dedicated laundry room
Neighborhood map
What this means for you Summary
Snapshot
- This is a 3-bed/2.0-bath single-family listed at $140k.
Deal economics
- At list price, monthly cash flow is $70 ($841/yr) — positive.
- The deal already cash-flows at list — no discount required.
- Meets the 1% rule at list price ($1k rent vs $140k).
- Cap rate 6.9% vs local median 3.5% in Copperas Cove — top-decile yield for the area; either an underpriced asset or a hidden risk that comps aren't pricing in. Stress-test before assuming the spread holds.
Location & tenants
- Location reads 65/100 on livability (#706 in TX) — a middle-class / working-renter tenant base. Strengths: cost of living A+, housing A+; Watch: employment D+, amenities F, commute F.
- Copperas Cove ISD (suburban): math 41% / reading 42% proficiency, ranked #340 of 826 in TX (top 41%) — families likely to look elsewhere, expect single-tenant / working-renter base with shorter leases.
- Zoned schools: Fairview/Miss Jewell El (math 39% / reading 42%, grade F, #1,490 of 4,322 statewide, top 35%, 500 students, 77% FRL); Copperas Cove J H (math 43% / reading 42%, grade D-, #553 of 1,662 statewide, top 34%, 924 students, 63% FRL); Copperas Cove H S (math 29% / reading 42%, grade F, #941 of 1,632 statewide, top 58%, 2,277 students, 52% FRL) — zoned schools average 64% FRL vs 41% district-wide (23 pts higher); higher-poverty schools than district average — tighter screening recommended.
- Market conditions: Rents soft (-0.2%/yr); 610 active listings in the ZIP; 40 comparable units currently listed for rent nearby; rentals lingering (median 46d on market — plan ~5-8 weeks vacancy on turnover, expect pricing pressure); 55% of comp listings sitting > 30 days — soft ceiling on asking rent; 386 units permitted in Coryell County in 2024 (0 in 5+ unit buildings).
Forward outlook
- Local home prices are declining (-3.0%/yr); year-one equity from $968 of loan paydown is wiped out by about $4k of value loss. Plan a longer hold.
Negotiation context
- Only 5 days on market — expect competitive offers; lowballing is unlikely to land.
- 5 sale attempts since 20y ago with the ask held roughly flat each time — persistent listings suggest the price (not the market) is what's stuck; bring a comps-based counter.
Risks & watch-outs
- Climate carrying-cost: major wind risk, 56% chance of damaging wind over 30y; major wildfire risk; extreme-heat days projected 6→20/yr by 2055 (HVAC capex compounding) — expect insurance premiums to compound above CPI over the hold.
Questions for the listing agent
- Built in 1967 — when were the roof, HVAC, electrical panel, plumbing, and water heater last replaced?
- Is there a deadline driving the sale (1031 exchange, divorce, estate, relocation)? That informs how much negotiation room exists.
- What's the average days-on-market for RENTAL listings here right now (not sales)? A rising rental-DOM trend means longer vacancies and softer asking-rent achievability than the comps imply.
- What's the recent tenant-quality profile in this submarket — average credit score on applications, eviction rate, late-payment / NSF rate, and stable-employment percentage? A property-management company in the area should have these aggregated.
- How much new for-sale + rental construction is in the pipeline within 1–3 miles? Heavy new supply typically softens prices + rents 12–24 months out; constrained supply supports both.
Investment metrics
- 1% rule
- 1.02% ✓
- Cap rate
- 6.89%
- Cash-on-cash
- 2.15%
- DSCR
- 1.10
- GRM
- 8.2
CMA / ARV
- ARV (on-the-fly)
- $232,188
- Comps found
- 6
Show comp detail 6 sales within ~0.75 mi
| Address | Dist | Beds/Ba | Sqft | Sold | Price | $/sf | Match |
|---|---|---|---|---|---|---|---|
| 2307 Veterans Ave | 0.29mi | 3/2.0 | 1,800 (+2%) | 8mo | $250,000 | $139 | 76 |
| 1010 S 31st St | 0.30mi | 3/2.5 | 1,968 (+12%) | 4mo | $209,000 | $106 | 61 |
| 1605 Freedom Ln | 0.66mi | 3/2.0 | 1,894 (+8%) | 6mo | $259,900 | $137 | 51 |
| 902 Tank St | 0.41mi | 4/2.5 (+1) | 2,001 (+14%) | 4mo | $260,000 | $130 | 48 |
| 802 S 23rd St | 0.64mi | 3/1.5 | 1,506 (-14%) | 1mo | $93,730 | $62 | 43 |
| 1101 Rhonda Lee St | 0.43mi | 4/4.0 (+1) | 2,012 (+14%) | 1mo | $265,000 | $132 | 42 |
Match score weights: distance 35% · size 25% · config 20% · recency 20%. Top-matched comps best support the ARV.
Projected returns pro-forma
-3.0% appreciation · 0.0% rent growth · sell at horizon
- IRR
- -16.6%
- Equity multiple
- 0.43×
- Total profit
- $-22,314
- Equity at exit
- $20,874
- IRR
- -15.6%
- Equity multiple
- 0.25×
- Total profit
- $-29,487
- Equity at exit
- $12,105
Cash invested: $39,200 (down + closing). Projections, not guarantees.
Landlord ↔ Tenant lean methodology
- Overall (STATE)
- 87 Strongly Landlord-Friendly
- State Texas
- 87 Strongly Landlord-Friendly · R+5
- County
- — inherits STATE
- City
- — inherits STATE
ZIP-level market 76522
- Home prices YoY
- -22.4%
- Rents YoY
- -0.2%
- Active inventory
- 610
- Price-to-rent
- 8.2×
Monthly cashflow live
- Estimated rent
- $1,422 high interval (Pro) →
- Mortgage (P&I)
- −$734
- Tax from tax record
- −$261 /mo · $3,132/yr
- Insurance
- −$58
- HOA
- −$0
- Vacancy / Maint / Mgmt
- −$299
- Net cashflow
- $70
Break-even live
Sensitivity live
| Price | -10% $149 | -5% $110 | +0% $70 | +5% $30 | +10% $-9 |
|---|---|---|---|---|---|
| Rent | -10% $-42 | -5% $14 | +0% $70 | +5% $126 | +10% $182 |
| Rate | -1.0pp $141 | -0.5pp $106 | base $70 | +0.5pp $34 | +1.0pp $-3 |
UW: 25.0% down · 7.5% · 30yr · 1.5% tax · 5.0% vac · 8.0% maint · 8.0% mgmt
Financing live
Cash to close
- Down payment
- $35,000
- Closing costs
- $4,200
- Reserves months
- —
- Total cash needed
- —
Loan-product check · same deal, 3 products live
Conventional
25% down · 7.5% · 30yr
- Down + closing
- —
- Monthly P&I
- —
- Monthly cashflow
- —
- DSCR
- —
- Eligible?
- —
Personal DTI + credit; lowest rate.
DSCR
20% down · 8.5% · 30yr
- Down + closing
- —
- Monthly P&I
- —
- Monthly cashflow
- —
- DSCR
- —
- Eligible?
- —
No personal income docs; deal must DSCR.
Hard money
10% down · 12.0% · 12mo
- Down + closing
- —
- Monthly P&I
- —
- Monthly cashflow
- —
- DSCR
- —
- Eligible?
- —
Short-term bridge; refi at stabilization.
Rent comps 40 comps
| Address | Beds | Baths | Sqft | Rent | $/sqft | DOM | Units | Dist |
|---|---|---|---|---|---|---|---|---|
| 1307 Sherry Ln Unit B Copperas Cove, TX | 2.0 | 1.0 | 1775 | $1,299 | $0.73 | 46d | 1 | 0.24mi |
| 1302 S 23rd St Copperas Cove, TX | 4.0 | 1.5 | 1453 | $1,320 | $0.91 | 46d | 1 | 0.28mi |
| 1008 S 31st St Copperas Cove, TX | 3.0 | 2.0 | 1350 | $1,145 | $0.85 | 16d | 1 | 0.30mi |
| 1006 S 21st St Copperas Cove, TX | 4.0 | 2.0 | 1445 | $1,100 | $0.76 | 46d | 1 | 0.45mi |
| 1217 Craig St Copperas Cove, TX | 3.0 | 2.0 | 1341 | $1,575 | $1.17 | 46d | 1 | 0.49mi |
| 1005 S 19th St Copperas Cove, TX | 3.0 | 1.5 | 1356 | $1,100 | $0.81 | 46d | 1 | 0.51mi |
| 903 Curry Ave Copperas Cove, TX | 3.0 | 2.5 | 1285 | $1,200 | $0.93 | 25d | 1 | 0.54mi |
| 1122 Rhonda Lee St Copperas Cove, TX | 3.0 | 2.0 | 1349 | $1,300 | $0.96 | 25d | 1 | 0.55mi |
| 603 Westview Cir Unit A Copperas Cove, TX | 2.0 | 1.0 | 1537 | $700 | $0.46 | 46d | 1 | 0.57mi |
| 806 S 25th St Copperas Cove, TX | 3.0 | 2.0 | 1400 | $1,400 | $1.00 | 46d | 1 | 0.59mi |
| 1005 S 11th St Copperas Cove, TX | 4.0 | 2.0 | 1236 | $1,090 | $0.88 | 46d | 1 | 0.69mi |
| 504 Highway Ave Unit B Copperas Cove, TX | 2.0 | 1.0 | 1500 | $700 | $0.47 | 46d | 1 | 0.79mi |
| 507 Skyline Dr Copperas Cove, TX | 3.0 | 2.0 | 1889 | $2,200 | $1.16 | 46d | 1 | 0.84mi |
| 3004 Sundown Ln Copperas Cove, TX | 4.0 | 2.0 | 1608 | $1,895 | $1.18 | 25d | 1 | 0.89mi |
| 309 Myra Lou Ave Copperas Cove, TX | 3.0 | 2.0 | 1269 | $1,125 | $0.89 | 46d | 1 | 0.93mi |
| 336 Skyline Dr Copperas Cove, TX | 4.0 | 2.0 | 2420 | $2,500 | $1.03 | 16d | 1 | 0.97mi |
| 502 S 9th St Copperas Cove, TX | 3.0 | 1.5 | 1479 | $1,150 | $0.78 | 46d | 1 | 1.02mi |
| 1613 Miranda Ave Copperas Cove, TX | 3.0 | 2.0 | 1630 | $1,395 | $0.86 | 25d | 1 | 1.06mi |
| 2312 Guy Cir Copperas Cove, TX | 4.0 | 3.0 | 2491 | $1,745 | $0.70 | 25d | 1 | 1.16mi |
| 911 Brookview Dr Unit B Copperas Cove, TX | 3.0 | 2.0 | 2566 | $1,100 | $0.43 | 46d | 1 | 1.17mi |
| 2201 Dennis St Copperas Cove, TX | 4.0 | 2.5 | 2000 | $1,795 | $0.90 | 16d | 1 | 1.22mi |
| 2313 Bernice Cir Copperas Cove, TX | 4.0 | 2.0 | 1492 | $1,650 | $1.11 | 46d | 1 | 1.24mi |
| 509 West Avenue B Copperas Cove, TX | 3.0 | 2.0 | 1339 | $1,175 | $0.88 | 25d | 1 | 1.26mi |
| 1002 W Avenue B Unit B Copperas Cove, TX | 2.0 | 2.0 | 1842 | $975 | $0.53 | 46d | 1 | 1.26mi |
| 1117 Katelyn Cir Copperas Cove, TX | 4.0 | 2.0 | 1527 | $1,595 | $1.04 | 16d | 1 | 1.27mi |
| 414 West Avenue C Unit C Copperas Cove, TX | 3.0 | 2.0 | 1343 | $1,600 | $1.19 | 46d | 1 | 1.27mi |
| 1508 Cline Dr Copperas Cove, TX | 4.0 | 2.0 | 1526 | $3,300 | $2.16 | 46d | 1 | 1.27mi |
| 412 West Avenue C Unit C Copperas Cove, TX | 3.0 | 2.0 | 1343 | $1,600 | $1.19 | 23d | 1 | 1.27mi |
| 902 Lynn Ln Copperas Cove, TX | 3.0 | 2.0 | 1661 | $1,600 | $0.96 | 16d | 1 | 1.29mi |
| 1904 Pleasant Ln Copperas Cove, TX | 3.0 | 2.0 | 1352 | $1,400 | $1.04 | 46d | 1 | 1.32mi |
| 1713 Castroville Trl Unit B Copperas Cove, TX | 3.0 | 2.0 | 1242 | $1,300 | $1.05 | 46d | 1 | 1.35mi |
| 1708 Castroville Trl Unit 1708 B Castroville Copperas Cove, TX | 2.0 | 2.5 | 1282 | $1,375 | $1.07 | 16d | 1 | 1.36mi |
| 912 Laurie Ln Copperas Cove, TX | 3.0 | 2.0 | 2080 | $1,700 | $0.82 | 16d | 1 | 1.39mi |
| 809 Shady Ln Copperas Cove, TX | 4.0 | 1.5 | 1900 | $1,600 | $0.84 | 16d | 1 | 1.40mi |
| 1805 Castroville Trl Unit B Copperas Cove, TX | 3.0 | 2.0 | 1334 | $1,325 | $0.99 | 25d | 1 | 1.40mi |
| 605 N 11th St Copperas Cove, TX | 3.0 | 2.0 | 1432 | $1,575 | $1.10 | 46d | 1 | 1.41mi |
| 1705 Montell St Unit B Copperas Cove, TX | 3.0 | 2.0 | 2498 | $1,225 | $0.49 | 46d | 1 | 1.42mi |
| 1902 Castroville Trl Unit A 1902 Copperas Cove, TX | 3.0 | 2.0 | 1250 | $1,350 | $1.08 | 25d | 1 | 1.44mi |
| 1802 Montell St Unit A Copperas Cove, TX | 3.0 | 2.0 | 1334 | $1,299 | $0.97 | 46d | 1 | 1.45mi |
| 1809 Clovis Dr Unit B Copperas Cove, TX | 3.0 | 2.0 | 1334 | $1,375 | $1.03 | 16d | 1 | 1.45mi |
Listing history 4 events
-
2026-06-21days on market $139,999 Active 5 DOM
-
2026-06-18days on market $139,999 Active 2 DOM
-
2026-06-17remarks 693-char remark
-
2026-06-17$139,999 Active 1 DOM
ⓘ Source: listings_history table (triggers on properties + properties_extension) + one-shot
backfill from property_details.listing_events for pre-trigger history.
Tax reassessment forecast TX · Resets to sale price
- Current annual tax
- $3,132 · $261/mo
- Projected year-2 tax
- $3,132 · $261/mo
- Expected delta
- $0/yr ($0/mo · 0.0%)
ⓘ Screening estimate from a state-policy table — verify with the county assessor before closing.
Climate risk First Street
- Flood 1/10 Low FEMA zone X (unshaded) · 0% chance over 30 yrs
- Wildfire 6/10 Major
- Heat 7/10 Severe 6 d/yr ≥106°F today · 20 d/yr by 30 yrs out
- Wind 6/10 Major 56% chance of damaging wind over 30 yrs
- Air quality 1/10 Low 0 unhealthy d/yr today · 0 by 30 yrs out
Nearby sold comps map
Loading sold comps map…
Walkable amenities ~0.75 mi
Loading nearby amenities…
Taxation est. · year 1
- Rental income
- $17,068
- − Mortgage interest
- −$7,842
- − Property taxes
- −$3,132
- − Insurance
- −$700
- − Repairs & maintenance
- −$1,365
- − Management
- −$1,365
- − Depreciation
- −$4,073
- Taxable loss
- −$1,410
- Est. tax savings @ 24.0%
- +$338
- After-tax cash flow
- $1,180/yr
For passive investors: Depreciation is non-cash, so a rental often shows a tax loss while cash-flowing — sheltering income. Rental losses are passive: they offset passive income freely, and up to $25,000/yr can offset ordinary (W-2) income if you actively participate and your MAGI is under $100k (phasing out to $0 by $150k); unused losses carry forward. On sale, claimed depreciation is recaptured at up to 25%, and gains may owe capital-gains tax (a 1031 exchange can defer both). Figures are a year-1 estimate at your 24.0% rate — not tax advice; consult a CPA.
Schools (NCES district)
- District
- Copperas Cove ISD
- NCES district ID
- 4815240
- Math proficiency
- 41% ▼ -6.00%
- Reading proficiency
- 42% ▼ -2.00%
- Median HH income
- $51,072
- Composite
- 35.85/100
- National rank
- #4822
- State rank
- #340 of 826 in TX
Livability — Copperas Cove
- Score
- 65/100
- State rank
- #706
- US rank
- #13158
Category grades
Schools grade is shown separately in the Schools card above.
Census & demographics
- Census place
- Copperas Cove, TX
- County
- Coryell County · 61,053 people
- City population
- 42,118
- Metro
- Killeen-Temple, TX
- Population (ZIP)
- 42,118
- Household income
- $72,206
- Rent vs Own
- Severe rent burden
- 1019.0
Population outlook (Coryell County) Hauer SSP2
- Today (2025)
- 75,485 people
- By 2030
- 75,627 · +0.2%
- By 2040
- 74,898 · -0.8%
- By 2050
- 74,221 · -1.7%
- By 2075
- 72,688 · -3.7%
- By 2100
- 66,862 · -11.4%
Race, ethnicity, and origin ACS 2023
- Neighborhood character
- Diverse neighborhood (Simpson 0.66)
- Race & ethnicity
- White 53% Hispanic / Latino 21% Two or more races 20% Black 14% Asian 2%
- Hispanic origin (detail)
- Mexican 11% Puerto Rican 6%
- Common ancestry
- Romanian 2% Italian 2% Lithuanian 2%
- Foreign-born
- 7% · Canada, South Korea
- Languages at home
- 85% English-only · Spanish 10% German/W. Germanic 2% Other Asian/Pacific 1%
Political lean MEDSL · Coryell
- 2024 margin
- Solid R (+40.7) · D 29.1% · R 69.8% · Other 1.1%
- 2008→2024 swing
- -13.8pp toward R · 2008: -26.9pp · 2024: -40.7pp
- All cycles
- 2024: R+40.7 2020: R+33.5 2016: R+39.5 2012: R+36.6 2008: R+26.9
Not yet ingested
- Civics
- —
Market trends
- HPI YoY
- ▼ -53.11%
- Current HPI
- 183.9452
- Rent YoY
- ▼ -0.25%
- Metro
- Killeen-Temple, TX
- State GDP YoY
- ▲ 3.95%
- F500 in state
- 110
Industry mix (Fortune 500 HQ in TX)
| Industry | F500 HQs | Revenue |
|---|---|---|
| Energy | 16 | $1,198B |
|
||
| Technology | 5 | $198B |
|
||
| Engineering / Construction | 4 | $72B |
|
||
| Energy Services | 3 | $60B |
|
||
| Utilities | 3 | $41B |
|
||
| Healthcare | 2 | $330B |
|
||
Price history
+69.7% since first listed10 events — show timeline
- 2026-06-16 Listed $139,999 CTXMLS
- 2026-04-21 Listing Removed — CTXMLS
- 2026-04-18 Contingent — CTXMLS
- 2026-04-08 Listed $119,000 CTXMLS
- 2021-02-23 Sold (Public Records) — Public Records
- 2020-11-04 Listed $140,000 CTXMLS
- 2020-10-19 Listing Removed — NTREIS
- 2020-07-06 Listed $145,000 NTREIS
- 2006-11-17 Sold (Public Records) — Public Records
- 2006-08-19 Listed $82,500 CTXMLS
Property tax history
+4.0%/yrLatest (2025): $3,132 · -5.3% YoY. Source: county tax records.
Cash-flow waterfall
monthlySold comps — $/sqft
last 12 mo · ≤1 miLoading sold comps…