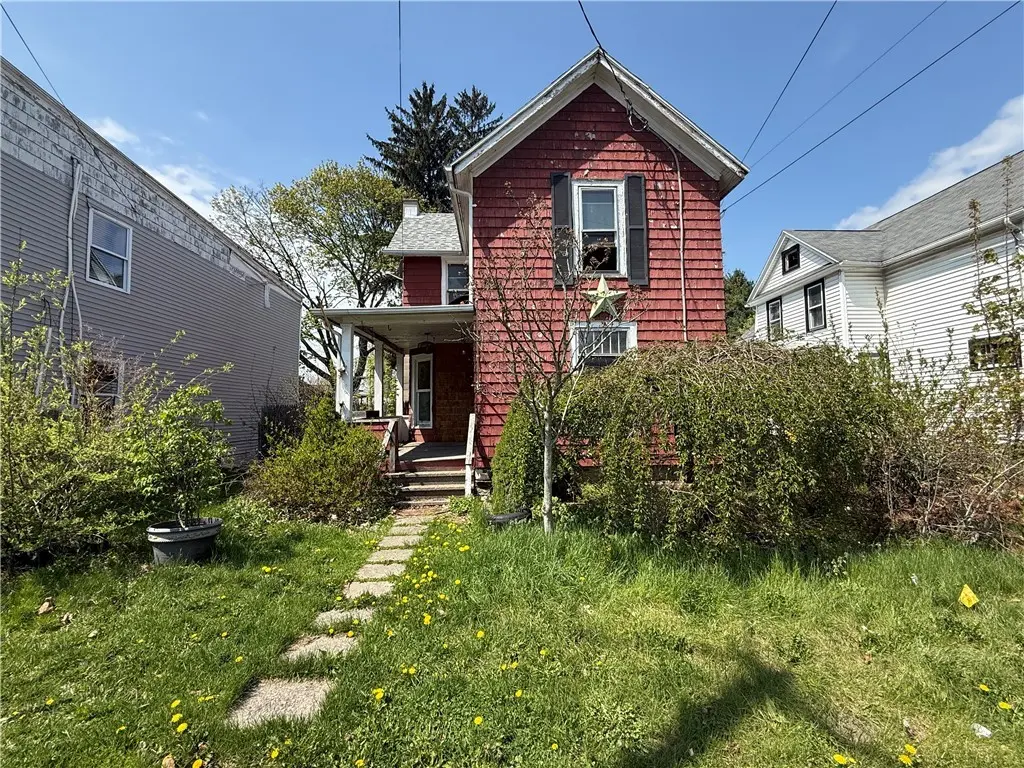
438 Broadway · Elmira, NY
Flood risk 1/10 · Minimal
- FEMA flood zone
- X
- Chance of flooding over 30 yrs
- 0.0%
- Est. flood insurance / yr
- $473 – $860
Fire risk 1/10 · Minimal
- Est. fire insurance / yr
- $691 – $1,283
Heat risk 3/10 · Minor
- Hot days now (above 97°F)
- 7 days/yr
- Hot days in 30 yrs
- 16 days/yr
Wind risk 2/10 · Minimal
- Chance of severe wind over 30 yrs
- 1.0%
Air-quality risk 1/10 · Minimal
- Unhealthy air days now
- 0 days/yr
- Unhealthy air days in 30 yrs
- 0 days/yr
Risk factors via First Street. Map © Google.
Why this score? — see what drove the B+ grade
The composite is a weighted blend of 9 inputs, each scored 0–100. Each bar is that input's sub-score; the figure is the points it added to the 100-point composite (weight × sub-score).
- Cash flow +30.0/30.0
- ARV discount +15.0/15.0
- 1% rule +10.0/10.0
- DSCR +10.0/10.0
- Livability +3.1/5.0
- Rent growth +2.5/5.0
- Condition / age +2.5/5.0
- Schools +2.4/10.0
- Appreciation +0.0/10.0
$80,000
🖨 Deal sheet 📄 Offer letter ✓ Due diligence
Listing remarks
Bring your vision to life here at 438 Broadway. Great opportunity for investment or rehab. This property is waiting for the right buyer to restore it to its former charm. Great bones and with a little TLC this could be a perfect home. Located near local amenities, shopping, and major routes. Calling all investors and renovators.
Key facts
- Major routes
- Local amenities
- 6,750 sq ft lot
Tags
Property features AI
Exterior
- Parking: No garage; No driveway
- Utilities: Sewer connected; Public water available; Water availability noted; Electric water heater
- Home design: 2-story property; Existing/resale condition
- Construction: Wood siding; Stone foundation
- Exterior features: Rectangular lot; Main thoroughfare road frontage; Lot dimensions approximately 45 x 150
Interior
- Kitchen: Refrigerator
- Flooring: Hardwood flooring; Varied flooring types
- Bathrooms: 1 full bathroom; Main level bathroom present
- Heating & cooling: Gas forced-air heating
- Interior features: Separate/formal dining room; Additional interior features noted in remarks
Neighborhood map
What this means for you Summary
Snapshot
- This is a 3-bed/1.0-bath single-family listed at $80k.
Deal economics
- At list price, monthly cash flow is $507 ($6k/yr) — positive.
- The deal already cash-flows at list — no discount required.
- Meets the 1% rule at list price ($1k rent vs $80k).
- Recommended offer: $78k (3.0% below list) — sets the bar for market timing.
- Cap rate 13.9% vs local median 10.1% in Elmira — top-decile yield for the area; either an underpriced asset or a hidden risk that comps aren't pricing in. Stress-test before assuming the spread holds.
Location & tenants
- Location reads 62/100 on livability (#832 in NY) — a middle-class / working-renter tenant base. Strengths: cost of living A+, housing A+, health & safety A+; Watch: schools F, crime F, amenities F.
- Elmira City School District (urban): math 23% / reading 35% proficiency, ranked #580 of 590 in NY (top 98%) — low school quality limits family demand, transient renter base, plan for 1-2y turnover.
- Market conditions: 101 active listings in the ZIP; 11 comparable units currently listed for rent nearby; rentals lingering (median 44d on market — plan ~5-8 weeks vacancy on turnover, expect pricing pressure); 100% of comp listings sitting > 30 days — soft ceiling on asking rent; 91 units permitted in Chemung County in 2024 (63 in 5+ unit buildings).
Forward outlook
- Local home prices are declining (-3.0%/yr); year-one equity from $553 of loan paydown is wiped out by about $2k of value loss. Plan a longer hold.
- Chemung County population projected at -17% by 2050 — secular population decline; favor cash flow + early exit over multi-decade hold.
- At projected returns (-3.0% appreciation + 3.0% rent growth), your $22k cash investment doubles in ~5 years — after that, you're playing with house money.
Negotiation context
- It's been on market 55 days — a 3% lower offer ($78k) is reasonable based on typical stale-listing flexibility.
- Current owner paid $28k; list at $80k implies a 185% gain — meaningful room to come down on a strong offer.
Risks & watch-outs
- Watch-outs: property tax is 3.1% of price; built in 1920 — expect roof / HVAC / electrical / plumbing capex.
Questions for the listing agent
- It's been on market 55 days. Have you received any prior offers? Is the seller open to a 3% concession, seller financing, or rate buy-down credit?
- Built in 1920 — when were the roof, HVAC, electrical panel, plumbing, and water heater last replaced?
- Property tax is high relative to price — has the assessment been appealed recently, and will the sale trigger a re-assessment?
- Is there a deadline driving the sale (1031 exchange, divorce, estate, relocation)? That informs how much negotiation room exists.
- Schools are F-rated, which usually means shorter tenancies and higher turnover. Who's the typical renter profile here, and what's been the actual vacancy rate?
- Crime grade is F in this area — have there been break-ins, vandalism, or insurance claims at this property in the last 3 years? What carrier currently insures it and at what premium?
- What's the average days-on-market for RENTAL listings here right now (not sales)? A rising rental-DOM trend means longer vacancies and softer asking-rent achievability than the comps imply.
- What's the recent tenant-quality profile in this submarket — average credit score on applications, eviction rate, late-payment / NSF rate, and stable-employment percentage? A property-management company in the area should have these aggregated.
- How much new for-sale + rental construction is in the pipeline within 1–3 miles? Heavy new supply typically softens prices + rents 12–24 months out; constrained supply supports both.
Investment metrics
- 1% rule
- 1.85% ✓
- Cap rate
- 13.90%
- Cash-on-cash
- 27.18%
- DSCR
- 2.21
- GRM
- 4.5
CMA / ARV
- ARV (median comp)
- $130,509
- List price
- $80,000
- Delta
- -38.70%
- Verdict
- UNDERPRICED
- Comps
- 20 within 1.0 mi
Show comp detail 12 sales within ~0.75 mi
| Address | Dist | Beds/Ba | Sqft | Sold | Price | $/sf | Match |
|---|---|---|---|---|---|---|---|
| 478 Mount Zoar St | 0.21mi | 4/1.0 (+1) | 1,456 (-3%) | 2mo | $35,000 | $24 | 79 |
| 551 Lyon St | 0.27mi | 3/1.0 | 1,586 (+6%) | 3mo | $158,000 | $100 | 75 |
| 309 Broadway St | 0.43mi | 4/1.0 (+1) | 1,468 (-2%) | 3mo | $78,000 | $53 | 70 |
| 507 Partridge St | 0.35mi | 3/1.5 | 1,592 (+6%) | 3mo | $106,500 | $67 | 69 |
| 562 Baty St | 0.19mi | 3/1.0 | 1,296 (-13%) | 5mo | $111,702 | $86 | 65 |
| 421 Jefferson St | 0.19mi | 3/1.5 | 1,688 (+13%) | 5mo | $85,106 | $50 | 64 |
| 558 Coburn St | 0.12mi | 4/1.5 (+1) | 1,716 (+15%) | 0mo | $125,020 | $73 | 63 |
| 626 Decker Ave | 0.36mi | 3/2.0 | 1,335 (-11%) | 2mo | $142,000 | $106 | 59 |
| 570 Cypress St | 0.42mi | 3/1.0 | 1,307 (-13%) | 1mo | $127,200 | $97 | 59 |
| 421 Partridge St | 0.38mi | 3/1.5 | 1,274 (-15%) | 1mo | $47,000 | $37 | 55 |
| 809 Chamberlain St | 0.53mi | 4/1.0 (+1) | 1,328 (-11%) | 5mo | $138,192 | $104 | 48 |
| 777 Pennsylvania Ave | 0.59mi | 4/1.5 (+1) | 1,620 (+8%) | 6mo | $110,000 | $68 | 47 |
Match score weights: distance 35% · size 25% · config 20% · recency 20%. Top-matched comps best support the ARV.
Projected returns pro-forma
-3.0% appreciation · 3.0% rent growth · sell at horizon
- IRR
- 21.2%
- Equity multiple
- 1.87×
- Total profit
- $19,440
- Equity at exit
- $11,928
- IRR
- 29.4%
- Equity multiple
- 3.63×
- Total profit
- $58,900
- Equity at exit
- $6,917
Cash invested: $22,400 (down + closing). Projections, not guarantees.
Landlord ↔ Tenant lean methodology
- Overall (STATE)
- 15 Strongly Tenant-Friendly
- State New York
- 15 Strongly Tenant-Friendly · D+10
- County
- — inherits STATE
- City
- — inherits STATE
ZIP-level market 14904
- Home prices YoY
- -9.6%
- Active inventory
- 101
- Price-to-rent
- 4.5×
Monthly cashflow live
- Estimated rent
- $1,480 high interval (Pro) →
- Mortgage (P&I)
- −$420
- Tax from tax record
- −$209 /mo · $2,505/yr
- Insurance
- −$33
- HOA
- −$0
- Vacancy / Maint / Mgmt
- −$311
- Net cashflow
- $507
Break-even live
UW: 25.0% down · 7.5% · 30yr · 1.5% tax · 5.0% vac · 8.0% maint · 8.0% mgmt
Financing live
Cash to close
- Down payment
- $20,000
- Closing costs
- $2,400
- Reserves months
- —
- Total cash needed
- —
Loan-product check · same deal, 3 products live
Conventional
25% down · 7.5% · 30yr
- Down + closing
- —
- Monthly P&I
- —
- Monthly cashflow
- —
- DSCR
- —
- Eligible?
- —
Personal DTI + credit; lowest rate.
DSCR
20% down · 8.5% · 30yr
- Down + closing
- —
- Monthly P&I
- —
- Monthly cashflow
- —
- DSCR
- —
- Eligible?
- —
No personal income docs; deal must DSCR.
Hard money
10% down · 12.0% · 12mo
- Down + closing
- —
- Monthly P&I
- —
- Monthly cashflow
- —
- DSCR
- —
- Eligible?
- —
Short-term bridge; refi at stabilization.
Rent comps 11 comps
| Address | Beds | Baths | Sqft | Rent | $/sqft | DOM | Units | Dist |
|---|---|---|---|---|---|---|---|---|
| 419 Jefferson St Unit A Elmira, NY | 2.0 | 2.0 | 1100 | $1,995 | $1.81 | 44d | 1 | 0.20mi |
| 550 Spruce St Unit 303 Elmira, NY | 2.0 | 2.0 | 1350 | $1,350 | $1.00 | 44d | 1 | 0.46mi |
| 160 Boardman St Unit B Elmira, NY | 2.0 | 1.0 | 1727 | $800 | $0.46 | 44d | 1 | 0.64mi |
| 363 W Water St #2 Elmira, NY | 3.0 | 1.0 | 1084 | $1,250 | $1.15 | 44d | 1 | 0.80mi |
| 514 W 1st St Unit A Elmira, NY | 4.0 | 1.0 | 1416 | $1,275 | $0.90 | 44d | 1 | 0.94mi |
| 454 W 2nd St Unit 1 Elmira, NY | 2.0 | 1.0 | 1400 | $1,000 | $0.71 | 44d | 1 | 1.01mi |
| 106 W 2nd St Unit A Elmira, NY | 3.0 | 1.0 | 1395 | $1,400 | $1.00 | 44d | 1 | 1.20mi |
| 357 W Clinton St Unit 1 Elmira, NY | 2.0 | 1.5 | 1650 | $1,500 | $0.91 | 44d | 1 | 1.21mi |
| 355 W Clinton St Unit 1 Elmira, NY | 3.0 | 1.5 | 1650 | $1,400 | $0.85 | 44d | 1 | 1.21mi |
| 1210 W Water St Elmira, NY | 2.0 | 2.0 | 1340 | $1,995 | $1.49 | 44d | 1 | 1.42mi |
| 1254 Charles St Elmira, NY | 2.0 | 1.0 | 1560 | $1,350 | $0.87 | 44d | 1 | 1.45mi |
Listing history 20 events
-
2026-06-19days on market $80,000 Active 55 DOM
-
2026-06-18days on market $80,000 Active 54 DOM
-
2026-06-17days on market $80,000 Active 53 DOM
-
2026-06-16days on market $80,000 Active 52 DOM
-
2026-06-15days on market $80,000 Active 51 DOM
-
2026-06-14days on market $80,000 Active 49 DOM
-
2026-06-12days on market $80,000 Active 48 DOM
-
2026-06-09days on market $80,000 Active 45 DOM
-
2026-06-08days on market $80,000 Active 44 DOM
-
2026-06-07days on market $80,000 Active 43 DOM
-
2026-06-05days on market $80,000 Active 40 DOM
-
2026-06-03days on market $80,000 Active 39 DOM
-
2026-06-02days on market $80,000 Active 38 DOM
-
2026-06-01days on market $80,000 Active 37 DOM
-
2026-05-31days on market $80,000 Active 36 DOM
-
2026-05-30days on market $80,000 Active 35 DOM
-
2026-04-24$80,000 Active 330-char remark
-
2016-06-08soldstatus $28,100
-
2001-07-03soldstatus $27,000
-
1991-04-12soldstatus $24,000
ⓘ Source: listings_history table (triggers on properties + properties_extension) + one-shot
backfill from property_details.listing_events for pre-trigger history.
Tax reassessment forecast NY · Partial reset (capped growth)
- Current annual tax
- $2,505 · $209/mo
- Projected year-2 tax
- $2,505 · $209/mo
- Expected delta
- $0/yr ($0/mo · -0.0%)
ⓘ Screening estimate from a state-policy table — verify with the county assessor before closing.
Climate risk First Street
- Flood 1/10 Low FEMA zone X · 0% chance over 30 yrs
- Wildfire 1/10 Low
- Heat 3/10 Moderate 7 d/yr ≥97°F today · 16 d/yr by 30 yrs out
- Wind 2/10 Low 100% chance of damaging wind over 30 yrs
- Air quality 1/10 Low 0 unhealthy d/yr today · 0 by 30 yrs out
Nearby sold comps map
Loading sold comps map…
Walkable amenities ~0.75 mi
Loading nearby amenities…
Taxation est. · year 1
- Rental income
- $17,757
- − Mortgage interest
- −$4,481
- − Property taxes
- −$2,505
- − Insurance
- −$400
- − Repairs & maintenance
- −$1,421
- − Management
- −$1,421
- − Depreciation
- −$2,327
- Taxable income
- $5,202
- Est. tax owed @ 24.0%
- −$1,248
- After-tax cash flow
- $4,840/yr
For passive investors: Depreciation is non-cash, so a rental often shows a tax loss while cash-flowing — sheltering income. Rental losses are passive: they offset passive income freely, and up to $25,000/yr can offset ordinary (W-2) income if you actively participate and your MAGI is under $100k (phasing out to $0 by $150k); unused losses carry forward. On sale, claimed depreciation is recaptured at up to 25%, and gains may owe capital-gains tax (a 1031 exchange can defer both). Figures are a year-1 estimate at your 24.0% rate — not tax advice; consult a CPA.
Schools (NCES district)
- District
- Elmira City School District
- NCES district ID
- 3610560
- Math proficiency
- 23% ▼ -7.00%
- Reading proficiency
- 35% ▲ 7.00%
- Median HH income
- $40,180
- Composite
- 24.39/100
- National rank
- #7688
- State rank
- #580 of 590 in NY
Livability — Elmira
- Score
- 62/100
- State rank
- #832
- US rank
- #16139
Category grades
Schools grade is shown separately in the Schools card above.
Census & demographics
- Census place
- Elmira, NY
- City population
- 14,276
- Population (ZIP)
- 14,276
Population outlook (Chemung County) Hauer SSP2
- Today (2025)
- 82,931 people
- By 2030
- 80,356 · -3.1%
- By 2040
- 74,745 · -9.9%
- By 2050
- 69,012 · -16.8%
- By 2075
- 55,689 · -32.8%
- By 2100
- 41,428 · -50.0%
Race, ethnicity, and origin ACS 2023
- Neighborhood character
- Predominantly White (83%)
- Race & ethnicity
- White 83% Two or more races 7% Black 7% Hispanic / Latino 5% Native American 1%
- Common ancestry
- Romanian 7% Lithuanian 3% Slovak 2%
- Foreign-born
- 2% · Canada, Jamaica, Dominican Republic
- Languages at home
- 97% English-only · Spanish 2%
Political lean MEDSL · Chemung
- 2024 margin
- R (+16.8) · D 41.6% · R 58.4%
- 2008→2024 swing
- -15.6pp toward R · 2008: -1.2pp · 2024: -16.8pp
- All cycles
- 2024: R+16.8 2020: R+13.4 2016: R+20.0 2012: R+2.9 2008: R+1.2
Not yet ingested
- Civics
- —
Market trends
- HPI YoY
- ▼ -23.33%
- Current HPI
- 220.688
- Rent YoY
- —
- Metro
- —
- State GDP YoY
- ▲ 2.60%
- F500 in state
- 92
Industry mix (Fortune 500 HQ in NY)
| Industry | F500 HQs | Revenue |
|---|---|---|
| Financial Services | 10 | $950B |
|
||
| Consumer Goods | 9 | $162B |
|
||
| Insurance | 4 | $225B |
|
||
| Telecommunications | 2 | $144B |
|
||
| Pharmaceuticals | 2 | $112B |
|
||
| Media / Entertainment | 2 | $69B |
|
||
Price history
+233.3% since first listed4 events — show timeline
- 2026-04-24 Listed $80,000 UNYREIS
- 2016-06-08 Sold (Public Records) $28,100 Public Records
- 2001-07-03 Sold (Public Records) $27,000 Public Records
- 1991-04-12 Sold (Public Records) $24,000 Public Records
Property tax history
+9.7%/yrLatest (2025): $2,505 · -8.2% YoY. Source: county tax records.
Cash-flow waterfall
monthlySold comps — $/sqft
last 12 mo · ≤1 miLoading sold comps…