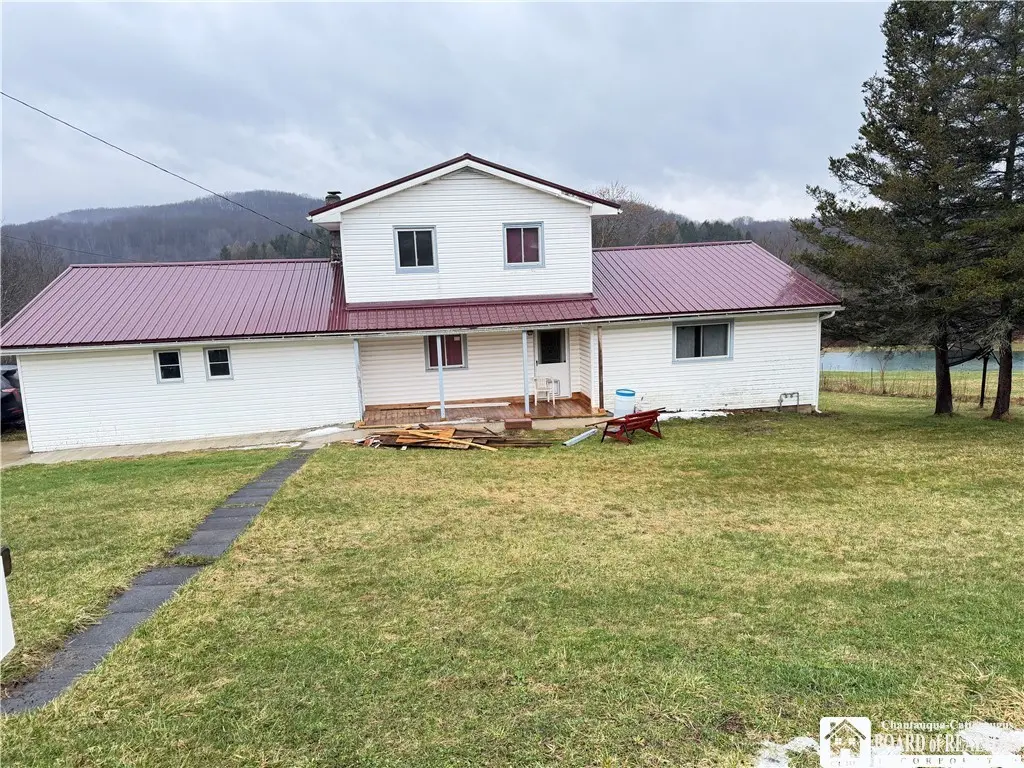
2415 Maple Ave · Franklinville, NY
Flood risk 1/10 · Minimal
- FEMA flood zone
- X
- Chance of flooding over 30 yrs
- 0.0%
- Est. flood insurance / yr
- $473 – $860
Fire risk 2/10 · Minimal
- Est. fire insurance / yr
- $691 – $1,283
Heat risk 1/10 · Minimal
- Hot days now (above 88°F)
- 7 days/yr
- Hot days in 30 yrs
- 16 days/yr
Wind risk 1/10 · Minimal
- Chance of severe wind over 30 yrs
- —
Air-quality risk 1/10 · Minimal
- Unhealthy air days now
- 0 days/yr
- Unhealthy air days in 30 yrs
- 0 days/yr
Risk factors via First Street. Map © Google.
Why this score? — see what drove the C+ grade
The composite is a weighted blend of 9 inputs, each scored 0–100. Each bar is that input's sub-score; the figure is the points it added to the 100-point composite (weight × sub-score).
- Cash flow +16.2/30.0
- ARV discount +15.0/15.0
- Appreciation +8.0/10.0
- DSCR +5.0/10.0
- Schools +4.9/10.0
- 1% rule +4.4/10.0
- Livability +3.1/5.0
- Condition / age +2.8/5.0
- Rent growth +2.5/5.0
$124,500
🖨 Deal sheet 📄 Offer letter ✓ Due diligence
Listing remarks
Escape to the peace and charm of country living with this updated two-story old-style home offering space, functionality, and timeless appeal. Featuring 3 bedrooms and 2 full baths, this property blends classic character with modern improvements including a new metal roof, laminate flooring, storm windows, and low-maintenance vinyl siding. Step inside to a spacious living room perfect for gathering with guests, while the inviting family room offers additional space to relax or entertain. The eat-in kitchen is thoughtfully designed for everyday convenience and hosting alike, featuring abundant cabinetry, generous counter space, a center prep island, and an open dining area that keeps everyon
Key facts
- New metal roof
- Laminate flooring
- Inviting family room
Tags
Property features AI
Exterior
- Parking: Attached 2-car garage
- Utilities: Electricity connected (circuit breakers); Public water connected; Septic tank
- Home design: Single-story; Resale property; Metal roof; Vinyl siding
- Construction: Built with vinyl siding; Block foundation
- Exterior features: Deck; Covered porch; Gravel driveway; Irregular, rural lot (approx. 0.6847 acres, dimensions 120 x 248)
Interior
- Kitchen: Dishwasher; Refrigerator
- Flooring: Carpet; Laminate; Tile; Varied flooring
- Bathrooms: Two full bathrooms; One main-level bathroom
- Heating & cooling: Gas forced-air heating
- Interior features: Eat-in kitchen; Separate/formal living room; Kitchen island
- Laundry & utility: Main-level laundry; Gas water heater
Neighborhood map
What this means for you Summary
Snapshot
- This is a 3-bed/2.0-bath single-family listed at $124k. Condition is rated average.
Deal economics
- At list price, monthly cash flow is $66 ($795/yr) — positive.
- The deal already cash-flows at list — no discount required.
- To meet the 1% rule (rent ≥ 1% of price), the offer needs to be $117k (5.8% below list).
- Recommended offer: $117k (5.8% below list) — sets the bar for 1% rule.
Location & tenants
- Location reads 62/100 on livability (#856 in NY) — a middle-class / working-renter tenant base. Strengths: cost of living A+, housing A+, crime A-; Watch: employment C-, schools D+, amenities F.
- Franklinville Central School District (rural): math 60% / reading 57% proficiency, ranked #281 of 590 in NY (top 48%) — acceptable for families but not a draw, mixed tenant base, ~2y average lease.
- Market conditions: 31 active listings in the ZIP; 128 units permitted in Cattaraugus County in 2024 (21 in 5+ unit buildings).
Forward outlook
- In year one you build about $8k of equity ($861 loan paydown + $7k appreciation (5.9% local appreciation)).
- Cattaraugus County population projected at -28% by 2050 — secular population decline; favor cash flow + early exit over multi-decade hold.
- At projected returns (5.9% appreciation + 3.0% rent growth), your $35k cash investment doubles in ~4 years — after that, you're playing with house money.
- By year 5, paydown + projected appreciation supports a ~$36k cash-out refi (75% LTV) — recoverable capital for the next deal without selling this one.
Negotiation context
- It's been on market 48 days — a 3% lower offer ($121k) is reasonable based on typical stale-listing flexibility.
- 7 sale attempts since 10y ago with the ask held roughly flat each time — persistent listings suggest the price (not the market) is what's stuck; bring a comps-based counter.
Questions for the listing agent
- It's been on market 48 days. Have you received any prior offers? Is the seller open to a 6% concession, seller financing, or rate buy-down credit?
- Built in 1970 — when were the roof, HVAC, electrical panel, plumbing, and water heater last replaced?
- Is there a deadline driving the sale (1031 exchange, divorce, estate, relocation)? That informs how much negotiation room exists.
- Schools are D-rated, which usually means shorter tenancies and higher turnover. Who's the typical renter profile here, and what's been the actual vacancy rate?
- What's the average days-on-market for RENTAL listings here right now (not sales)? A rising rental-DOM trend means longer vacancies and softer asking-rent achievability than the comps imply.
- What's the recent tenant-quality profile in this submarket — average credit score on applications, eviction rate, late-payment / NSF rate, and stable-employment percentage? A property-management company in the area should have these aggregated.
- How much new for-sale + rental construction is in the pipeline within 1–3 miles? Heavy new supply typically softens prices + rents 12–24 months out; constrained supply supports both.
Investment metrics
- 1% rule
- 0.94% ✗
- Cap rate
- 6.93%
- Cash-on-cash
- 2.28%
- DSCR
- 1.10
- GRM
- 8.8
CMA / ARV
- ARV (median comp)
- $177,155
- List price
- $124,500
- Delta
- -29.72%
- Verdict
- UNDERPRICED
- Comps
- 15 within 1.0 mi
Show comp detail 2 sales within ~0.75 mi
| Address | Dist | Beds/Ba | Sqft | Sold | Price | $/sf | Match |
|---|---|---|---|---|---|---|---|
| 4 Washburn Ave | 0.66mi | 3/1.0 | 1,360 (-4%) | 10mo | $85,088 | $63 | 50 |
| 1103 Mount Pleasant Ave | 0.53mi | 2/1.0 (-1) | 1,584 (+12%) | 16mo | $187,000 | $118 | 34 |
Match score weights: distance 35% · size 25% · config 20% · recency 20%. Top-matched comps best support the ARV.
Projected returns pro-forma
5.93% appreciation · 3.0% rent growth · sell at horizon
- IRR
- 17.1%
- Equity multiple
- 2.14×
- Total profit
- $39,653
- Equity at exit
- $77,701
- IRR
- 16.9%
- Equity multiple
- 4.26×
- Total profit
- $113,508
- Equity at exit
- $140,423
Cash invested: $34,860 (down + closing). Projections, not guarantees.
Landlord ↔ Tenant lean methodology
- Overall (STATE)
- 15 Strongly Tenant-Friendly
- State New York
- 15 Strongly Tenant-Friendly · D+10
- County
- — inherits STATE
- City
- — inherits STATE
ZIP-level market 14737
- Home prices YoY
- 2.0%
- Active inventory
- 31
- Price-to-rent
- 8.8×
Monthly cashflow live
- Estimated rent
- $1,173 medium interval (Pro) →
- Mortgage (P&I)
- −$653
- Tax est. 1.5%
- −$156 /mo · $1,868/yr
- Insurance
- −$52
- HOA
- −$0
- Vacancy / Maint / Mgmt
- −$246
- Net cashflow
- $66
Break-even live
UW: 25.0% down · 7.5% · 30yr · 1.5% tax · 5.0% vac · 8.0% maint · 8.0% mgmt
Financing live
Cash to close
- Down payment
- $31,125
- Closing costs
- $3,735
- Reserves months
- —
- Total cash needed
- —
Loan-product check · same deal, 3 products live
Conventional
25% down · 7.5% · 30yr
- Down + closing
- —
- Monthly P&I
- —
- Monthly cashflow
- —
- DSCR
- —
- Eligible?
- —
Personal DTI + credit; lowest rate.
DSCR
20% down · 8.5% · 30yr
- Down + closing
- —
- Monthly P&I
- —
- Monthly cashflow
- —
- DSCR
- —
- Eligible?
- —
No personal income docs; deal must DSCR.
Hard money
10% down · 12.0% · 12mo
- Down + closing
- —
- Monthly P&I
- —
- Monthly cashflow
- —
- DSCR
- —
- Eligible?
- —
Short-term bridge; refi at stabilization.
Listing history 33 events
-
2026-06-18days on market $124,500 Active 48 DOM
-
2026-06-17days on market $124,500 Active 47 DOM
-
2026-06-16days on market $124,500 Active 46 DOM
-
2026-06-15days on market $124,500 Active 45 DOM
-
2026-06-13days on market $124,500 Active 43 DOM
-
2026-06-12days on market $124,500 Active 42 DOM
-
2026-06-09days on market $124,500 Active 39 DOM
-
2026-06-08days on market $124,500 Active 38 DOM
-
2026-06-07days on market $124,500 Active 37 DOM
-
2026-06-07days on market $124,500 Active 36 DOM
-
2026-06-04days on market $124,500 Active 33 DOM
-
2026-06-02days on market $124,500 Active 32 DOM
-
2026-06-01days on market $124,500 Active 31 DOM
-
2026-05-31days on market $124,500 Active 30 DOM
-
2026-05-01$124,500 Active 1341-char remark
-
2025-11-30historical
-
2025-11-10$125,000 Active
-
2025-10-31historical
-
2025-09-25price $135,000
-
2025-08-08price $141,000
-
2025-07-08price $148,000
-
2025-06-20$157,000 Active
-
2025-03-08historical
-
2024-09-08$144,500 Active
-
2017-03-18historical
-
2016-10-10$44,900 Active
-
2016-10-02historical
-
2016-07-03$44,900 Active
-
2016-07-03historical
-
2016-06-25price $46,500
-
2016-05-20price $49,900
-
2016-04-25price $54,900
-
2016-04-02$59,900 Active
ⓘ Source: listings_history table (triggers on properties + properties_extension) + one-shot
backfill from property_details.listing_events for pre-trigger history.
Climate risk First Street
- Flood 1/10 Low FEMA zone X · 0% chance over 30 yrs
- Wildfire 2/10 Low
- Heat 1/10 Low 7 d/yr ≥88°F today · 16 d/yr by 30 yrs out
- Wind 1/10 Low
- Air quality 1/10 Low 0 unhealthy d/yr today · 0 by 30 yrs out
Nearby sold comps map
Loading sold comps map…
Walkable amenities ~0.75 mi
Loading nearby amenities…
Taxation est. · year 1
- Rental income
- $14,076
- − Mortgage interest
- −$6,974
- − Property taxes
- −$1,868
- − Insurance
- −$622
- − Repairs & maintenance
- −$1,126
- − Management
- −$1,126
- − Depreciation
- −$3,622
- Taxable loss
- −$1,262
- Est. tax savings @ 24.0%
- +$303
- After-tax cash flow
- $1,098/yr
For passive investors: Depreciation is non-cash, so a rental often shows a tax loss while cash-flowing — sheltering income. Rental losses are passive: they offset passive income freely, and up to $25,000/yr can offset ordinary (W-2) income if you actively participate and your MAGI is under $100k (phasing out to $0 by $150k); unused losses carry forward. On sale, claimed depreciation is recaptured at up to 25%, and gains may owe capital-gains tax (a 1031 exchange can defer both). Figures are a year-1 estimate at your 24.0% rate — not tax advice; consult a CPA.
Condition & rehab AI · 1 photo
This updated two-story home offers a good balance of classic charm and modern improvements, but some minor repairs and landscaping improvements could further enhance its value.
Repairs flagged
- Minor Landscaping — The landscaping could be improved for better curb appeal.
- Minor Exterior paint — The exterior siding shows some signs of wear that could be addressed with a fresh coat of paint.
Value-add opportunities
- Both Landscaping — Enhanced landscaping can improve both the resale and rental value.
- Both Exterior paint — A fresh coat of paint can improve the home's curb appeal and overall condition, enhancing both resale and rental value.
Renovation cost estimate screening
| Repair item | Severity | Est. cost |
|---|---|---|
| Landscaping · The landscaping could be improved for better curb appeal. | Minor | $500–3,000 |
| Exterior paint · The exterior siding shows some signs of wear that could be addressed with a fresh coat of paint. | Minor | $500–3,000 |
| Total estimated repair cost · 2 items | $1,000–6,000 |
Value-add ROI direction
- Both Landscaping — Enhanced landscaping can improve both the resale and rental value. ↑
- Both Exterior paint — A fresh coat of paint can improve the home's curb appeal and overall condition, enhancing both resale and rental value. ↑
ⓘ Cost ranges are severity-bucket heuristics (US national rule-of-thumb). Get contractor quotes + a written scope before underwriting a rehab budget.
Schools (NCES district)
- District
- Franklinville Central School District
- NCES district ID
- 3611490
- Math proficiency
- 60% ▲ 11.00%
- Reading proficiency
- 57% ▲ 16.00%
- Median HH income
- $41,110
- Composite
- 49.0/100
- National rank
- #2068
- State rank
- #281 of 590 in NY
Livability — Franklinville
- Score
- 62/100
- State rank
- #856
- US rank
- #16514
Category grades
Schools grade is shown separately in the Schools card above.
Census & demographics
- Population (ZIP)
- 4,071
Population outlook (Cattaraugus County) Hauer SSP2
- Today (2025)
- 71,623 people
- By 2030
- 67,751 · -5.4%
- By 2040
- 59,488 · -16.9%
- By 2050
- 51,601 · -28.0%
- By 2075
- 35,025 · -51.1%
- By 2100
- 21,243 · -70.3%
Race, ethnicity, and origin ACS 2023
- Neighborhood character
- Predominantly White (85%)
- Race & ethnicity
- White 85% Two or more races 9% Hispanic / Latino 5% Native American 1%
- Common ancestry
- Romanian 10% Iranian 2% Lithuanian 2%
- Foreign-born
- 2% · Canada
- Languages at home
- 97% English-only · German/W. Germanic 1%
Political lean MEDSL · Cattaraugus
- 2024 margin
- Solid R (+32.8) · D 33.6% · R 66.4%
- 2008→2024 swing
- -22.2pp toward R · 2008: -10.6pp · 2024: -32.8pp
- All cycles
- 2024: R+32.8 2020: R+29.5 2016: R+34.4 2012: R+13.4 2008: R+10.6
Not yet ingested
- Civics
- —
Market trends
- HPI YoY
- ▲ 5.93%
- Current HPI
- 305.4492
- Rent YoY
- —
- Metro
- —
- State GDP YoY
- ▲ 2.60%
- F500 in state
- 92
Industry mix (Fortune 500 HQ in NY)
| Industry | F500 HQs | Revenue |
|---|---|---|
| Financial Services | 10 | $950B |
|
||
| Consumer Goods | 9 | $162B |
|
||
| Insurance | 4 | $225B |
|
||
| Telecommunications | 2 | $144B |
|
||
| Pharmaceuticals | 2 | $112B |
|
||
| Media / Entertainment | 2 | $69B |
|
||
Price history
+107.8% since first listed19 events — show timeline
- 2026-05-01 Listed $124,500 UNYREIS
- 2025-11-30 Listing Removed — WNYREIS
- 2025-11-10 Listed $125,000 WNYREIS
- 2025-10-31 Listing Removed — WNYREIS
- 2025-09-25 Price Changed $135,000 WNYREIS
- 2025-08-08 Price Changed $141,000 WNYREIS
- 2025-07-08 Price Changed $148,000 WNYREIS
- 2025-06-20 Listed $157,000 WNYREIS
- 2025-03-08 Listing Removed — WNYREIS
- 2024-09-08 Listed $144,500 WNYREIS
- 2017-03-18 Listing Removed — WNYREIS
- 2016-10-10 Listed $44,900 WNYREIS
- 2016-10-02 Listing Removed — WNYREIS
- 2016-07-03 Listed $44,900 WNYREIS
- 2016-07-03 Listing Removed — WNYREIS
- 2016-06-25 Price Changed $46,500 WNYREIS
- 2016-05-20 Price Changed $49,900 WNYREIS
- 2016-04-25 Price Changed $54,900 WNYREIS
- 2016-04-02 Listed $59,900 WNYREIS
Cash-flow waterfall
monthlySold comps — $/sqft
last 12 mo · ≤1 miLoading sold comps…