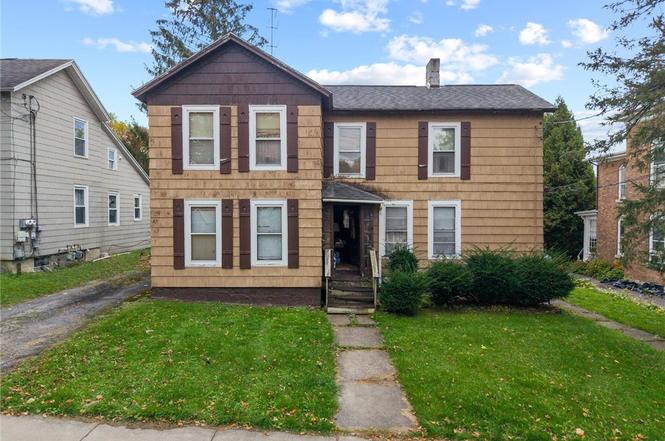
14 Capitol St · Auburn, NY
Flood risk 1/10 · Minimal
- FEMA flood zone
- X (unshaded)
- Chance of flooding over 30 yrs
- 0.0%
- Est. flood insurance / yr
- $473 – $860
Fire risk 1/10 · Minimal
- Est. fire insurance / yr
- $691 – $1,283
Heat risk 2/10 · Minimal
- Hot days now (above 95°F)
- 7 days/yr
- Hot days in 30 yrs
- 15 days/yr
Wind risk 1/10 · Minimal
- Chance of severe wind over 30 yrs
- 1.0%
Air-quality risk 2/10 · Minimal
- Unhealthy air days now
- 0 days/yr
- Unhealthy air days in 30 yrs
- 1 days/yr
Risk factors via First Street. Map © Google.
Why this score? — see what drove the B- grade
The composite is a weighted blend of 9 inputs, each scored 0–100. Each bar is that input's sub-score; the figure is the points it added to the 100-point composite (weight × sub-score).
- Cash flow +30.0/30.0
- 1% rule +10.0/10.0
- DSCR +10.0/10.0
- ARV discount +7.5/15.0
- Livability +3.7/5.0
- Schools +3.0/10.0
- Rent growth +2.5/5.0
- Condition / age +2.5/5.0
- Appreciation +0.0/10.0
$57,900
🖨 Deal sheet 📄 Offer letter ✓ Due diligence
Listing remarks
14 Capitol Street offers great potential for renovation and long-term equity growth. The property will require updates to electrical and plumbing systems along with interior restoration throughout. Featuring a spacious layout and solid structure, this duplex is ideal for investors, contractors, or experienced buyers looking to add value. Conveniently located near downtown Auburn, schools, and major employers.
Key facts
- Near schools
- Near major employers
- Interior restoration
Tags
Neighborhood map
What this means for you Summary
Snapshot
- This is a 3-bed/2.0-bath townhouse listed at $58k.
Deal economics
- At list price, monthly cash flow is $862 ($10k/yr) — positive.
- The deal already cash-flows at list — no discount required.
- Meets the 1% rule at list price ($2k rent vs $58k).
- Recommended offer: $57k (1.5% below list) — sets the bar for market timing.
- Cap rate 24.2% vs local median 7.6% in Auburn — top-decile yield for the area; either an underpriced asset or a hidden risk that comps aren't pricing in. Stress-test before assuming the spread holds.
Location & tenants
- Location reads 74/100 on livability (#298 in NY, #4,814 nationally) — a middle-class / working-renter tenant base. Strengths: cost of living A+, housing A+, health & safety A+; Watch: schools D, amenities D-, commute F.
- Auburn City School District (town): math 31% / reading 39% proficiency, ranked #558 of 590 in NY (top 95%) — families likely to look elsewhere, expect single-tenant / working-renter base with shorter leases.
- Market conditions: 221 active listings in the ZIP; 3 comparable units currently listed for rent nearby; rentals lingering (median 44d on market — plan ~5-8 weeks vacancy on turnover, expect pricing pressure); 100% of comp listings sitting > 30 days — soft ceiling on asking rent; 161 units permitted in Cayuga County in 2024 (65 in 5+ unit buildings).
- This rent runs 34% of the median local income ($61k/yr) — at the standard rent-burdened threshold; future hikes will face affordability resistance.
Forward outlook
- Local home prices are declining (-3.0%/yr); year-one equity from $400 of loan paydown is wiped out by about $2k of value loss. Plan a longer hold.
- Cayuga County population projected at -18% by 2050 — secular population decline; favor cash flow + early exit over multi-decade hold.
- At projected returns (-3.0% appreciation + 3.0% rent growth), your $16k cash investment doubles in ~2 years — after that, you're playing with house money.
Negotiation context
- It's been on market 16 days — a 2% lower offer ($57k) is reasonable based on typical stale-listing flexibility.
- 2 sale attempts with the ask held roughly flat each time — persistent listings suggest the price (not the market) is what's stuck; bring a comps-based counter.
Risks & watch-outs
- Watch-outs: property tax is 3.5% of price; built in 1890 — expect roof / HVAC / electrical / plumbing capex.
Questions for the listing agent
- Built in 1890 — when were the roof, HVAC, electrical panel, plumbing, and water heater last replaced?
- Property tax is high relative to price — has the assessment been appealed recently, and will the sale trigger a re-assessment?
- Is there a deadline driving the sale (1031 exchange, divorce, estate, relocation)? That informs how much negotiation room exists.
- Schools are D-rated, which usually means shorter tenancies and higher turnover. Who's the typical renter profile here, and what's been the actual vacancy rate?
- What's the average days-on-market for RENTAL listings here right now (not sales)? A rising rental-DOM trend means longer vacancies and softer asking-rent achievability than the comps imply.
- What's the recent tenant-quality profile in this submarket — average credit score on applications, eviction rate, late-payment / NSF rate, and stable-employment percentage? A property-management company in the area should have these aggregated.
- How much new for-sale + rental construction is in the pipeline within 1–3 miles? Heavy new supply typically softens prices + rents 12–24 months out; constrained supply supports both.
Investment metrics
- 1% rule
- 2.97% ✓
- Cap rate
- 24.15%
- Cash-on-cash
- 63.79%
- DSCR
- 3.84
- GRM
- 2.8
CMA / ARV
- ARV (on-the-fly)
- $121,576
- Comps found
- 1
Show comp detail 1 sale within ~0.75 mi
| Address | Dist | Beds/Ba | Sqft | Sold | Price | $/sf | Match |
|---|---|---|---|---|---|---|---|
| 131-133 N Fulton St | 0.48mi | 4/2.0 (+1) | 2,409 (+3%) | 14mo | $125,000 | $52 | 55 |
Match score weights: distance 35% · size 25% · config 20% · recency 20%. Top-matched comps best support the ARV.
Projected returns pro-forma
-3.0% appreciation · 3.0% rent growth · sell at horizon
- IRR
- 62.9%
- Equity multiple
- 3.81×
- Total profit
- $45,591
- Equity at exit
- $8,633
- IRR
- 67.4%
- Equity multiple
- 7.83×
- Total profit
- $110,724
- Equity at exit
- $5,006
Cash invested: $16,212 (down + closing). Projections, not guarantees.
Landlord ↔ Tenant lean methodology
- Overall (STATE)
- 15 Strongly Tenant-Friendly
- State New York
- 15 Strongly Tenant-Friendly · D+10
- County
- — inherits STATE
- City
- — inherits STATE
ZIP-level market 13021
- Home prices YoY
- -22.4%
- Active inventory
- 221
- Price-to-rent
- 2.8×
Monthly cashflow live
- Estimated rent
- $1,720 medium interval (Pro) →
- Mortgage (P&I)
- −$304
- Tax from tax record
- −$169 /mo · $2,030/yr
- Insurance
- −$24
- HOA
- −$0
- Vacancy / Maint / Mgmt
- −$361
- Net cashflow
- $862
Break-even live
UW: 25.0% down · 7.5% · 30yr · 1.5% tax · 5.0% vac · 8.0% maint · 8.0% mgmt
Financing live
Cash to close
- Down payment
- $14,475
- Closing costs
- $1,737
- Reserves months
- —
- Total cash needed
- —
Loan-product check · same deal, 3 products live
Conventional
25% down · 7.5% · 30yr
- Down + closing
- —
- Monthly P&I
- —
- Monthly cashflow
- —
- DSCR
- —
- Eligible?
- —
Personal DTI + credit; lowest rate.
DSCR
20% down · 8.5% · 30yr
- Down + closing
- —
- Monthly P&I
- —
- Monthly cashflow
- —
- DSCR
- —
- Eligible?
- —
No personal income docs; deal must DSCR.
Hard money
10% down · 12.0% · 12mo
- Down + closing
- —
- Monthly P&I
- —
- Monthly cashflow
- —
- DSCR
- —
- Eligible?
- —
Short-term bridge; refi at stabilization.
Rent comps 3 comps
| Address | Beds | Baths | Sqft | Rent | $/sqft | DOM | Units | Dist |
|---|---|---|---|---|---|---|---|---|
| 5 Sheridan St Auburn, NY | 4.0 | 2.0 | 1788 | $1,995 | $1.12 | 44d | 1 | 0.29mi |
| 173 E Genesee St Unit 171 Auburn, NY | 3.0 | 1.5 | 2000 | $2,000 | $1.00 | 44d | 1 | 0.47mi |
| 78 Chedell Pl Auburn, NY | 2.0 | 1.0 | 2096 | $1,100 | $0.52 | 44d | 1 | 1.15mi |
Listing history 4 events
-
2025-11-13status Pending
-
2025-10-28$57,900 Active
-
2025-10-28historical
-
2025-10-27$57,900 Active
ⓘ Source: listings_history table (triggers on properties + properties_extension) + one-shot
backfill from property_details.listing_events for pre-trigger history.
Tax reassessment forecast NY · Partial reset (capped growth)
- Current annual tax
- $2,030 · $169/mo
- Projected year-2 tax
- $2,030 · $169/mo
- Expected delta
- $0/yr ($0/mo · 0.0%)
ⓘ Screening estimate from a state-policy table — verify with the county assessor before closing.
Climate risk First Street
- Flood 1/10 Low FEMA zone X (unshaded) · 0% chance over 30 yrs
- Wildfire 1/10 Low
- Heat 2/10 Low 7 d/yr ≥95°F today · 15 d/yr by 30 yrs out
- Wind 1/10 Low 100% chance of damaging wind over 30 yrs
- Air quality 2/10 Low 0 unhealthy d/yr today · 1 by 30 yrs out
Nearby sold comps map
Loading sold comps map…
Walkable amenities ~0.75 mi
Loading nearby amenities…
Taxation est. · year 1
- Rental income
- $20,638
- − Mortgage interest
- −$3,243
- − Property taxes
- −$2,030
- − Insurance
- −$290
- − Repairs & maintenance
- −$1,651
- − Management
- −$1,651
- − Depreciation
- −$1,684
- Taxable income
- $10,089
- Est. tax owed @ 24.0%
- −$2,421
- After-tax cash flow
- $7,920/yr
For passive investors: Depreciation is non-cash, so a rental often shows a tax loss while cash-flowing — sheltering income. Rental losses are passive: they offset passive income freely, and up to $25,000/yr can offset ordinary (W-2) income if you actively participate and your MAGI is under $100k (phasing out to $0 by $150k); unused losses carry forward. On sale, claimed depreciation is recaptured at up to 25%, and gains may owe capital-gains tax (a 1031 exchange can defer both). Figures are a year-1 estimate at your 24.0% rate — not tax advice; consult a CPA.
Schools (NCES district)
- District
- Auburn City School District
- NCES district ID
- 3603480
- Math proficiency
- 31% ▼ -17.00%
- Reading proficiency
- 39% ▲ 2.00%
- Median HH income
- $43,567
- Composite
- 29.71/100
- National rank
- #6452
- State rank
- #558 of 590 in NY
Livability — Auburn
- Score
- 74/100
- State rank
- #298
- US rank
- #4814
Category grades
Schools grade is shown separately in the Schools card above.
Census & demographics
- Census place
- Auburn, NY
- County
- Cayuga County · 37,247 people
- City population
- 37,247
- Metro
- Auburn, NY
- Population (ZIP)
- 37,247
- Household income
- $60,712
- Rent vs Own
- Severe rent burden
- 1449.0
Population outlook (Cayuga County) Hauer SSP2
- Today (2025)
- 74,820 people
- By 2030
- 72,402 · -3.2%
- By 2040
- 66,917 · -10.6%
- By 2050
- 61,007 · -18.5%
- By 2075
- 48,047 · -35.8%
- By 2100
- 34,512 · -53.9%
Race, ethnicity, and origin ACS 2023
- Neighborhood character
- Predominantly White (87%)
- Race & ethnicity
- White 87% Two or more races 7% Black 3% Hispanic / Latino 3%
- Common ancestry
- Romanian 8% Subsaharan African 3% Lithuanian 2%
- Foreign-born
- 2% · Canada
- Languages at home
- 95% English-only · Spanish 2% Other Indo-European 1% German/W. Germanic 1%
Political lean MEDSL · Cayuga
- 2024 margin
- R (+13.0) · D 43.5% · R 56.5%
- 2008→2024 swing
- -21.5pp toward R · 2008: 8.5pp · 2024: -13.0pp
- All cycles
- 2024: R+13.0 2020: R+9.2 2016: R+13.2 2012: D+10.8 2008: D+8.5
Not yet ingested
- Civics
- —
Market trends
- HPI YoY
- ▼ -97.53%
- Current HPI
- 338.5537
- Rent YoY
- —
- Metro
- Auburn, NY
- State GDP YoY
- ▲ 2.60%
- F500 in state
- 92
Industry mix (Fortune 500 HQ in NY)
| Industry | F500 HQs | Revenue |
|---|---|---|
| Financial Services | 10 | $950B |
|
||
| Consumer Goods | 9 | $162B |
|
||
| Insurance | 4 | $225B |
|
||
| Telecommunications | 2 | $144B |
|
||
| Pharmaceuticals | 2 | $112B |
|
||
| Media / Entertainment | 2 | $69B |
|
||
Price history
+0.0% since first listed4 events — show timeline
- 2025-11-13 Pending — UNYREIS
- 2025-10-28 Listing Removed — UNYREIS
- 2025-10-28 Listed $57,900 UNYREIS
- 2025-10-27 Listed $57,900 UNYREIS
Property tax history
-1.1%/yrLatest (2025): $2,030 · -9.7% YoY. Source: county tax records.
Cash-flow waterfall
monthlySold comps — $/sqft
last 12 mo · ≤1 miLoading sold comps…