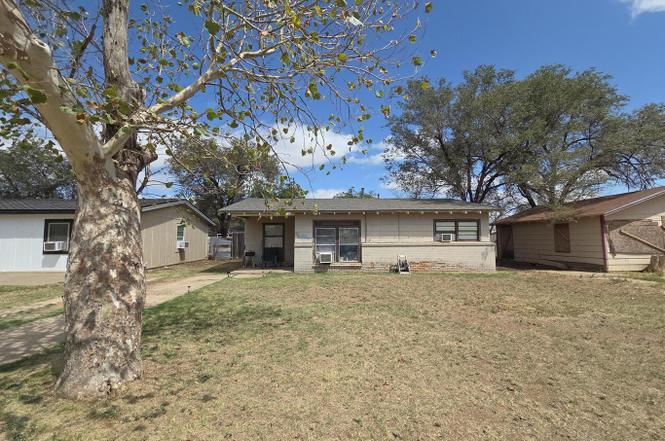
402 39th St · Lubbock, TX
Flood risk 1/10 · Minimal
- FEMA flood zone
- X (unshaded)
- Chance of flooding over 30 yrs
- 0.0%
- Est. flood insurance / yr
- $507 – $1,088
Fire risk 2/10 · Minimal
- Est. fire insurance / yr
- $1,222 – $2,270
Heat risk 5/10 · Moderate
- Hot days now (above 100°F)
- 7 days/yr
- Hot days in 30 yrs
- 21 days/yr
Wind risk 2/10 · Minimal
- Chance of severe wind over 30 yrs
- —
Air-quality risk 2/10 · Minimal
- Unhealthy air days now
- 1 days/yr
- Unhealthy air days in 30 yrs
- 1 days/yr
Risk factors via First Street. Map © Google.
Why this score? — see what drove the B grade
The composite is a weighted blend of 9 inputs, each scored 0–100. Each bar is that input's sub-score; the figure is the points it added to the 100-point composite (weight × sub-score).
- Cash flow +29.8/30.0
- DSCR +10.0/10.0
- 1% rule +7.9/10.0
- ARV discount +7.5/15.0
- Appreciation +6.6/10.0
- Livability +4.0/5.0
- Schools +3.1/10.0
- Rent growth +2.5/5.0
- Condition / age +2.5/5.0
$75,000
🖨 Deal sheet 📄 Offer letter ✓ Due diligence
Listing remarks MLS
Incredible opportunity to acquire a turn-key, remodeled 6-property rental portfolio offering immediate cash flow and minimal future CapEx. Five homes are fully remodeled and tenant-occupied with updated interiors, solid rental history, and proven performance. One property is recently remodeled and move-in ready for lease-up or owner use. Each home features updated flooring, modern kitchens and baths, fresh paint, and improved mechanicals. Perfect for out-of-state investors, 1031 exchange buyers, or anyone looking for stable, low-maintenance rentals from day one. Portfolio can be purchased only as a package—no individual sales. Financials, rent rolls, and additional details available upon request.
Key facts
- 6,625 sq ft lot
- Built 1950
Property features AI
Finance
- Other: Listing broker: The 32:18 Management Group
Exterior
- Parking: Driveway
- Utilities: Gas water heater (gas); Standard electric (details not provided); Municipal sewer/water (details not provided)
- Home design: Single-family residence; Residential property
- Construction: Wood siding; Pillar/post/pier foundation; Composition roof; Built before or in recent records (year not provided)
- Exterior features: Other exterior features; Asphalt road access
Interior
- Kitchen: Gas range; Refrigerator
- Flooring: Laminate flooring
- Bathrooms: 1 full bathroom
- Heating & cooling: Has heating; Has cooling; Attic fan
- Interior features: Ceiling fans; Exhaust fan
- Laundry & utility: In-unit laundry; Gas water heater
Neighborhood map
What this means for you Summary
Snapshot
- This is a 3-bed/1.0-bath single-family listed at $75k.
Deal economics
- At list price, monthly cash flow is $276 ($3k/yr) — positive.
- The deal already cash-flows at list — no discount required.
- Meets the 1% rule at list price ($969 rent vs $75k).
Location & tenants
- Location reads 80/100 on livability (#37 in TX, #1,749 nationally) — a professional / high-income tenant draw. Strengths: commute A+, cost of living A+, housing A+; Watch: employment C-, schools D+, crime F.
- Lubbock ISD (urban): math 36% / reading 39% proficiency, ranked #481 of 826 in TX (top 58%) — families likely to look elsewhere, expect single-tenant / working-renter base with shorter leases; 60% free/reduced lunch — lower-income household profile, screen leases tightly.
- Market conditions: 91 active listings in the ZIP; 40 comparable units currently listed for rent nearby; rentals at typical pace (median 22d on market — plan ~3-4 weeks tenant-placement turnaround); 2,219 units permitted in Lubbock County in 2024 (252 in 5+ unit buildings).
Forward outlook
- In year one you build about $3k of equity ($519 loan paydown + $2k appreciation (3.2% local appreciation)).
- Lubbock County population projected at +39% by 2050 — long-run rental-demand tailwind backs the buy-and-hold thesis.
- At projected returns (3.2% appreciation + 3.0% rent growth), your $21k cash investment doubles in ~4 years — after that, you're playing with house money.
Negotiation context
- Only 1 days on market — expect competitive offers; lowballing is unlikely to land.
- 4 sale attempts since 3y ago with the ask held roughly flat each time — persistent listings suggest the price (not the market) is what's stuck; bring a comps-based counter.
Risks & watch-outs
- Watch-outs: built in 1950 — expect roof / HVAC / electrical / plumbing capex.
- Climate carrying-cost: extreme-heat days projected 7→21/yr by 2055 (HVAC capex compounding) — expect insurance premiums to compound above CPI over the hold.
Questions for the listing agent
- Built in 1950 — when were the roof, HVAC, electrical panel, plumbing, and water heater last replaced?
- Is there a deadline driving the sale (1031 exchange, divorce, estate, relocation)? That informs how much negotiation room exists.
- Schools are D-rated, which usually means shorter tenancies and higher turnover. Who's the typical renter profile here, and what's been the actual vacancy rate?
- Crime grade is F in this area — have there been break-ins, vandalism, or insurance claims at this property in the last 3 years? What carrier currently insures it and at what premium?
- What's the average days-on-market for RENTAL listings here right now (not sales)? A rising rental-DOM trend means longer vacancies and softer asking-rent achievability than the comps imply.
- What's the recent tenant-quality profile in this submarket — average credit score on applications, eviction rate, late-payment / NSF rate, and stable-employment percentage? A property-management company in the area should have these aggregated.
- How much new for-sale + rental construction is in the pipeline within 1–3 miles? Heavy new supply typically softens prices + rents 12–24 months out; constrained supply supports both.
Investment metrics
- 1% rule
- 1.29% ✓
- Cap rate
- 10.71%
- Cash-on-cash
- 15.77%
- DSCR
- 1.70
- GRM
- 6.4
CMA / ARV
No comps found within radius.
Projected returns pro-forma
3.22% appreciation · 3.0% rent growth · sell at horizon
- IRR
- 22.8%
- Equity multiple
- 2.31×
- Total profit
- $27,497
- Equity at exit
- $34,671
- IRR
- 23.5%
- Equity multiple
- 4.44×
- Total profit
- $72,169
- Equity at exit
- $54,180
Cash invested: $21,000 (down + closing). Projections, not guarantees.
Landlord ↔ Tenant lean methodology
- Overall (STATE)
- 87 Strongly Landlord-Friendly
- State Texas
- 87 Strongly Landlord-Friendly · R+5
- County
- — inherits STATE
- City
- — inherits STATE
ZIP-level market 79404
- Home prices YoY
- 2.0%
- Active inventory
- 91
- Price-to-rent
- 6.4×
Monthly cashflow live
- Estimated rent
- $969 high interval (Pro) →
- Mortgage (P&I)
- −$393
- Tax from tax record
- −$65 /mo · $781/yr
- Insurance
- −$31
- HOA
- −$0
- Vacancy / Maint / Mgmt
- −$204
- Net cashflow
- $276
Break-even live
UW: 25.0% down · 7.5% · 30yr · 1.5% tax · 5.0% vac · 8.0% maint · 8.0% mgmt
Financing live
Cash to close
- Down payment
- $18,750
- Closing costs
- $2,250
- Reserves months
- —
- Total cash needed
- —
Loan-product check · same deal, 3 products live
Conventional
25% down · 7.5% · 30yr
- Down + closing
- —
- Monthly P&I
- —
- Monthly cashflow
- —
- DSCR
- —
- Eligible?
- —
Personal DTI + credit; lowest rate.
DSCR
20% down · 8.5% · 30yr
- Down + closing
- —
- Monthly P&I
- —
- Monthly cashflow
- —
- DSCR
- —
- Eligible?
- —
No personal income docs; deal must DSCR.
Hard money
10% down · 12.0% · 12mo
- Down + closing
- —
- Monthly P&I
- —
- Monthly cashflow
- —
- DSCR
- —
- Eligible?
- —
Short-term bridge; refi at stabilization.
Rent comps 40 comps
| Address | Beds | Baths | Sqft | Rent | $/sqft | DOM | Units | Dist |
|---|---|---|---|---|---|---|---|---|
| 330 37th St Unit 2 Lubbock, TX | 3.0 | 1.0 | 750 | $750 | $1.00 | 14d | 1 | 0.16mi |
| 332 37th St Unit 2 Lubbock, TX | 3.0 | 1.0 | 725 | $700 | $0.97 | 21d | 1 | 0.16mi |
| 512 39th St Lubbock, TX | 2.0 | 1.0 | 876 | $849 | $0.97 | 14d | 1 | 0.18mi |
| 211 36th St Unit B Lubbock, TX | 3.0 | 1.0 | 750 | $775 | $1.03 | 44d | 1 | 0.19mi |
| 209 36th St Unit A Lubbock, TX | 3.0 | 1.0 | 750 | $750 | $1.00 | 44d | 1 | 0.19mi |
| 609 38th St Unit B Lubbock, TX | 2.0 | 1.0 | 660 | $550 | $0.83 | 44d | 1 | 0.23mi |
| 519 42nd St Apt A Lubbock, TX | 3.0 | 1.0 | 1092 | $895 | $0.82 | 14d | 1 | 0.31mi |
| 220 44th St Unit A Lubbock, TX | 3.0 | 2.0 | 980 | $910 | $0.93 | 14d | 1 | 0.31mi |
| 505 E 37th St Lubbock, TX | 3.0 | 1.0 | 960 | $1,125 | $1.17 | 14d | 1 | 0.43mi |
| 519 45th St Unit A Lubbock, TX | 3.0 | 1.0 | 1100 | $850 | $0.77 | 14d | 1 | 0.45mi |
| 529 45th St Unit A Lubbock, TX | 3.0 | 1.0 | 1100 | $875 | $0.80 | 14d | 1 | 0.47mi |
| 703 47th St Unit B Lubbock, TX | 2.0 | 1.0 | 821 | $750 | $0.91 | 21d | 1 | 0.59mi |
| 705 47th St Unit A Lubbock, TX | 2.0 | 1.0 | 821 | $750 | $0.91 | 21d | 1 | 0.59mi |
| 713 47th St Unit B Lubbock, TX | 2.0 | 1.0 | 800 | $750 | $0.94 | 21d | 1 | 0.61mi |
| 1204 36th St Unit b Lubbock, TX | 3.0 | 2.0 | 872 | $835 | $0.96 | 14d | 1 | 0.62mi |
| 1107 45th St Unit B Lubbock, TX | 2.0 | 1.0 | 728 | $850 | $1.17 | 44d | 1 | 0.65mi |
| 1312 40th St Lubbock, TX | 3.0 | 1.0 | 940 | $795 | $0.85 | 21d | 1 | 0.71mi |
| 1119 46th St Unit A Lubbock, TX | 2.0 | 1.0 | 704 | $595 | $0.85 | 21d | 1 | 0.74mi |
| 313 52nd St Lubbock, TX | 4.0 | 1.0 | 1044 | $975 | $0.93 | 21d | 1 | 0.87mi |
| 3104 Avenue N Lubbock, TX | 2.0 | 1.0 | 750 | $785 | $1.05 | 21d | 1 | 0.89mi |
| 1101 52nd St Apt C Lubbock, TX | 2.0 | 1.0 | 721 | $850 | $1.18 | 21d | 1 | 0.99mi |
| 1313 25th St Lubbock, TX | 2.0 | 1.0 | 780 | $875 | $1.12 | 44d | 1 | 1.09mi |
| 1317 52nd St Unit C Lubbock, TX | 2.0 | 1.0 | 755 | $650 | $0.86 | 21d | 1 | 1.11mi |
| 1712 42nd St Unit B Lubbock, TX | 3.0 | 1.0 | 899 | $695 | $0.77 | 21d | 1 | 1.11mi |
| 1608 29th St Unit B Lubbock, TX | 2.0 | 1.5 | 694 | $750 | $1.08 | 14d | 1 | 1.12mi |
| 5512 Avenue G Unit G Lubbock, TX | 3.0 | 1.0 | 1117 | $1,000 | $0.90 | 44d | 1 | 1.12mi |
| 1316 53rd St Apt D Lubbock, TX | 2.0 | 1.0 | 755 | $695 | $0.92 | 44d | 1 | 1.12mi |
| 1307 53rd St Unit 1307 C Lubbock, TX | 2.0 | 1.0 | 755 | $695 | $0.92 | 44d | 1 | 1.12mi |
| 1710 45th St Unit A Lubbock, TX | 2.0 | 1.0 | 714 | $595 | $0.83 | 14d | 1 | 1.13mi |
| 1511 52nd St Lubbock, TX | 2.0 | 1.0 | 648 | $800 | $1.23 | 44d | 1 | 1.17mi |
| 1610 28th St Unit A Lubbock, TX | 2.0 | 2.0 | 1060 | $750 | $0.71 | 14d | 1 | 1.17mi |
| 1609 27th St Lubbock, TX | 2.0 | 1.0 | 862 | $900 | $1.04 | 44d | 1 | 1.19mi |
| 1717 47th St Unit B Lubbock, TX | 3.0 | 1.0 | 830 | $775 | $0.93 | 21d | 1 | 1.22mi |
| 1704 E 29th St Lubbock, TX | 2.0 | 1.0 | 832 | $775 | $0.93 | 21d | 1 | 1.29mi |
| 2015 Avenue L Unit B Lubbock, TX | 3.0 | 2.0 | 980 | $960 | $0.98 | 14d | 1 | 1.30mi |
| 1516 E 27th St Unit B Lubbock, TX | 2.0 | 2.0 | 1025 | $1,195 | $1.17 | 44d | 1 | 1.32mi |
| 2011 35th St Lubbock, TX | 2.0 | 1.0 | 810 | $800 | $0.99 | 44d | 1 | 1.32mi |
| 1724 27th St Lubbock, TX | 2.0 | 1.0 | 850 | $925 | $1.09 | 44d | 1 | 1.36mi |
| 3113 Teak Ave Lubbock, TX | 3.0 | 1.0 | 1088 | $750 | $0.69 | 44d | 1 | 1.38mi |
| 3113 Teak Ave Lubbock, TX | 3.0 | 1.0 | 1088 | $695 | $0.64 | 21d | 1 | 1.38mi |
Listing history 2 events
-
2026-06-18remarks 699-char remark
-
2026-06-18$75,000 Active 1 DOM
ⓘ Source: listings_history table (triggers on properties + properties_extension) + one-shot
backfill from property_details.listing_events for pre-trigger history.
Tax reassessment forecast TX · Resets to sale price
- Current annual tax
- $781 · $65/mo
- Projected year-2 tax
- $1,372 · $114/mo
- Expected delta
- +$592/yr (+$49/mo · 75.8%)
ⓘ Screening estimate from a state-policy table — verify with the county assessor before closing.
Climate risk First Street
- Flood 1/10 Low FEMA zone X (unshaded) · 0% chance over 30 yrs
- Wildfire 2/10 Low
- Heat 5/10 Major 7 d/yr ≥100°F today · 21 d/yr by 30 yrs out
- Wind 2/10 Low
- Air quality 2/10 Low 1 unhealthy d/yr today · 1 by 30 yrs out
Nearby sold comps map
Loading sold comps map…
Walkable amenities ~0.75 mi
Loading nearby amenities…
Taxation est. · year 1
- Rental income
- $11,629
- − Mortgage interest
- −$4,201
- − Property taxes
- −$781
- − Insurance
- −$375
- − Repairs & maintenance
- −$930
- − Management
- −$930
- − Depreciation
- −$2,182
- Taxable income
- $2,229
- Est. tax owed @ 24.0%
- −$535
- After-tax cash flow
- $2,776/yr
For passive investors: Depreciation is non-cash, so a rental often shows a tax loss while cash-flowing — sheltering income. Rental losses are passive: they offset passive income freely, and up to $25,000/yr can offset ordinary (W-2) income if you actively participate and your MAGI is under $100k (phasing out to $0 by $150k); unused losses carry forward. On sale, claimed depreciation is recaptured at up to 25%, and gains may owe capital-gains tax (a 1031 exchange can defer both). Figures are a year-1 estimate at your 24.0% rate — not tax advice; consult a CPA.
Schools (NCES district)
- District
- Lubbock ISD
- NCES district ID
- 4828500
- Math proficiency
- 36% ▼ -8.00%
- Reading proficiency
- 39% ▼ -1.00%
- Median HH income
- $39,820
- Composite
- 31.44/100
- National rank
- #5984
- State rank
- #481 of 826 in TX
Livability — Lubbock
- Score
- 80/100
- State rank
- #37
- US rank
- #1749
Category grades
Schools grade is shown separately in the Schools card above.
Census & demographics
- Census place
- Lubbock, TX
- County
- Lubbock County · 293,542 people
- City population
- 283,030
- Metro
- Lubbock, TX
- Population (ZIP)
- 8,529
- Household income
- $51,630
- Rent vs Own
- Severe rent burden
- 366.0
Population outlook (Lubbock County) Hauer SSP2
- Today (2025)
- 345,960 people
- By 2030
- 371,449 · +7.4%
- By 2040
- 424,539 · +22.7%
- By 2050
- 481,150 · +39.1%
- By 2075
- 633,467 · +83.1%
- By 2100
- 746,853 · +115.9%
Race, ethnicity, and origin ACS 2023
- Neighborhood character
- Diverse neighborhood (Simpson 0.60)
- Race & ethnicity
- Hispanic / Latino 55% Black 22% White 20% Two or more races 17% Native American 2%
- Hispanic origin (detail)
- Mexican 46%
- Common ancestry
- Romanian 1% Lithuanian 0%
- Foreign-born
- 5% · Canada
- Languages at home
- 64% English-only · Spanish 36%
Political lean MEDSL · Lubbock
- 2024 margin
- Solid R (+39.5) · D 29.7% · R 69.2% · Other 1.0%
- 2008→2024 swing
- -2.8pp toward R · 2008: -36.7pp · 2024: -39.5pp
- All cycles
- 2024: R+39.5 2020: R+32.2 2016: R+38.4 2012: R+40.9 2008: R+36.7
Not yet ingested
- Civics
- —
Market trends
- HPI YoY
- ▲ 3.22%
- Current HPI
- 163.854
- Rent YoY
- —
- Metro
- Lubbock, TX
- State GDP YoY
- ▲ 3.95%
- F500 in state
- 110
Industry mix (Fortune 500 HQ in TX)
| Industry | F500 HQs | Revenue |
|---|---|---|
| Energy | 16 | $1,198B |
|
||
| Technology | 5 | $198B |
|
||
| Engineering / Construction | 4 | $72B |
|
||
| Energy Services | 3 | $60B |
|
||
| Utilities | 3 | $41B |
|
||
| Healthcare | 2 | $330B |
|
||
Price history
+22.0% since first listed11 events — show timeline
- 2026-06-17 Listed $75,000 LARMLS
- 2026-02-06 Sold (MLS) — LARMLS
- 2025-12-31 Pending — LARMLS
- 2025-12-03 Price Changed $75,000 LARMLS
- 2025-10-16 Listed $61,500 LARMLS
- 2025-06-19 Rental Removed $750 BUILDIUM
- 2025-04-29 Listed for Rent $750 BUILDIUM
- 2023-10-07 Rental Removed $800 BUILDIUM
- 2023-09-15 Listed for Rent $800 BUILDIUM
- 2011-06-02 Sold (Public Records) — Public Records
- 1997-07-01 Sold (Public Records) — Public Records
Property tax history
+3.0%/yrLatest (2025): $781 · +11.7% YoY. Source: county tax records.
Cash-flow waterfall
monthlySold comps — $/sqft
last 12 mo · ≤1 miLoading sold comps…