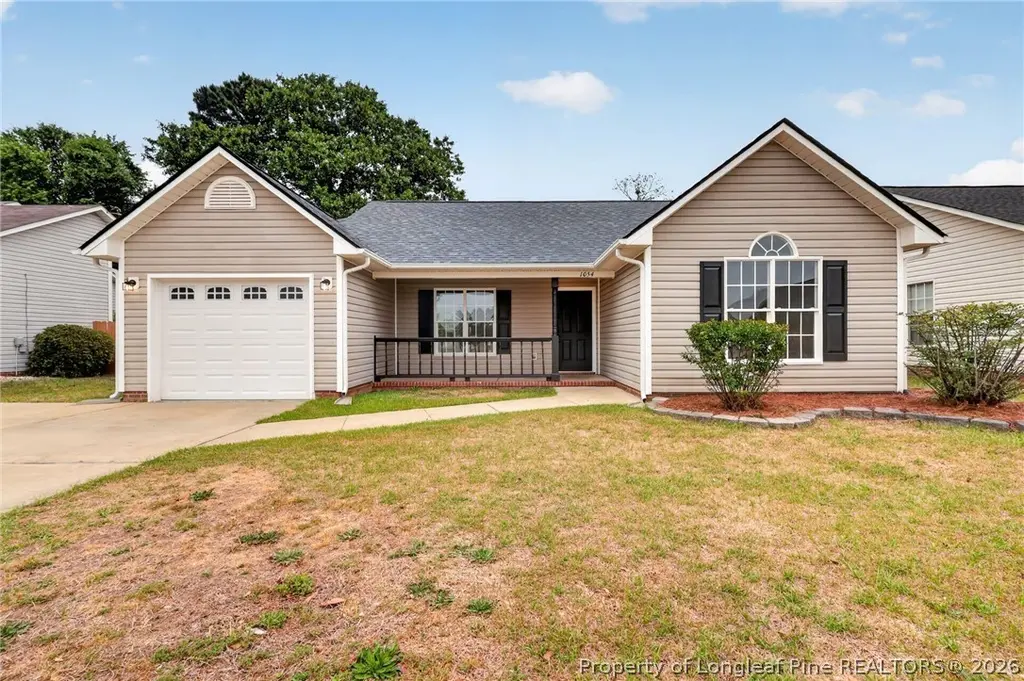
1054 Coalport Rd · Hope Mills, NC
Flood risk 1/10 · Minimal
- FEMA flood zone
- X (unshaded)
- Chance of flooding over 30 yrs
- 0.0%
- Est. flood insurance / yr
- $507 – $1,088
Fire risk 6/10 · Moderate
- Est. fire insurance / yr
- $906 – $1,684
Heat risk 8/10 · Major
- Hot days now (above 106°F)
- 7 days/yr
- Hot days in 30 yrs
- 16 days/yr
Wind risk 6/10 · Moderate
- Chance of severe wind over 30 yrs
- 74.0%
Air-quality risk 1/10 · Minimal
- Unhealthy air days now
- 0 days/yr
- Unhealthy air days in 30 yrs
- 0 days/yr
Risk factors via First Street. Map © Google.
Why this score? — see what drove the D- grade
The composite is a weighted blend of 9 inputs, each scored 0–100. Each bar is that input's sub-score; the figure is the points it added to the 100-point composite (weight × sub-score).
- Cash flow +12.8/30.0
- ARV discount +5.1/15.0
- DSCR +3.8/10.0
- Rent growth +3.6/5.0
- Livability +3.4/5.0
- Schools +3.1/10.0
- 1% rule +2.7/10.0
- Condition / age +2.5/5.0
- Appreciation +0.0/10.0
$214,900
🖨 Deal sheet 📄 Offer letter ✓ Due diligence
Listing remarks
Beautifully updated 3-bedroom, 2-bath home offering a clean, modern feel and highly functional layout. Fresh interior paint, new LVP flooring, and new carpet create a bright and comfortable living environment, enhanced by abundant natural light and updated light fixtures throughout. The kitchen stands out with new quartz countertops, updated cabinets, and a full suite of new appliances including range, microwave, and dishwasher—perfect for both everyday living and entertaining. Both bathrooms have been refreshed with a contemporary touch, while the new HVAC system adds year-round comfort and efficiency. The spacious living areas flow seamlessly, and the backyard provides plenty of roo
Key facts
- Updated cabinets
- New appliances
- Refreshed bathrooms
Tags
Property features AI
Exterior
- Parking: Attached 1-car garage; 1 covered parking space
- Utilities: Public water; Public sewer
- Home design: Single-family residence; One-story
- Construction: Vinyl siding
- Exterior features: Exterior lighting; Rain gutters; Patio; Fenced yard
Interior
- Kitchen: Dishwasher; Free-standing electric range; Microwave
- Bedrooms: Total rooms: 3
- Flooring: Carpet; Vinyl
- Bathrooms: 2 full bathrooms
- Heating & cooling: Central air conditioning; Forced air heating
- Interior features: Double vanity; Eat-in kitchen; Fireplace in family room
- Laundry & utility: Laundry located in garage
Neighborhood map
What this means for you Summary
Snapshot
- This is a 3-bed/3.0-bath single-family listed at $215k.
Deal economics
- At list price, monthly cash flow is $-18 ($-214/yr) — negative.
- To cash-flow at today's rent, offer at most $212k (1.5% below list).
- To meet the 1% rule (rent ≥ 1% of price), the offer needs to be $166k (22.6% below list).
- Recommended offer: $166k (22.6% below list) — sets the bar for 1% rule.
- Cap rate 6.2% vs local median 4.8% in Hope Mills — meaningfully above typical; check what's discounted (condition, days-on-market, listing class) to confirm the premium yield is real.
Location & tenants
- Location reads 67/100 on livability (#234 in NC) — a middle-class / working-renter tenant base. Strengths: cost of living A+, housing A+, health & safety B+; Watch: crime D-, amenities F, commute F.
- Cumberland County Schools (urban): math 32% / reading 41% proficiency, ranked #126 of 178 in NC (top 71%) — families likely to look elsewhere, expect single-tenant / working-renter base with shorter leases.
- Zoned schools: South View Middle (math 20% / reading 34%, grade F, #374 of 475 statewide, top 80%, 661 students, 99% FRL); South View High (math 60% / reading 43%, grade D+, #299 of 535 statewide, top 56%, 1,502 students, 66% FRL) — zoned schools average 82% FRL vs 55% district-wide (28 pts higher); higher-poverty schools than district average — tighter screening recommended.
- Market conditions: Rents rising fast (+4.3%/yr); 317 active listings in the ZIP; 14 comparable units currently listed for rent nearby; rentals at typical pace (median 24d on market — plan ~3-4 weeks tenant-placement turnaround); 1,125 units permitted in Cumberland County in 2024 (104 in 5+ unit buildings).
- This rent runs 30% of the median local income ($66k/yr) — at the standard rent-burdened threshold; future hikes will face affordability resistance.
Forward outlook
- Local home prices are declining (-3.0%/yr); year-one equity from $1k of loan paydown is wiped out by about $6k of value loss. Plan a longer hold.
Negotiation context
- Only 3 days on market — expect competitive offers; lowballing is unlikely to land.
Risks & watch-outs
- Climate carrying-cost: major wind risk, 74% chance of damaging wind over 30y; major wildfire risk; extreme-heat days projected 7→16/yr by 2055 (HVAC capex compounding) — expect insurance premiums to compound above CPI over the hold.
Questions for the listing agent
- What do current leases actually rent for vs. the listed asking? Can we see a recent rent roll and the last 12 months of T-12 income?
- Is there a deadline driving the sale (1031 exchange, divorce, estate, relocation)? That informs how much negotiation room exists.
- Schools are D-rated, which usually means shorter tenancies and higher turnover. Who's the typical renter profile here, and what's been the actual vacancy rate?
- Crime grade is D in this area — have there been break-ins, vandalism, or insurance claims at this property in the last 3 years? What carrier currently insures it and at what premium?
- The area grade is low — what's the realistic commute time and amenity access for the typical tenant pool here? Any planned neighborhood developments (good or bad) we should know about?
- What's the average days-on-market for RENTAL listings here right now (not sales)? A rising rental-DOM trend means longer vacancies and softer asking-rent achievability than the comps imply.
- What's the recent tenant-quality profile in this submarket — average credit score on applications, eviction rate, late-payment / NSF rate, and stable-employment percentage? A property-management company in the area should have these aggregated.
- How much new for-sale + rental construction is in the pipeline within 1–3 miles? Heavy new supply typically softens prices + rents 12–24 months out; constrained supply supports both.
Investment metrics
- 1% rule
- 0.77% ✗
- Cap rate
- 6.19%
- Cash-on-cash
- -0.36%
- DSCR
- 0.98
- GRM
- 10.8
CMA / ARV
- ARV (on-the-fly)
- $204,050
- Comps found
- 12
Show comp detail 12 sales within ~0.75 mi
| Address | Dist | Beds/Ba | Sqft | Sold | Price | $/sf | Match |
|---|---|---|---|---|---|---|---|
| 1054 Coalport Rd | 0.00mi | 3/2.0 | 1,134 (-3%) | 0mo | $214,900 | $190 | 91 |
| 3434 Winesap Rd | 0.19mi | 3/2.0 | 1,231 (+6%) | 5mo | $207,000 | $168 | 74 |
| 3824 Constance Rd | 0.34mi | 3/2.0 | 1,109 (-5%) | 1mo | $201,500 | $182 | 71 |
| 3127 Ansley Dr | 0.45mi | 3/2.0 | 1,203 (+3%) | 3mo | $210,000 | $175 | 67 |
| 3129 Nontucket Ln | 0.43mi | 3/2.0 | 1,117 (-4%) | 3mo | $215,000 | $192 | 66 |
| 3212 Ansley Dr | 0.43mi | 3/2.0 | 1,245 (+7%) | 4mo | $205,000 | $165 | 62 |
| 3812 Constance Rd | 0.36mi | 3/2.0 | 1,262 (+8%) | 5mo | $205,000 | $162 | 61 |
| 3230 Nontucket Ln | 0.35mi | 3/2.0 | 1,288 (+10%) | 4mo | $218,000 | $169 | 59 |
| 1424 Middlesbrough Dr | 0.66mi | 3/2.0 | 1,210 (+4%) | 6mo | $245,000 | $202 | 54 |
| 3812 Goforth Dr | 0.33mi | 3/2.0 | 1,337 (+15%) | 3mo | $210,000 | $157 | 54 |
| 3466 Legion Rd | 0.61mi | 3/2.0 | 1,098 (-6%) | 5mo | $192,350 | $175 | 53 |
| 3159 Ansley Dr | 0.44mi | 3/2.0 | 1,012 (-13%) | 3mo | $185,000 | $183 | 51 |
Match score weights: distance 35% · size 25% · config 20% · recency 20%. Top-matched comps best support the ARV.
Projected returns pro-forma
-3.0% appreciation · 4.28% rent growth · sell at horizon
- IRR
- -15.7%
- Equity multiple
- 0.44×
- Total profit
- $-33,860
- Equity at exit
- $32,042
- IRR
- -5.4%
- Equity multiple
- 0.63×
- Total profit
- $-22,096
- Equity at exit
- $18,581
Cash invested: $60,172 (down + closing). Projections, not guarantees.
Landlord ↔ Tenant lean methodology
- Overall (STATE)
- 85 Strongly Landlord-Friendly
- State North Carolina
- 85 Strongly Landlord-Friendly · R+3
- County
- — inherits STATE
- City
- — inherits STATE
ZIP-level market 28348
- Home prices YoY
- -14.0%
- Rents YoY
- 4.3%
- Active inventory
- 317
- Price-to-rent
- 10.8×
Monthly cashflow live
- Estimated rent
- $1,663 high interval (Pro) →
- Mortgage (P&I)
- −$1,127
- Tax from tax record
- −$115 /mo · $1,380/yr
- Insurance
- −$90
- HOA
- −$0
- Vacancy / Maint / Mgmt
- −$349
- Net cashflow
- $-18
Break-even live
UW: 25.0% down · 7.5% · 30yr · 1.5% tax · 5.0% vac · 8.0% maint · 8.0% mgmt
Financing live
Cash to close
- Down payment
- $53,725
- Closing costs
- $6,447
- Reserves months
- —
- Total cash needed
- —
Loan-product check · same deal, 3 products live
Conventional
25% down · 7.5% · 30yr
- Down + closing
- —
- Monthly P&I
- —
- Monthly cashflow
- —
- DSCR
- —
- Eligible?
- —
Personal DTI + credit; lowest rate.
DSCR
20% down · 8.5% · 30yr
- Down + closing
- —
- Monthly P&I
- —
- Monthly cashflow
- —
- DSCR
- —
- Eligible?
- —
No personal income docs; deal must DSCR.
Hard money
10% down · 12.0% · 12mo
- Down + closing
- —
- Monthly P&I
- —
- Monthly cashflow
- —
- DSCR
- —
- Eligible?
- —
Short-term bridge; refi at stabilization.
Rent comps 14 comps
| Address | Beds | Baths | Sqft | Rent | $/sqft | DOM | Units | Dist |
|---|---|---|---|---|---|---|---|---|
| 3100 Winesap Rd Hope Mills, NC | 3.0 | 2.0 | 1082 | $1,495 | $1.38 | 13d | 1 | 0.44mi |
| 1209 Snowy Egret Dr Fayetteville, NC | 3.0 | 2.5 | 1470 | $1,800 | $1.22 | 23d | 1 | 0.47mi |
| 2207 Puffin Pl Fayetteville, NC | 3.0 | 2.0 | 1214 | $1,950 | $1.61 | 13d | 1 | 0.71mi |
| 614 Drypoint Ln Apt B Hope Mills, NC | 2.0 | 2.0 | 900 | $1,050 | $1.17 | 23d | 1 | 0.75mi |
| 1055 Winnall LN Hope Mills, NC | 1.0–3.0 | 1.0–2.0 | 1132 | $2,000 | $1.77 | 13d | 20 | 0.75mi |
| 575 Countrytown Dr Hope Mills, NC | 2.0 | 2.0 | 800 | $1,325 | $1.66 | 23d | 1 | 0.78mi |
| 3038 Walesby Dr Fayetteville, NC | 3.0 | 2.0 | 1272 | $1,650 | $1.30 | 23d | 1 | 0.78mi |
| 2690 Belhaven Rd Fayetteville, NC | 3.0 | 1.0 | 1264 | $1,350 | $1.07 | 23d | 1 | 1.04mi |
| 2621 Elcone Dr Unit 2621 Fayetteville, NC | 2.0 | 1.5 | 815 | $999 | $1.23 | 13d | 1 | 1.08mi |
| 3918 Donna St Fayetteville, NC | 3.0 | 1.0 | 1000 | $1,350 | $1.35 | 23d | 1 | 1.15mi |
| 513 Directive Dr Hope Mills, NC | 2.0 | 2.0 | 1307 | $1,275 | $0.98 | 13d | 1 | 1.18mi |
| 505 Directive Dr Hope Mills, NC | 2.0 | 2.5 | 1254 | $1,495 | $1.19 | 23d | 1 | 1.19mi |
| 408 Sheila St Hope Mills, NC | 3.0 | 1.0 | 1064 | $1,150 | $1.08 | 23d | 1 | 1.28mi |
| 405 Grand Wailea Dr Hope Mills, NC | 1.0–3.0 | 1.0–2.0 | 1061 | $1,656 | $1.56 | 23d | 9 | 1.30mi |
Listing history 2 events
-
2026-05-04status Pending
-
2026-05-01$214,900 Active
ⓘ Source: listings_history table (triggers on properties + properties_extension) + one-shot
backfill from property_details.listing_events for pre-trigger history.
Tax reassessment forecast NC · Resets to sale price
- Current annual tax
- $1,380 · $115/mo
- Projected year-2 tax
- $1,762 · $147/mo
- Expected delta
- +$382/yr (+$32/mo · 27.7%)
ⓘ Screening estimate from a state-policy table — verify with the county assessor before closing.
Climate risk First Street
- Flood 1/10 Low FEMA zone X (unshaded) · 0% chance over 30 yrs
- Wildfire 6/10 Major
- Heat 8/10 Severe 7 d/yr ≥106°F today · 16 d/yr by 30 yrs out
- Wind 6/10 Major 74% chance of damaging wind over 30 yrs
- Air quality 1/10 Low 0 unhealthy d/yr today · 0 by 30 yrs out
Nearby sold comps map
Loading sold comps map…
Walkable amenities ~0.75 mi
Loading nearby amenities…
Taxation est. · year 1
- Rental income
- $19,954
- − Mortgage interest
- −$12,038
- − Property taxes
- −$1,380
- − Insurance
- −$1,074
- − Repairs & maintenance
- −$1,596
- − Management
- −$1,596
- − Depreciation
- −$6,252
- Taxable loss
- −$3,982
- Est. tax savings @ 24.0%
- +$956
- After-tax cash flow
- $742/yr
For passive investors: Depreciation is non-cash, so a rental often shows a tax loss while cash-flowing — sheltering income. Rental losses are passive: they offset passive income freely, and up to $25,000/yr can offset ordinary (W-2) income if you actively participate and your MAGI is under $100k (phasing out to $0 by $150k); unused losses carry forward. On sale, claimed depreciation is recaptured at up to 25%, and gains may owe capital-gains tax (a 1031 exchange can defer both). Figures are a year-1 estimate at your 24.0% rate — not tax advice; consult a CPA.
Schools (NCES district)
- District
- Cumberland County Schools
- NCES district ID
- 3700011
- Math proficiency
- 32% ▼ -2.00%
- Reading proficiency
- 41% ▼ -1.00%
- Median HH income
- $44,168
- Composite
- 31.0/100
- National rank
- #6096
- State rank
- #126 of 178 in NC
Livability — Hope Mills
- Score
- 67/100
- State rank
- #234
- US rank
- #10761
Category grades
Schools grade is shown separately in the Schools card above.
Census & demographics
- County
- Cumberland County · 265,314 people
- City population
- 39,196
- Metro
- Fayetteville, NC
- Population (ZIP)
- 39,196
- Household income
- $66,129
- Rent vs Own
- Severe rent burden
- 746.0
Population outlook (Cumberland County) Hauer SSP2
- Today (2025)
- 330,855 people
- By 2030
- 333,523 · +0.8%
- By 2040
- 335,583 · +1.4%
- By 2050
- 335,325 · +1.4%
- By 2075
- 342,853 · +3.6%
- By 2100
- 340,698 · +3.0%
Race, ethnicity, and origin ACS 2023
- Neighborhood character
- Diverse neighborhood (Simpson 0.67)
- Race & ethnicity
- White 49% Black 27% Hispanic / Latino 13% Two or more races 11% Asian 2% Native American 2%
- Hispanic origin (detail)
- Mexican 4% Puerto Rican 5%
- Common ancestry
- Romanian 2% Lithuanian 1% Serbian 1%
- Foreign-born
- 5% · Canada, South Korea, Vietnam
- Languages at home
- 90% English-only · Spanish 8% Other Indo-European 1%
Political lean MEDSL · Cumberland
- 2024 margin
- D (+13.4) · D 56.1% · R 42.7% · Other 1.2%
- 2008→2024 swing
- -4.3pp toward R · 2008: 17.7pp · 2024: 13.4pp
- All cycles
- 2024: D+13.4 2020: D+16.6 2016: D+16.0 2012: D+19.7 2008: D+17.7
Not yet ingested
- Civics
- —
Market trends
- HPI YoY
- ▼ -37.14%
- Current HPI
- 228.3122
- Rent YoY
- ▲ 4.28%
- Metro
- Fayetteville, NC
- State GDP YoY
- ▲ 3.28%
- F500 in state
- 26
Industry mix (Fortune 500 HQ in NC)
| Industry | F500 HQs | Revenue |
|---|---|---|
| Financial Services | 2 | $213B |
|
||
| Retail | 2 | $95B |
|
||
| Industrial Conglomerate | 1 | $38B |
|
||
| Metals / Steel | 1 | $35B |
|
||
| Utilities | 1 | $30B |
|
||
| Industrial Machinery | 1 | $19B |
|
||
Price history
2 events — show timeline
- 2026-05-04 Pending — LPRMLS
- 2026-05-01 Listed $214,900 LPRMLS
Property tax history
+2.9%/yrLatest (2025): $1,380 · +107.7% YoY. Source: county tax records.
Cash-flow waterfall
monthlySold comps — $/sqft
last 12 mo · ≤1 miLoading sold comps…