245 E 25th St Unit 12J · New York, NY
Flood risk 1/10 · Minimal
- FEMA flood zone
- X (unshaded)
- Chance of flooding over 30 yrs
- 0.0%
- Est. flood insurance / yr
- $507 – $1,088
Fire risk 1/10 · Minimal
- Est. fire insurance / yr
- $691 – $1,283
Heat risk 6/10 · Moderate
- Hot days now (above 99°F)
- 7 days/yr
- Hot days in 30 yrs
- 15 days/yr
Wind risk 6/10 · Moderate
- Chance of severe wind over 30 yrs
- 27.0%
Air-quality risk 4/10 · Minor
- Unhealthy air days now
- 5 days/yr
- Unhealthy air days in 30 yrs
- 7 days/yr
Risk factors via First Street. Map © Google.
Why this score? — see what drove the D grade
The composite is a weighted blend of 9 inputs, each scored 0–100. Each bar is that input's sub-score; the figure is the points it added to the 100-point composite (weight × sub-score).
- Appreciation +7.9/10.0
- ARV discount +7.5/15.0
- Cash flow +5.8/30.0
- 1% rule +5.0/10.0
- Schools +5.0/10.0
- Rent growth +3.8/5.0
- Livability +3.8/5.0
- Condition / age +3.8/5.0
- DSCR +0.2/10.0
$650,000
🖨 Deal sheet 📄 Offer letter ✓ Due diligence
Listing remarks
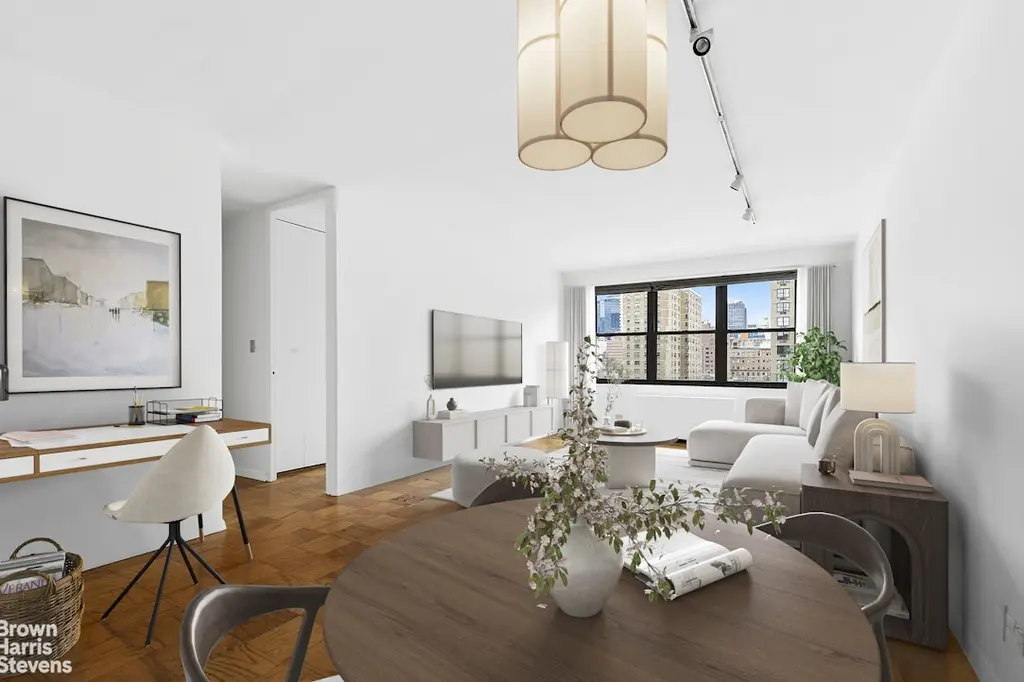
Rarely Available High-Floor Corner One-Bedroom in Kips Bay! Introducing Residence 12J, the highly sought-after J line on a high floor, on the market for sale for the first time since the building went co-op in the 1980s. Light and airy with fantastic bones and an expansive layout, this jumbo-sized corner one-bedroom with beautiful landmark views, is in very good condition and offers an extraordinary opportunity to easily create your dream home. Step into a welcoming entry hallway with two oversized closets to the left, leading to spacious, sun-drenched living space. At the far end, a wall of windows frames stunning city views, including the Empire State Building. Flooded with light morni
Key facts
- Solid wood cabinetry
- Landmark views
- High floor corner
Tags
Property features AI
Finance
- Other: Building features include bike storage and elevators; Zoning: C1-8A; Total units in building: 194
- HOA & community: Monthly association fee of $1,965; Pets allowed in the building
Exterior
- Security: Concierge
- Home design: Condominium in a 20-story building; Entry level: 12
- Construction: Building name: Spruce Ridge
- Exterior features: Building roof deck; Exposures to the east, north and west
Interior
- Bathrooms: 1 full bathroom
- Heating & cooling: Cooling present
- Interior features: Total of 3 rooms; Basement: Other; Has a view
- Laundry & utility: No building laundry (building none)
Neighborhood map
What this means for you Summary
Snapshot
- This is a 1-bed/1.0-bath condo listed at $650k. Condition is rated good.
Deal economics
- At list price, monthly cash flow is $-1k ($-16k/yr) — negative.
- To cash-flow at today's rent, offer at most $461k (29.0% below list).
- Meets the 1% rule at list price ($7k rent vs $650k).
- Recommended offer: $461k (29.0% below list) — sets the bar for cash-flow.
- Cap rate 3.9% vs local median 2.6% in New York — top-decile yield for the area; either an underpriced asset or a hidden risk that comps aren't pricing in. Stress-test before assuming the spread holds.
Location & tenants
- Location reads 75/100 on livability (#268 in NY, #4,188 nationally) — a middle-class / working-renter tenant base. Strengths: amenities A+, commute A+, health & safety A; Watch: crime F, cost of living F.
- Market conditions: Rents rising fast (+5.1%/yr); 232 active listings in the ZIP; 40 comparable units currently listed for rent nearby; rentals leasing fast (median 8d on market — plan ~1-2 weeks tenant-placement turnaround); high-income renter base; 4,467 units permitted in New York County in 2024 (4,463 in 5+ unit buildings).
- At $6,524/mo this rent would consume 54% of the median local household income ($145k/yr) (locally 2470% of renters already pay >50% of income on rent) — very limited rent-growth headroom before tenants either downsize or default.
Forward outlook
- In year one you build about $42k of equity ($4k loan paydown + $37k appreciation (5.7% local appreciation)).
- New York County population projected at +21% by 2050 — long-run rental-demand tailwind backs the buy-and-hold thesis.
- By year 2, paydown + projected appreciation supports a ~$66k cash-out refi (75% LTV) — recoverable capital for the next deal without selling this one.
Negotiation context
- It's been on market 30 days — a 2% lower offer ($640k) is reasonable based on typical stale-listing flexibility.
Risks & watch-outs
- Watch-outs: HOA is 30% of rent.
- Climate carrying-cost: major wind risk, 27% chance of damaging wind over 30y; extreme-heat days projected 7→15/yr by 2055 (HVAC capex compounding) — expect insurance premiums to compound above CPI over the hold.
Questions for the listing agent
- What do current leases actually rent for vs. the listed asking? Can we see a recent rent roll and the last 12 months of T-12 income?
- Built in 1964 — when were the roof, HVAC, electrical panel, plumbing, and water heater last replaced?
- What does the HOA fee cover, when was the last increase, and are there any pending special assessments or reserve-fund shortfalls?
- Any open or pending special assessments — roof, HVAC, plumbing, elevator, façade? What's the per-unit balance and payoff schedule, and is the seller paying it off at close or rolling it to the buyer?
- Is there a deadline driving the sale (1031 exchange, divorce, estate, relocation)? That informs how much negotiation room exists.
- Schools are B-rated — typically a magnet for longer-tenancy family renters. What's the average tenant stay here, and is there a school-zone premium baked into asking?
- Crime grade is F in this area — have there been break-ins, vandalism, or insurance claims at this property in the last 3 years? What carrier currently insures it and at what premium?
- The area grade is low — what's the realistic commute time and amenity access for the typical tenant pool here? Any planned neighborhood developments (good or bad) we should know about?
- What's the average days-on-market for RENTAL listings here right now (not sales)? A rising rental-DOM trend means longer vacancies and softer asking-rent achievability than the comps imply.
- What's the recent tenant-quality profile in this submarket — average credit score on applications, eviction rate, late-payment / NSF rate, and stable-employment percentage? A property-management company in the area should have these aggregated.
- How much new apartment / multifamily construction is in the pipeline within 1–3 miles? Heavy new supply (>2% of stock underway) typically softens rents 12–24 months out; light construction supports rent growth.
Investment metrics
- 1% rule
- 1.00% ✓
- Cap rate
- 3.89%
- Cash-on-cash
- -8.59%
- DSCR
- 0.62
- GRM
- 8.3
CMA / ARV
No comps found within radius.
Projected returns pro-forma
5.7% appreciation · 5.08% rent growth · sell at horizon
- IRR
- 8.8%
- Equity multiple
- 1.60×
- Total profit
- $108,406
- Equity at exit
- $396,363
- IRR
- 11.4%
- Equity multiple
- 3.31×
- Total profit
- $420,516
- Equity at exit
- $708,440
Cash invested: $182,000 (down + closing). Projections, not guarantees.
Landlord ↔ Tenant lean methodology
- Overall (CITY)
- 0 Strongly Tenant-Friendly
- State New York
- 15 Strongly Tenant-Friendly · D+10
- County
- — inherits STATE
- City New York
- 0 Strongly Tenant-Friendly · D+34
ZIP-level market 10010
- Home prices YoY
- 2.0%
- Rents YoY
- 5.1%
- Active inventory
- 232
- Price-to-rent
- 8.3×
Monthly cashflow live
- Estimated rent
- $6,524 high interval (Pro) →
- Mortgage (P&I)
- −$3,409
- Tax est. 1.5%
- −$812 /mo · $9,750/yr
- Insurance
- −$271
- HOA
- −$1,965
- Vacancy / Maint / Mgmt
- −$1,370
- Net cashflow
- $-1,303
Break-even live
UW: 25.0% down · 7.5% · 30yr · 1.5% tax · 5.0% vac · 8.0% maint · 8.0% mgmt
Financing live
Cash to close
- Down payment
- $162,500
- Closing costs
- $19,500
- Reserves months
- —
- Total cash needed
- —
Loan-product check · same deal, 3 products live
Conventional
25% down · 7.5% · 30yr
- Down + closing
- —
- Monthly P&I
- —
- Monthly cashflow
- —
- DSCR
- —
- Eligible?
- —
Personal DTI + credit; lowest rate.
DSCR
20% down · 8.5% · 30yr
- Down + closing
- —
- Monthly P&I
- —
- Monthly cashflow
- —
- DSCR
- —
- Eligible?
- —
No personal income docs; deal must DSCR.
Hard money
10% down · 12.0% · 12mo
- Down + closing
- —
- Monthly P&I
- —
- Monthly cashflow
- —
- DSCR
- —
- Eligible?
- —
Short-term bridge; refi at stabilization.
Rent comps 40 comps
| Address | Beds | Baths | Sqft | Rent | $/sqft | DOM | Units | Dist |
|---|---|---|---|---|---|---|---|---|
| 290 3rd Ave #279 New York, NY | 1.0 | 1.0 | 607 | $9,740 | $16.03 | 3d | 2 | 0.22mi |
| 250 E 21st St Unit 8D New York, NY | 1.0 | 1.0 | 688 | $9,525 | $13.84 | 2d | 1 | 0.26mi |
| 230 E 32nd St New York, NY | 2.0 | 1.0 | 800 | $5,395 | $6.74 | 16d | 2 | 0.28mi |
| 155 E 31st St #2190 New York, NY | 1.0–2.0 | 1.0–1.5 | 725 | $5,610 | $7.74 | 7d | 2 | 0.30mi |
| 222 E 34th St #999 New York, NY | 1.0 | 1.0 | 554 | $5,490 | $9.91 | 6d | 1 | 0.38mi |
| 141 E 33rd St #1278 New York, NY | 2.0 | 1.0–1.5 | 683 | $6,230 | $9.12 | 7d | 3 | 0.39mi |
| 30 Waterside Plz New York, NY | 2.0 | 1.0–2.0 | 743 | $5,218 | $7.02 | 1d | 33 | 0.40mi |
| 346 E 18th St Unit 1254596P New York, NY | 2.0 | 2.0 | 699 | $12,979 | $18.57 | 22d | 1 | 0.43mi |
| 121 Madison Ave New York, NY | 2.0–4.0 | 1.0–2.0 | 1012 | $7,295 | $7.20 | 7d | 3 | 0.43mi |
| 20 Waterside Plz #978 New York, NY | 1.0 | 1.0 | 682 | $4,760 | $6.98 | 6d | 1 | 0.43mi |
| 399 E 34th St Unit 1025362P New York, NY | 1.0 | 1.0 | 570 | $9,174 | $16.09 | 22d | 1 | 0.44mi |
| 10 E 29th St New York, NY | 1.0–3.0 | 1.0–3.0 | 1323 | $6,283 | $4.75 | 1d | 4 | 0.46mi |
| 401 E 34th St New York, NY | 3.0 | 1.0–2.0 | 887 | $5,532 | $6.23 | 1d | 55 | 0.46mi |
| 241 5th Ave Unit 11A New York, NY | 2.0 | 2.0 | 991 | $8,995 | $9.08 | 24d | 1 | 0.48mi |
| 309 5th Ave New York, NY | 1.0 | 1.0 | 597 | $7,596 | $12.72 | 7d | 13 | 0.54mi |
| 556 3rd Ave New York, NY | 1.0 | 1.0 | 580 | $5,240 | $9.03 | 19d | 2 | 0.55mi |
| 556 3rd Ave New York, NY | 1.0 | 1.0 | 540 | $5,635 | $10.44 | 1d | 2 | 0.55mi |
| 30 Park Ave #1347 New York, NY | 2.0 | 1.0 | 950 | $7,890 | $8.31 | 1d | 3 | 0.57mi |
| 41 Park Ave New York, NY | 2.0 | 1.0–2.0 | 815 | $6,555 | $8.04 | 7d | 3 | 0.59mi |
| 138 E 38th St New York, NY | 3.0 | 1.0–2.0 | 750 | $4,510 | $6.01 | 24d | 4 | 0.61mi |
| 222 E 39th St New York, NY | 1.0–4.0 | 1.0–2.0 | 1100 | $5,600 | $5.09 | 6d | 19 | 0.62mi |
| 222 E 39th St New York, NY | 4.0 | 1.0–2.0 | 1100 | $5,784 | $5.26 | 10d | 19 | 0.62mi |
| 222 E 39th St New York, NY | 1.0–4.0 | 1.0–2.0 | 1100 | $5,500 | $5.00 | 24d | 18 | 0.62mi |
| 222 E 39th St New York, NY | 1.0–4.0 | 1.0–2.0 | 1100 | $5,500 | $5.00 | 20d | 19 | 0.62mi |
| 222 E 39th St New York, NY | 1.0–4.0 | 1.0–2.0 | 1100 | $4,525 | $4.11 | 3d | 20 | 0.62mi |
| 43 W 27th St #1055 New York, NY | 2.0 | 1.0 | 740 | $9,940 | $13.43 | 24d | 1 | 0.63mi |
| 1 Union Sq S #1174 New York, NY | 2.0 | 1.0–2.0 | 775 | $10,120 | $13.06 | 10d | 3 | 0.66mi |
| 776 6th Ave New York, NY | 2.0 | 1.0–2.0 | 756 | $7,743 | $10.24 | 1d | 18 | 0.68mi |
| 209 1st Ave Unit 1370708P New York, NY | 1.0 | 1.0 | 602 | $12,000 | $19.93 | 24d | 1 | 0.68mi |
| 117 W 28th St #1467 New York, NY | 1.0 | 2.0 | 1000 | $8,760 | $8.76 | 24d | 1 | 0.75mi |
| 120 W 23rd St #693 New York, NY | 2.0 | 2.0 | 900 | $10,140 | $11.27 | 20d | 1 | 0.75mi |
| 166 2nd Ave Unit 9KK New York, NY | 2.0 | 1.5 | 950 | $8,100 | $8.53 | 7d | 1 | 0.77mi |
| 101 E 10th St #1153 New York, NY | 1.0–2.0 | 1.0–2.0 | 575 | $6,740 | $11.72 | 1d | 2 | 0.78mi |
| 120 W 21st St New York, NY | 2.0 | 1.0–2.0 | 676 | $7,070 | $10.46 | 4d | 14 | 0.79mi |
| 112 E 10th St Unit 1021937P New York, NY | 1.0–3.0 | 1.0–2.5 | 1296 | $5,772 | $4.45 | 3d | 2 | 0.80mi |
| 160 W 24th St New York, NY | 2.0 | 1.0–2.0 | 731 | $7,896 | $10.79 | 1d | 12 | 0.84mi |
| 101 W 15th St New York, NY | 1.0 | 1.0 | 562 | $9,550 | $16.98 | 1d | 2 | 0.87mi |
| 540 6th Ave Unit 6A New York, NY | 1.0 | 1.0 | 793 | $8,450 | $10.66 | 7d | 1 | 0.88mi |
| 230 E 44th St #2165 New York, NY | 1.0–2.0 | 1.0 | 568 | $3,150 | $5.54 | 24d | 2 | 0.88mi |
| 180 W 20th St #1202 New York, NY | 2.0 | 1.0–2.0 | 791 | $9,505 | $12.01 | 1d | 3 | 0.89mi |
HOA detail condo
- Monthly dues
- $1,965 · $23,580/yr
- Assessments
- None detected in remarks — confirm with the listing agent.
Listing history 14 events
-
2026-06-18days on market $650,000 Active 30 DOM
-
2026-06-17days on market $650,000 Active 29 DOM
-
2026-06-16days on market $650,000 Active 28 DOM
-
2026-06-15days on market $650,000 Active 27 DOM
-
2026-06-13pricedays on market $650,000 Active 25 DOM
-
2026-06-10days on market $695,000 Active 21 DOM
-
2026-06-08days on market $695,000 Active 20 DOM
-
2026-06-08days on market $695,000 Active 19 DOM
-
2026-06-04days on market $695,000 Active 16 DOM
-
2026-06-03days on market $695,000 Active 15 DOM
-
2026-06-02days on market $695,000 Active 14 DOM
-
2026-06-01days on market $695,000 Active 13 DOM
-
2026-05-31days on market $695,000 Active 12 DOM
-
2026-05-19$695,000 Active
ⓘ Source: listings_history table (triggers on properties + properties_extension) + one-shot
backfill from property_details.listing_events for pre-trigger history.
Climate risk First Street
- Flood 1/10 Low FEMA zone X (unshaded) · 0% chance over 30 yrs
- Wildfire 1/10 Low
- Heat 6/10 Major 7 d/yr ≥99°F today · 15 d/yr by 30 yrs out
- Wind 6/10 Major 27% chance of damaging wind over 30 yrs
- Air quality 4/10 Moderate 5 unhealthy d/yr today · 7 by 30 yrs out
Nearby sold comps map
Loading sold comps map…
Walkable amenities ~0.75 mi
Loading nearby amenities…
Taxation est. · year 1
- Rental income
- $78,289
- − Mortgage interest
- −$36,410
- − Property taxes
- −$9,750
- − Insurance
- −$3,250
- − Repairs & maintenance
- −$6,263
- − Management
- −$6,263
- − HOA
- −$23,580
- − Depreciation
- −$18,909
- Taxable loss
- −$26,137
- Est. tax savings @ 24.0%
- +$6,273
- After-tax cash flow
- $-9,363/yr
For passive investors: Depreciation is non-cash, so a rental often shows a tax loss while cash-flowing — sheltering income. Rental losses are passive: they offset passive income freely, and up to $25,000/yr can offset ordinary (W-2) income if you actively participate and your MAGI is under $100k (phasing out to $0 by $150k); unused losses carry forward. On sale, claimed depreciation is recaptured at up to 25%, and gains may owe capital-gains tax (a 1031 exchange can defer both). Figures are a year-1 estimate at your 24.0% rate — not tax advice; consult a CPA.
Condition & rehab AI · 12 photos
This corner one-bedroom is in good condition with fresh paint and hardwood floors, offering a great opportunity to create a dream home with minimal work.
Value-add opportunities
- Resale kitchen backsplash — modernizes the space
- Resale bathroom fixtures — updates the space
- Both kitchen appliances — improves functionality and appeal
- Both landscaping — enhances curb appeal and resale value
Renovation cost estimate screening
Value-add ROI direction
- Resale kitchen backsplash — modernizes the space ↑
- Resale bathroom fixtures — updates the space ↑
- Both kitchen appliances — improves functionality and appeal ↑
- Both landscaping — enhances curb appeal and resale value ↑
ⓘ Cost ranges are severity-bucket heuristics (US national rule-of-thumb). Get contractor quotes + a written scope before underwriting a rehab budget.
Schools (NCES district)
No district data.
Livability — New York
- Score
- 75/100
- State rank
- #268
- US rank
- #4188
Category grades
Schools grade is shown separately in the Schools card above.
Census & demographics
- Census place
- New York, NY
- County
- New York County · 1,599,927 people
- City population
- 7,731,280
- Metro
- New York-Newark-Jersey City, NY-NJ-PA
- Population (ZIP)
- 30,702
- Household income
- $144,969
- Rent vs Own
- Severe rent burden
- 2470.0
Population outlook (New York County) Hauer SSP2
- Today (2025)
- 1,825,725 people
- By 2030
- 1,904,611 · +4.3%
- By 2040
- 2,052,719 · +12.4%
- By 2050
- 2,206,601 · +20.9%
- By 2075
- 2,509,427 · +37.4%
- By 2100
- 2,702,933 · +48.0%
Race, ethnicity, and origin ACS 2023
- Neighborhood character
- Diverse neighborhood (Simpson 0.57)
- Race & ethnicity
- White 63% Asian 14% Black 9% Two or more races 9% Hispanic / Latino 8%
- Hispanic origin (detail)
- Mexican 1% Puerto Rican 2%
- Common ancestry
- Romanian 5% Italian 3% Scotch-Irish 2%
- Foreign-born
- 21% · Canada, China, South Korea
- Languages at home
- 80% English-only · Spanish 4% Chinese 4% Other Indo-European 3%
Political lean MEDSL · New York
- 2024 margin
- Solid D (+64.8) · D 82.4% · R 17.6%
- 2008→2024 swing
- -7.4pp toward R · 2008: 72.2pp · 2024: 64.8pp
- All cycles
- 2024: D+64.8 2020: D+74.5 2016: D+77.2 2012: D+69.6 2008: D+72.2
Not yet ingested
- Civics
- —
Market trends
- HPI YoY
- ▲ 5.70%
- Current HPI
- 293.8611
- Rent YoY
- ▲ 5.08%
- Metro
- New York-Newark-Jersey City, NY-NJ-PA
- State GDP YoY
- ▲ 2.60%
- F500 in state
- 92
Industry mix (Fortune 500 HQ in NY)
| Industry | F500 HQs | Revenue |
|---|---|---|
| Financial Services | 10 | $950B |
|
||
| Consumer Goods | 9 | $162B |
|
||
| Insurance | 4 | $225B |
|
||
| Telecommunications | 2 | $144B |
|
||
| Pharmaceuticals | 2 | $112B |
|
||
| Media / Entertainment | 2 | $69B |
|
||
Price history
1 event — show timeline
- 2026-05-19 Listed $695,000 RLS at REBNY
Cash-flow waterfall
monthlySold comps — $/sqft
last 12 mo · ≤1 miLoading sold comps…