42 Pine St Unit 3B · Yonkers, NY
Flood risk 1/10 · Minimal
- FEMA flood zone
- X (unshaded)
- Chance of flooding over 30 yrs
- 0.0%
- Est. flood insurance / yr
- $473 – $860
Fire risk 1/10 · Minimal
- Est. fire insurance / yr
- $691 – $1,283
Heat risk 6/10 · Moderate
- Hot days now (above 101°F)
- 7 days/yr
- Hot days in 30 yrs
- 15 days/yr
Wind risk 6/10 · Moderate
- Chance of severe wind over 30 yrs
- 27.0%
Air-quality risk 3/10 · Minor
- Unhealthy air days now
- 3 days/yr
- Unhealthy air days in 30 yrs
- 4 days/yr
Risk factors via First Street. Map © Google.
Why this score? — see what drove the C+ grade
The composite is a weighted blend of 9 inputs, each scored 0–100. Each bar is that input's sub-score; the figure is the points it added to the 100-point composite (weight × sub-score).
- Cash flow +25.6/30.0
- DSCR +8.5/10.0
- ARV discount +7.5/15.0
- 1% rule +6.8/10.0
- Schools +4.1/10.0
- Rent growth +3.6/5.0
- Livability +3.4/5.0
- Condition / age +2.5/5.0
- Appreciation +0.0/10.0
$230,000
🖨 Deal sheet 📄 Offer letter ✓ Due diligence
Listing remarks
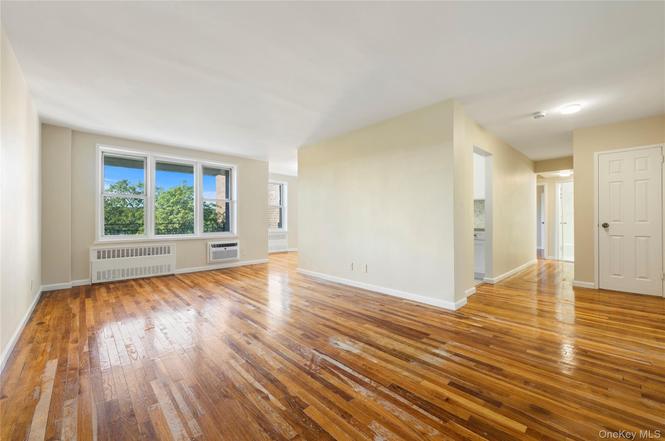
Welcome to Residence 3B at 42 Pine Street, a fully renovated two-bedroom cooperative offering bright and spacious living in a well-maintained building in Yonkers. This thoughtfully designed home features a comfortable layout with a large living area suited for both everyday living and entertaining. Large windows bring in natural light and offer pleasant views of the Hudson River and surrounding greenery. The apartment has been renovated and features a modern kitchen with new appliances, premium countertops, updated cabinetry, and contemporary finishes, creating a clean, functional cooking space. The kitchen flows naturally into the dining area, making it practical for daily use as well as h
Key facts
- Fully renovated
- Large living area
- Walk-in closet
Tags
Neighborhood map
What this means for you Summary
Snapshot
- This is a 2-bed/1.0-bath condo listed at $230k.
Deal economics
- At list price, monthly cash flow is $546 ($7k/yr) — positive.
- The deal already cash-flows at list — no discount required.
- Meets the 1% rule at list price ($3k rent vs $230k).
- Cap rate 9.1% vs local median 5.3% in Yonkers — top-decile yield for the area; either an underpriced asset or a hidden risk that comps aren't pricing in. Stress-test before assuming the spread holds.
Location & tenants
- Location reads 68/100 on livability (#528 in NY) — a middle-class / working-renter tenant base. Strengths: employment A, commute B; Watch: amenities F, cost of living F.
- Yonkers City School District (suburban): math 41% / reading 54% proficiency, ranked #413 of 590 in NY (top 70%) — families likely to look elsewhere, expect single-tenant / working-renter base with shorter leases; 64% free/reduced lunch — lower-income household profile, screen leases tightly.
- Zoned schools: Yonkers Early Childhood Academy (327 students, 72% FRL); Yonkers Middle School (math 17% / reading 37%, grade F, #587 of 729 statewide, top 81%, 601 students, 88% FRL); Yonkers High School (math 92% / reading 88%, grade A+, #238 of 1,100 statewide, top 23%, 1,060 students, 76% FRL) — zoned schools average 79% FRL vs 64% district-wide (15 pts higher); higher-poverty schools than district average — tighter screening recommended.
- Market conditions: Rents rising fast (+4.4%/yr); 183 active listings in the ZIP; 40 comparable units currently listed for rent nearby; rentals at typical pace (median 25d on market — plan ~3-4 weeks tenant-placement turnaround); 42% of comp listings sitting > 30 days — soft ceiling on asking rent; 954 units permitted in Westchester County in 2024 (649 in 5+ unit buildings).
- At $2,703/mo this rent would consume 50% of the median local household income ($65k/yr) (locally 6045% of renters already pay >50% of income on rent) — very limited rent-growth headroom before tenants either downsize or default.
Forward outlook
- Local home prices are declining (-3.0%/yr); year-one equity from $2k of loan paydown is wiped out by about $7k of value loss. Plan a longer hold.
- Westchester County population projected at +10% by 2050 — modest demand growth; plan on rents tracking national, not racing it.
- At projected returns (-3.0% appreciation + 4.4% rent growth), your $64k cash investment doubles in ~10 years — after that, you're playing with house money.
Negotiation context
- Only 5 days on market — expect competitive offers; lowballing is unlikely to land.
Risks & watch-outs
- Climate carrying-cost: major wind risk, 27% chance of damaging wind over 30y; extreme-heat days projected 7→15/yr by 2055 (HVAC capex compounding) — expect insurance premiums to compound above CPI over the hold.
Questions for the listing agent
- Built in 1960 — when were the roof, HVAC, electrical panel, plumbing, and water heater last replaced?
- Any open or pending special assessments — roof, HVAC, plumbing, elevator, façade? What's the per-unit balance and payoff schedule, and is the seller paying it off at close or rolling it to the buyer?
- Is there a deadline driving the sale (1031 exchange, divorce, estate, relocation)? That informs how much negotiation room exists.
- What's the average days-on-market for RENTAL listings here right now (not sales)? A rising rental-DOM trend means longer vacancies and softer asking-rent achievability than the comps imply.
- What's the recent tenant-quality profile in this submarket — average credit score on applications, eviction rate, late-payment / NSF rate, and stable-employment percentage? A property-management company in the area should have these aggregated.
- How much new apartment / multifamily construction is in the pipeline within 1–3 miles? Heavy new supply (>2% of stock underway) typically softens rents 12–24 months out; light construction supports rent growth.
Investment metrics
- 1% rule
- 1.18% ✓
- Cap rate
- 9.14%
- Cash-on-cash
- 10.18%
- DSCR
- 1.45
- GRM
- 7.1
CMA / ARV
No comps found within radius.
Projected returns pro-forma
-3.0% appreciation · 4.39% rent growth · sell at horizon
- IRR
- 0.6%
- Equity multiple
- 1.02×
- Total profit
- $1,385
- Equity at exit
- $34,294
- IRR
- 11.6%
- Equity multiple
- 1.97×
- Total profit
- $62,339
- Equity at exit
- $19,886
Cash invested: $64,400 (down + closing). Projections, not guarantees.
Landlord ↔ Tenant lean methodology
- Overall (CITY)
- 5 Strongly Tenant-Friendly
- State New York
- 15 Strongly Tenant-Friendly · D+10
- County
- — inherits STATE
- City Yonkers
- 5 Strongly Tenant-Friendly · D+20
ZIP-level market 10701
- Rents YoY
- 4.4%
- Active inventory
- 183
- Price-to-rent
- 7.1×
Monthly cashflow live
- Estimated rent
- $2,703 high interval (Pro) →
- Mortgage (P&I)
- −$1,206
- Tax est. 1.5%
- −$288 /mo · $3,450/yr
- Insurance
- −$96
- HOA
- −$0
- Vacancy / Maint / Mgmt
- −$568
- Net cashflow
- $546
Break-even live
UW: 25.0% down · 7.5% · 30yr · 1.5% tax · 5.0% vac · 8.0% maint · 8.0% mgmt
Financing live
Cash to close
- Down payment
- $57,500
- Closing costs
- $6,900
- Reserves months
- —
- Total cash needed
- —
Loan-product check · same deal, 3 products live
Conventional
25% down · 7.5% · 30yr
- Down + closing
- —
- Monthly P&I
- —
- Monthly cashflow
- —
- DSCR
- —
- Eligible?
- —
Personal DTI + credit; lowest rate.
DSCR
20% down · 8.5% · 30yr
- Down + closing
- —
- Monthly P&I
- —
- Monthly cashflow
- —
- DSCR
- —
- Eligible?
- —
No personal income docs; deal must DSCR.
Hard money
10% down · 12.0% · 12mo
- Down + closing
- —
- Monthly P&I
- —
- Monthly cashflow
- —
- DSCR
- —
- Eligible?
- —
Short-term bridge; refi at stabilization.
Rent comps 40 comps
| Address | Beds | Baths | Sqft | Rent | $/sqft | DOM | Units | Dist |
|---|---|---|---|---|---|---|---|---|
| 59 Glenwood Ave Unit 1FF Yonkers, NY | 2.0 | 1.0 | 700 | $2,375 | $3.39 | 43d | 1 | 0.18mi |
| 150 Glenwood Ave Apt G1 Yonkers, NY | 1.0 | 1.0 | 850 | $2,000 | $2.35 | 43d | 1 | 0.18mi |
| 369 Warburton Ave Unit 2B Yonkers, NY | 2.0 | 1.0 | 930 | $2,650 | $2.85 | 43d | 1 | 0.19mi |
| 369 Warburton Ave Unit 4A Yonkers, NY | 3.0 | 1.0 | 950 | $3,500 | $3.68 | 43d | 1 | 0.19mi |
| 250 N Broadway Unit 2E Yonkers, NY | 2.0 | 1.0 | 950 | $2,400 | $2.53 | 24d | 1 | 0.22mi |
| 154 Woodworth Ave Yonkers, NY | 1.0 | 1.0 | 650 | $2,500 | $3.85 | 43d | 1 | 0.30mi |
| 154 Woodworth Ave Yonkers, NY | 2.0 | 1.0 | 650 | $2,350 | $3.62 | 17d | 1 | 0.30mi |
| 55 Riverside Dr Yonkers, NY | 3.0 | 1.0–2.0 | 819 | $3,891 | $4.75 | 2d | 13 | 0.38mi |
| 137 Lake Ave Unit 3W Yonkers, NY | 1.0 | 1.0 | 650 | $1,700 | $2.62 | 18d | 1 | 0.46mi |
| 155 Lake Ave Yonkers, NY | 3.0 | 1.0 | 1000 | $3,200 | $3.20 | 16d | 1 | 0.49mi |
| 4 Ritters Ln Unit 1FL Yonkers, NY | 3.0 | 1.0 | 1100 | $3,300 | $3.00 | 43d | 1 | 0.53mi |
| 79 Alexander St Yonkers, NY | 3.0 | 1.0–2.5 | 997 | $3,532 | $3.54 | 2d | 1 | 0.54mi |
| 57 Alexander St Yonkers, NY | 2.0 | 1.0–2.0 | 765 | $3,690 | $4.82 | 2d | 21 | 0.59mi |
| 30 Locust Hill Ave Yonkers, NY | 1.0–2.0 | 1.0 | 735 | $2,500 | $3.40 | 7d | 2 | 0.71mi |
| 30 Locust Hill Ave Yonkers, NY | 1.0–2.0 | 1.0 | 735 | $2,500 | $3.40 | 43d | 3 | 0.71mi |
| 596 Warburton Ave Yonkers, NY | 1.0 | 1.0 | 650 | $1,800 | $2.77 | 24d | 1 | 0.72mi |
| 1 Alexander St Yonkers, NY | 2.0 | 1.0–2.0 | 837 | $4,000 | $4.78 | 7d | 48 | 0.76mi |
| 703 Nepperhan Ave Unit 2 Yonkers, NY | 2.0 | 1.0 | 850 | $2,450 | $2.88 | 43d | 1 | 0.79mi |
| 23 N Broadway Unit 4F Yonkers, NY | 2.0 | 1.0 | 699 | $2,400 | $3.43 | 22d | 1 | 0.80mi |
| 50 Nepperhan St Yonkers, NY | 3.0 | 1.0–2.0 | 887 | $4,063 | $4.58 | 1d | 20 | 0.80mi |
| 91 Elm St Unit 1A Yonkers, NY | 1.0 | 1.0 | 650 | $1,800 | $2.77 | 16d | 1 | 0.80mi |
| 91 Elm St Unit 1A Yonkers, NY | 1.0 | 1.0 | 650 | $1,900 | $2.92 | 43d | 1 | 0.80mi |
| 237 Woodland Ave Unit 2 Yonkers, NY | 2.0 | 1.0 | 970 | $2,600 | $2.68 | 43d | 1 | 0.81mi |
| 45 Linden St Yonkers, NY | 3.0 | 3.0 | 800 | $3,100 | $3.88 | 4d | 1 | 0.82mi |
| 20 Porach St Unit 2A Yonkers, NY | 1.0 | 1.0 | 550 | $2,200 | $4.00 | 43d | 1 | 0.85mi |
| 20 Porach St Apt -1B Yonkers, NY | 2.0 | 1.0 | 750 | $2,400 | $3.20 | 43d | 1 | 0.85mi |
| 160 Amackassin Ter Yonkers, NY | 1.0 | 1.0 | 600 | $1,500 | $2.50 | 43d | 1 | 0.86mi |
| 50 Main St Unit 3F Yonkers, NY | 1.0 | 1.0 | 900 | $2,000 | $2.22 | 24d | 1 | 0.86mi |
| 66 Main St Yonkers, NY | 2.0 | 1.0–2.0 | 906 | $3,323 | $3.67 | 3d | 4 | 0.87mi |
| 39 Victor St Unit 2 Yonkers, NY | 3.0 | 1.0 | 900 | $2,650 | $2.94 | 43d | 1 | 0.90mi |
| 44 Hudson St Yonkers, NY | 2.0 | 1.0–2.0 | 922 | $4,300 | $4.66 | 7d | 25 | 0.92mi |
| 703 Palisade Ave Unit Third Floor Yonkers, NY | 2.0 | 1.0 | 900 | $2,000 | $2.22 | 3d | 1 | 0.93mi |
| 97 Waverly St Unit 3R Yonkers, NY | 1.0 | 1.0 | 600 | $1,850 | $3.08 | 15d | 1 | 0.94mi |
| 189 Elm St Unit 1 Yonkers, NY | 3.0 | 1.0 | 1000 | $2,650 | $2.65 | 43d | 1 | 0.97mi |
| 348 Saw Mill River Rd Unit 2 Yonkers, NY | 3.0 | 1.0 | 900 | $3,200 | $3.56 | 24d | 1 | 1.00mi |
| 737 Warburton Ave Unit 1L Yonkers, NY | 1.0 | 1.0 | 900 | $2,100 | $2.33 | 43d | 1 | 1.05mi |
| 23 Colin St Yonkers, NY | 2.0 | 1.0 | 750 | $2,500 | $3.33 | 15d | 1 | 1.07mi |
| 20 Water Grant St Yonkers, NY | 1.0–2.0 | 1.0–2.0 | 827 | $3,756 | $4.54 | 1d | 22 | 1.11mi |
| 158 Willow St Unit 1B Yonkers, NY | 2.0 | 1.0 | 600 | $2,100 | $3.50 | 1d | 1 | 1.12mi |
| 103 Burhans Ave Yonkers, NY | 2.0 | 1.0 | 894 | $2,000 | $2.24 | 43d | 1 | 1.13mi |
HOA detail condo
- Monthly dues
- $0 · $0/yr
- Assessments
- None detected in remarks — confirm with the listing agent.
Listing history 2 events
-
2026-04-09status Pending
-
2026-03-13$230,000 Active
ⓘ Source: listings_history table (triggers on properties + properties_extension) + one-shot
backfill from property_details.listing_events for pre-trigger history.
Climate risk First Street
- Flood 1/10 Low FEMA zone X (unshaded) · 0% chance over 30 yrs
- Wildfire 1/10 Low
- Heat 6/10 Major 7 d/yr ≥101°F today · 15 d/yr by 30 yrs out
- Wind 6/10 Major 27% chance of damaging wind over 30 yrs
- Air quality 3/10 Moderate 3 unhealthy d/yr today · 4 by 30 yrs out
Nearby sold comps map
Loading sold comps map…
Walkable amenities ~0.75 mi
Loading nearby amenities…
Taxation est. · year 1
- Rental income
- $32,439
- − Mortgage interest
- −$12,884
- − Property taxes
- −$3,450
- − Insurance
- −$1,150
- − Repairs & maintenance
- −$2,595
- − Management
- −$2,595
- − Depreciation
- −$6,691
- Taxable income
- $3,074
- Est. tax owed @ 24.0%
- −$738
- After-tax cash flow
- $5,815/yr
For passive investors: Depreciation is non-cash, so a rental often shows a tax loss while cash-flowing — sheltering income. Rental losses are passive: they offset passive income freely, and up to $25,000/yr can offset ordinary (W-2) income if you actively participate and your MAGI is under $100k (phasing out to $0 by $150k); unused losses carry forward. On sale, claimed depreciation is recaptured at up to 25%, and gains may owe capital-gains tax (a 1031 exchange can defer both). Figures are a year-1 estimate at your 24.0% rate — not tax advice; consult a CPA.
Schools (NCES district)
- District
- Yonkers City School District
- NCES district ID
- 3631920
- Math proficiency
- 41% ▼ -1.00%
- Reading proficiency
- 54% ▲ 14.00%
- Median HH income
- $58,042
- Composite
- 41.43/100
- National rank
- #3471
- State rank
- #413 of 590 in NY
Livability — Yonkers
- Score
- 68/100
- State rank
- #528
- US rank
- #9394
Category grades
Schools grade is shown separately in the Schools card above.
Census & demographics
- Census place
- Yonkers, NY
- County
- Westchester County · 709,332 people
- City population
- 212,407
- Metro
- New York-Newark-Jersey City, NY-NJ-PA
- Population (ZIP)
- 70,676
- Household income
- $64,776
- Rent vs Own
- Severe rent burden
- 6045.0
Population outlook (Westchester County) Hauer SSP2
- Today (2025)
- 1,028,035 people
- By 2030
- 1,051,636 · +2.3%
- By 2040
- 1,098,520 · +6.9%
- By 2050
- 1,136,044 · +10.5%
- By 2075
- 1,196,925 · +16.4%
- By 2100
- 1,175,147 · +14.3%
Race, ethnicity, and origin ACS 2023
- Neighborhood character
- Diverse neighborhood (Simpson 0.65)
- Race & ethnicity
- Hispanic / Latino 52% White 21% Black 21% Two or more races 18% Asian 3% Native American 1%
- Hispanic origin (detail)
- Mexican 11% Puerto Rican 9% Dominican 19%
- Common ancestry
- Romanian 1% Russian 1% Subsaharan African 1%
- Foreign-born
- 35% · Canada, Jamaica, South Korea
- Languages at home
- 45% English-only · Spanish 42% Other Indo-European 3% Arabic 2%
Political lean MEDSL · Westchester
- 2024 margin
- Strong D (+26.3) · D 63.1% · R 36.9%
- 2008→2024 swing
- -1.3pp toward R · 2008: 27.6pp · 2024: 26.3pp
- All cycles
- 2024: D+26.3 2020: D+36.3 2016: D+32.8 2012: D+22.2 2008: D+27.6
Not yet ingested
- Civics
- —
Market trends
- HPI YoY
- ▼ -373.14%
- Current HPI
- 332.0999
- Rent YoY
- ▲ 4.39%
- Metro
- New York-Newark-Jersey City, NY-NJ-PA
- State GDP YoY
- ▲ 2.60%
- F500 in state
- 92
Industry mix (Fortune 500 HQ in NY)
| Industry | F500 HQs | Revenue |
|---|---|---|
| Financial Services | 10 | $950B |
|
||
| Consumer Goods | 9 | $162B |
|
||
| Insurance | 4 | $225B |
|
||
| Telecommunications | 2 | $144B |
|
||
| Pharmaceuticals | 2 | $112B |
|
||
| Media / Entertainment | 2 | $69B |
|
||
Price history
2 events — show timeline
- 2026-04-09 Pending — OneKey® MLS as Distributed by MLS Grid
- 2026-03-13 Listed $230,000 OneKey® MLS as Distributed by MLS Grid
Cash-flow waterfall
monthlySold comps — $/sqft
last 12 mo · ≤1 miLoading sold comps…