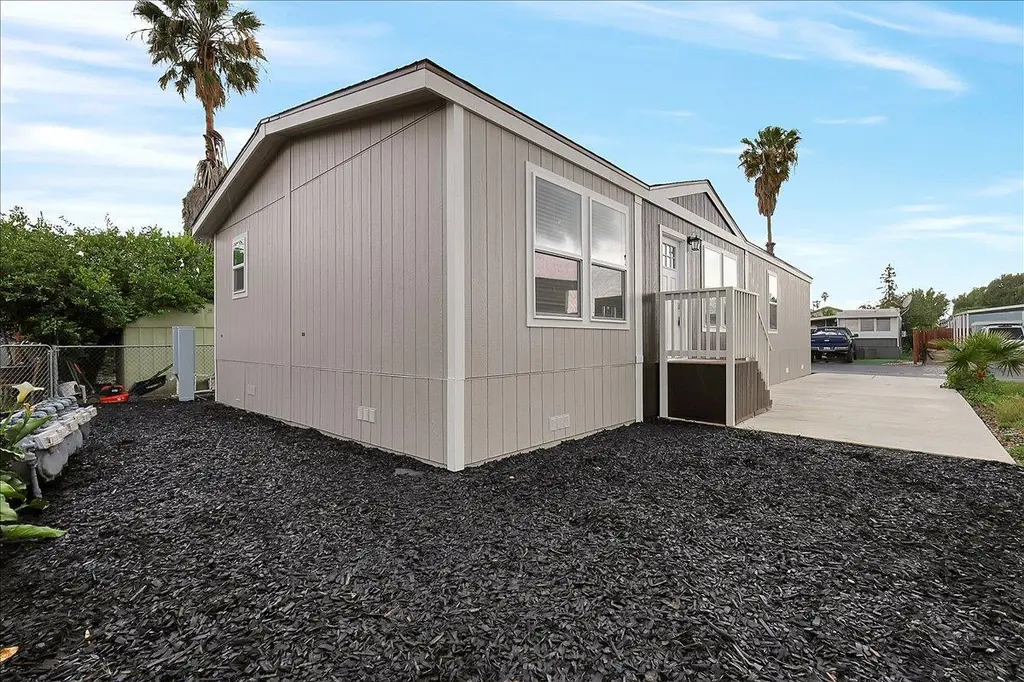
907 Bourn Dr #99 · Woodland, CA
Flood risk 4/10 · Minor
- FEMA flood zone
- X (unshaded)
- Chance of flooding over 30 yrs
- 0.2%
- Est. flood insurance / yr
- $507 – $1,088
Fire risk 5/10 · Moderate
- Est. fire insurance / yr
- $659 – $1,223
Heat risk 7/10 · Major
- Hot days now (above 104°F)
- 7 days/yr
- Hot days in 30 yrs
- 14 days/yr
Wind risk 1/10 · Minimal
- Chance of severe wind over 30 yrs
- —
Air-quality risk 10/10 · Severe
- Unhealthy air days now
- 28 days/yr
- Unhealthy air days in 30 yrs
- 29 days/yr
Risk factors via First Street. Map © Google.
Why this score? — see what drove the C grade
The composite is a weighted blend of 9 inputs, each scored 0–100. Each bar is that input's sub-score; the figure is the points it added to the 100-point composite (weight × sub-score).
- Cash flow +26.4/30.0
- DSCR +9.0/10.0
- 1% rule +7.1/10.0
- Condition / age +4.8/5.0
- Schools +4.0/10.0
- Rent growth +3.9/5.0
- Livability +3.4/5.0
- ARV discount +0.0/15.0
- Appreciation +0.0/10.0
$269,950
🖨 Deal sheet 📄 Offer letter ✓ Due diligence
Listing remarks
Welcome to this brand new 2025 Clayton Tempo Series double wide located in the Idle Wheel Mobile Home Community with affordable space rent of only $995 per month. This spacious open concept floor plan offers 4 bedrooms and 2 bathrooms designed for comfortable everyday living and entertaining. The modern kitchen and living room combo features stainless steel appliances, a hood over the range, stylish light fixtures, recessed lighting throughout, a large kitchen island, and an abundance of cabinets for storage. The primary suite offers a walk in closet and a private ensuite bathroom complete with double sinks and a shower stall. Additional highlights include an indoor utility room with washer
Key facts
- Large kitchen island
- Walk in closet
- Modern kitchen
Tags
Property features AI
Finance
- Other: Lot features: None
- Financial info: Land lease: No
- HOA & community: No homeowners association; Not a senior community
Exterior
- Parking: Assigned parking
- Utilities: Electric: Other; Public water; Public sewer
- Home design: Manufactured in-park, double wide; Clayton (CMH Manufacturing West Inc.) make; Wood skirting; Built in 2025
- Construction: Composition roof; Wood skirting
- Exterior features: Composition roof
Interior
- Kitchen: Free-standing gas range; Free-standing gas oven; Free-standing refrigerator; Range hood; Dishwasher
- Bedrooms: 4 bedrooms
- Flooring: Carpet; Linoleum
- Bathrooms: 2 full bathrooms; Bathtub with shower over
- Heating & cooling: Central heating; No cooling
- Interior features: Great room living area; Synthetic kitchen counters; Pets allowed with limits
- Laundry & utility: Indoor laundry area/room
Neighborhood map
What this means for you Summary
Snapshot
- This is a 4-bed/2.0-bath manufactured listed at $270k. Condition is rated excellent.
Deal economics
- At list price, monthly cash flow is $705 ($8k/yr) — positive.
- The deal already cash-flows at list — no discount required.
- Meets the 1% rule at list price ($3k rent vs $270k).
- Recommended offer: $262k (3.0% below list) — sets the bar for market timing.
- Cap rate 9.4% vs local median 3.4% in Woodland — top-decile yield for the area; either an underpriced asset or a hidden risk that comps aren't pricing in. Stress-test before assuming the spread holds.
Location & tenants
- Location reads 67/100 on livability (#314 in CA) — a middle-class / working-renter tenant base. Strengths: employment A, housing A; Watch: amenities C-, schools F, cost of living F.
- Woodland Joint Unified (suburban): math 34% / reading 58% proficiency, ranked #171 of 517 in CA (top 33%) — families likely to look elsewhere, expect single-tenant / working-renter base with shorter leases.
- Market conditions: Rents rising fast (+5.4%/yr); 96 active listings in the ZIP; 4 comparable units currently listed for rent nearby; rentals at typical pace (median 18d on market — plan ~3-4 weeks tenant-placement turnaround); solid renter incomes; 721 units permitted in Yolo County in 2024 (260 in 5+ unit buildings).
- This rent runs 37% of the median local income ($107k/yr) — at the standard rent-burdened threshold; future hikes will face affordability resistance.
Forward outlook
- Local home prices are declining (-3.0%/yr); year-one equity from $2k of loan paydown is wiped out by about $8k of value loss. Plan a longer hold.
- Yolo County population projected at +31% by 2050 — long-run rental-demand tailwind backs the buy-and-hold thesis.
- At projected returns (-3.0% appreciation + 5.4% rent growth), your $76k cash investment doubles in ~8 years — after that, you're playing with house money.
Negotiation context
- It's been on market 37 days — a 3% lower offer ($262k) is reasonable based on typical stale-listing flexibility.
Risks & watch-outs
- Climate carrying-cost: moderate wildfire risk; extreme-heat days projected 7→14/yr by 2055 (HVAC capex compounding) — expect insurance premiums to compound above CPI over the hold.
Questions for the listing agent
- It's been on market 37 days. Have you received any prior offers? Is the seller open to a 3% concession, seller financing, or rate buy-down credit?
- Is there a deadline driving the sale (1031 exchange, divorce, estate, relocation)? That informs how much negotiation room exists.
- Schools are F-rated, which usually means shorter tenancies and higher turnover. Who's the typical renter profile here, and what's been the actual vacancy rate?
- What's the average days-on-market for RENTAL listings here right now (not sales)? A rising rental-DOM trend means longer vacancies and softer asking-rent achievability than the comps imply.
- What's the recent tenant-quality profile in this submarket — average credit score on applications, eviction rate, late-payment / NSF rate, and stable-employment percentage? A property-management company in the area should have these aggregated.
- How much new for-sale + rental construction is in the pipeline within 1–3 miles? Heavy new supply typically softens prices + rents 12–24 months out; constrained supply supports both.
Investment metrics
- 1% rule
- 1.21% ✓
- Cap rate
- 9.43%
- Cash-on-cash
- 11.19%
- DSCR
- 1.50
- GRM
- 6.9
CMA / ARV
- ARV (median comp)
- $197,000
- List price
- $269,950
- Delta
- 37.03%
- Verdict
- OVERPRICED
- Comps
- 5 within 2.0 mi
Show comp detail 1 sale within ~0.75 mi
| Address | Dist | Beds/Ba | Sqft | Sold | Price | $/sf | Match |
|---|---|---|---|---|---|---|---|
| 907 Bourn Dr #3 | 0.16mi | 3/2.0 (-1) | 1,248 (-6%) | 16mo | $230,000 | $184 | 64 |
Match score weights: distance 35% · size 25% · config 20% · recency 20%. Top-matched comps best support the ARV.
Projected returns pro-forma
-3.0% appreciation · 5.4% rent growth · sell at horizon
- IRR
- 3.1%
- Equity multiple
- 1.12×
- Total profit
- $9,260
- Equity at exit
- $40,250
- IRR
- 14.8%
- Equity multiple
- 2.33×
- Total profit
- $100,770
- Equity at exit
- $23,340
Cash invested: $75,586 (down + closing). Projections, not guarantees.
Landlord ↔ Tenant lean methodology
- Overall (STATE)
- 18 Strongly Tenant-Friendly
- State California
- 18 Strongly Tenant-Friendly · D+13
- County
- — inherits STATE
- City
- — inherits STATE
ZIP-level market 95776
- Home prices YoY
- -30.2%
- Rents YoY
- 5.4%
- Active inventory
- 96
- Price-to-rent
- 6.9×
Monthly cashflow live
- Estimated rent
- $3,254 medium interval (Pro) →
- Mortgage (P&I)
- −$1,416
- Tax est. 1.5%
- −$337 /mo · $4,049/yr
- Insurance
- −$112
- HOA
- −$0
- Vacancy / Maint / Mgmt
- −$683
- Net cashflow
- $705
Break-even live
UW: 25.0% down · 7.5% · 30yr · 1.5% tax · 5.0% vac · 8.0% maint · 8.0% mgmt
Financing live
Cash to close
- Down payment
- $67,488
- Closing costs
- $8,098
- Reserves months
- —
- Total cash needed
- —
Loan-product check · same deal, 3 products live
Conventional
25% down · 7.5% · 30yr
- Down + closing
- —
- Monthly P&I
- —
- Monthly cashflow
- —
- DSCR
- —
- Eligible?
- —
Personal DTI + credit; lowest rate.
DSCR
20% down · 8.5% · 30yr
- Down + closing
- —
- Monthly P&I
- —
- Monthly cashflow
- —
- DSCR
- —
- Eligible?
- —
No personal income docs; deal must DSCR.
Hard money
10% down · 12.0% · 12mo
- Down + closing
- —
- Monthly P&I
- —
- Monthly cashflow
- —
- DSCR
- —
- Eligible?
- —
Short-term bridge; refi at stabilization.
Rent comps 4 comps
| Address | Beds | Baths | Sqft | Rent | $/sqft | DOM | Units | Dist |
|---|---|---|---|---|---|---|---|---|
| 1080 Barnes Cir Woodland, CA | 3.0 | 2.0 | 1242 | $2,700 | $2.17 | 4d | 1 | 0.17mi |
| 1455 Hoover Ct Woodland, CA | 3.0 | 2.0 | 1100 | $2,700 | $2.45 | 17d | 1 | 0.74mi |
| 2123 Sieber Dr Woodland, CA | 4.0 | 2.5 | 1760 | $2,900 | $1.65 | 14d | 1 | 1.50mi |
| 2123 Sieber Dr Woodland, CA | 4.0 | 3.0 | 1760 | $3,000 | $1.70 | 17d | 1 | 1.50mi |
Listing history 14 events
-
2026-06-19price $269,950 Active 37 DOM
-
2026-06-18days on market $279,950 Active 37 DOM
-
2026-06-17days on market $279,950 Active 36 DOM
-
2026-06-16days on market $279,950 Active 35 DOM
-
2026-06-15days on market $279,950 Active 34 DOM
-
2026-06-13days on market $279,950 Active 32 DOM
-
2026-06-09days on market $279,950 Active 28 DOM
-
2026-06-08days on market $279,950 Active 27 DOM
-
2026-06-07days on market $279,950 Active 26 DOM
-
2026-06-05days on market $279,950 Active 23 DOM
-
2026-06-03days on market $279,950 Active 22 DOM
-
2026-06-02days on market $279,950 Active 21 DOM
-
2026-06-01days on market $279,950 Active 20 DOM
-
2026-05-31days on market $279,950 Active 19 DOM
ⓘ Source: listings_history table (triggers on properties + properties_extension) + one-shot
backfill from property_details.listing_events for pre-trigger history.
Climate risk First Street
- Flood 4/10 Moderate FEMA zone X (unshaded) · 20% chance over 30 yrs
- Wildfire 5/10 Major
- Heat 7/10 Severe 7 d/yr ≥104°F today · 14 d/yr by 30 yrs out
- Wind 1/10 Low
- Air quality 10/10 Extreme 28 unhealthy d/yr today · 29 by 30 yrs out
Nearby sold comps map
Loading sold comps map…
Walkable amenities ~0.75 mi
Loading nearby amenities…
Taxation est. · year 1
- Rental income
- $39,048
- − Mortgage interest
- −$15,121
- − Property taxes
- −$4,049
- − Insurance
- −$1,350
- − Repairs & maintenance
- −$3,124
- − Management
- −$3,124
- − Depreciation
- −$7,853
- Taxable income
- $4,427
- Est. tax owed @ 24.0%
- −$1,062
- After-tax cash flow
- $7,399/yr
For passive investors: Depreciation is non-cash, so a rental often shows a tax loss while cash-flowing — sheltering income. Rental losses are passive: they offset passive income freely, and up to $25,000/yr can offset ordinary (W-2) income if you actively participate and your MAGI is under $100k (phasing out to $0 by $150k); unused losses carry forward. On sale, claimed depreciation is recaptured at up to 25%, and gains may owe capital-gains tax (a 1031 exchange can defer both). Figures are a year-1 estimate at your 24.0% rate — not tax advice; consult a CPA.
Condition & rehab AI · 30 photos
This brand new 2025 Clayton Tempo Series double wide is move-in ready with excellent condition and modern features. It offers a spacious open concept floor plan, modern kitchen, and two bathrooms. The home is located in a desirable community with affordable space rent. Consider painting the exterior and interior for further value enhancement.
Value-add opportunities
- Both Painting the exterior siding — Enhances curb appeal and value
- Both Landscaping improvements — Enhances curb appeal and value
- Both Flooring replacement in living areas — Improves aesthetics and value
- Both Painting interior walls — Enhances appearance and value
Renovation cost estimate screening
Value-add ROI direction
- Both Painting the exterior siding — Enhances curb appeal and value ↑
- Both Landscaping improvements — Enhances curb appeal and value ↑
- Both Flooring replacement in living areas — Improves aesthetics and value ↑
- Both Painting interior walls — Enhances appearance and value ↑
ⓘ Cost ranges are severity-bucket heuristics (US national rule-of-thumb). Get contractor quotes + a written scope before underwriting a rehab budget.
Schools (NCES district)
- District
- Woodland Joint Unified
- NCES district ID
- 0643080
- Math proficiency
- 34% ▲ 6.00%
- Reading proficiency
- 58% ▲ 15.00%
- Median HH income
- $57,556
- Composite
- 40.1/100
- National rank
- #3803
- State rank
- #171 of 517 in CA
Livability — Woodland
- Score
- 67/100
- State rank
- #314
- US rank
- #10682
Category grades
Schools grade is shown separately in the Schools card above.
Census & demographics
- Census place
- Woodland, CA
- County
- Yolo County · 212,115 people
- City population
- 66,420
- Metro
- Sacramento-Roseville-Folsom, CA
- Population (ZIP)
- 28,718
- Household income
- $106,698
- Rent vs Own
- Severe rent burden
- 654.0
Population outlook (Yolo County) Hauer SSP2
- Today (2025)
- 242,183 people
- By 2030
- 257,662 · +6.4%
- By 2040
- 288,050 · +18.9%
- By 2050
- 318,202 · +31.4%
- By 2075
- 392,736 · +62.2%
- By 2100
- 438,150 · +80.9%
Race, ethnicity, and origin ACS 2023
- Neighborhood character
- Diverse neighborhood (Simpson 0.67)
- Race & ethnicity
- Hispanic / Latino 46% White 32% Two or more races 20% Asian 13% Black 2%
- Hispanic origin (detail)
- Mexican 43%
- Common ancestry
- Italian 3% Scotch-Irish 2% Lithuanian 1%
- Foreign-born
- 25% · Canada, China, South Korea
- Languages at home
- 57% English-only · Spanish 31% Other Indo-European 7% Chinese 2%
Political lean MEDSL · Yolo
- 2024 margin
- Solid D (+36.2) · D 66.3% · R 30.1% · Other 3.6%
- 2008→2024 swing
- 0.0pp no change · 2008: 36.2pp · 2024: 36.2pp
- All cycles
- 2024: D+36.2 2020: D+41.4 2016: D+42.0 2012: D+33.2 2008: D+36.2
Not yet ingested
- Civics
- —
Market trends
- HPI YoY
- ▼ -119.41%
- Current HPI
- 276.202
- Rent YoY
- ▲ 5.40%
- Metro
- Sacramento-Roseville-Folsom, CA
- State GDP YoY
- ▲ 3.21%
- F500 in state
- 116
Industry mix (Fortune 500 HQ in CA)
| Industry | F500 HQs | Revenue |
|---|---|---|
| Technology | 27 | $1,492B |
|
||
| Financial Services | 3 | $174B |
|
||
| Retail | 3 | $44B |
|
||
| Insurance | 3 | $26B |
|
||
| Media / Entertainment | 2 | $115B |
|
||
| Pharmaceuticals / Biotech | 2 | $62B |
|
||
Cash-flow waterfall
monthlySold comps — $/sqft
last 12 mo · ≤1 miLoading sold comps…