 Triplex
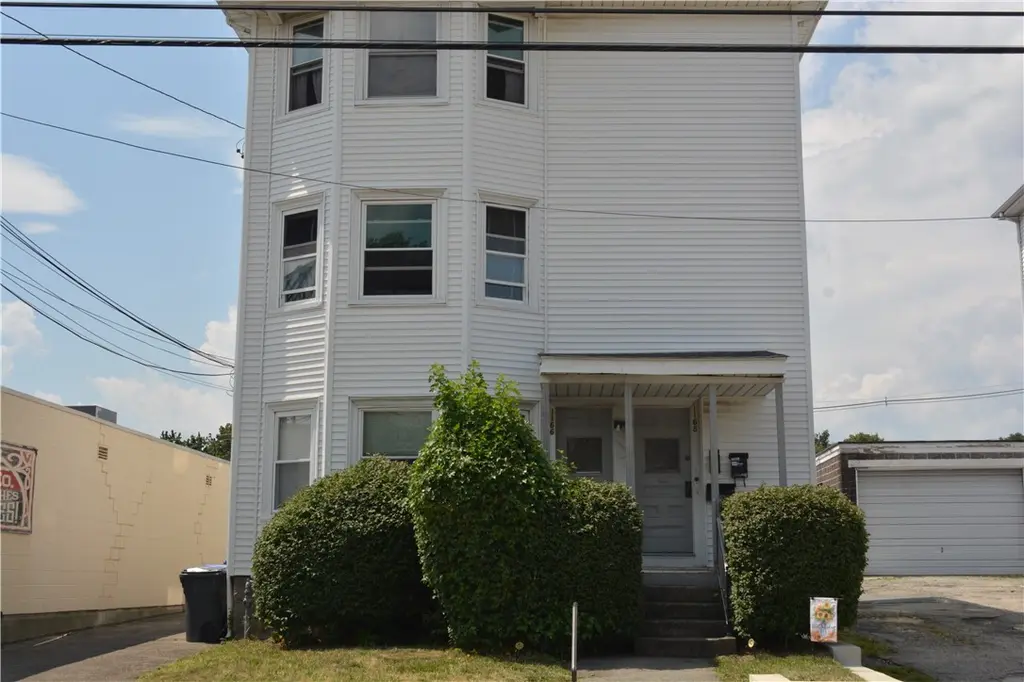
1166 1068 North Main St · Providence, RI
Flood risk 1/10 · Minimal
- FEMA flood zone
- X (unshaded)
- Chance of flooding over 30 yrs
- 0.0%
- Est. flood insurance / yr
- $473 – $860
Fire risk 1/10 · Minimal
- Est. fire insurance / yr
- $835 – $1,551
Heat risk 6/10 · Moderate
- Hot days now (above 97°F)
- 7 days/yr
- Hot days in 30 yrs
- 15 days/yr
Wind risk 6/10 · Moderate
- Chance of severe wind over 30 yrs
- 70.0%
Air-quality risk 2/10 · Minimal
- Unhealthy air days now
- 1 days/yr
- Unhealthy air days in 30 yrs
- 2 days/yr
Risk factors via First Street. Map © Google.
Why this score? — see what drove the D grade
The composite is a weighted blend of 9 inputs, each scored 0–100. Each bar is that input's sub-score; the figure is the points it added to the 100-point composite (weight × sub-score).
- Cash flow +17.9/30.0
- DSCR +5.6/10.0
- ARV discount +4.4/15.0
- Rent growth +4.4/5.0
- 1% rule +4.2/10.0
- Livability +4.2/5.0
- Condition / age +2.5/5.0
- Schools +1.0/10.0
- Appreciation +0.0/10.0
$799,000
🖨 Deal sheet (PDF) 📄 Offer letter ✓ Due diligence
Multi-family units
County records classify this as Multi-Family (2-4 Unit). Listing-text estimate: 3 units. confirmed
Listing remarks
Seize the opportunity with this large 3-family home on North Main Street, perfect for investors seeking immediate income and future growth. Each unit features three bedrooms, currently leased below market value to minimize wear and tear, offering substantial rent upside. The property features durable vinyl siding and a recently updated 3-year-old roof, reducing immediate maintenance concerns. A valuable detached garage in the rear provides ample storage or potential for creative development. Its C-2 Commercial zoning opens doors to endless possibilities for the right vision. Residing in a highly desirable area, you'll find a Whole Foods, diverse dining, shopping, and a new LA Fitness just m
Key facts
- Durable vinyl siding
- Large 3-family home
- Detached garage
Tags
Property features AI
Finance
- Other: Property sits on approximately 0.1312 acres
- Financial info: One unit currently rents for $1,700; One unit currently rents for $1,725; One unit currently rents for $1,900
Exterior
- Parking: Detached garage; One covered garage space; Total parking for 10 vehicles
- Utilities: Sewer connected; Water connected; 100 amp electric service
- Home design: Multifamily property with 3 total units in 2 buildings; 3,240 above-grade finished area
- Construction: Vinyl siding
- Exterior features: Sewer connected; Water connected
Interior
- Kitchen: No specific kitchen appliance list provided
- Bedrooms: Three 3-bedroom units (each unit is three bedrooms)
- Flooring: Ceramic tile; Hardwood
- Bathrooms: Three full bathrooms total (each unit has 1 full bathroom)
- Heating & cooling: Baseboard heating; Gas heating
- Interior features: Full unfinished basement with interior entry; Total of 15 rooms across the property; Ceramic tile and hardwood flooring
- Laundry & utility: Gas water heater
Neighborhood map
What this means for you Summary
Snapshot
- This is a 3 × 3-bed/1.0-bath units multifamily listed at $799k.
Deal economics
- At list price, monthly cash flow is $679 ($8k/yr) — positive. Per door: $226/mo.
- The deal already cash-flows at list — no discount required.
- To meet the 1% rule (rent ≥ 1% of price), the offer needs to be $733k (8.2% below list).
- Recommended offer: $733k (8.2% below list) — sets the bar for 1% rule.
- Cap rate 7.3% vs local median 4.0% in Providence — top-decile yield for the area; either an underpriced asset or a hidden risk that comps aren't pricing in. Stress-test before assuming the spread holds.
Location & tenants
- Location reads 84/100 on livability (#2 in RI, #794 nationally) — a professional / high-income tenant draw. Strengths: amenities A+, commute A+, housing A+; Watch: employment C-.
- Providence (urban): math 8% / reading 16% proficiency, ranked #34 of 39 in RI (top 87%) — low school quality limits family demand, transient renter base, plan for 1-2y turnover; 79% free/reduced lunch — lower-income household profile, screen leases tightly.
- Zoned schools: George J. West El. School (math 7% / reading 13%, grade F, #148 of 167 statewide, top 90%, 601 students, 84% FRL); Nathanael Greene Middle (math 10% / reading 23%, grade F, #37 of 57 statewide, top 64%, 808 students, 85% FRL); Central High School (math 2% / reading 12%, grade F, #53 of 58 statewide, top 96%, 1,302 students, 87% FRL).
- Market conditions: Rents rising fast (+7.5%/yr); 147 active listings in the ZIP; solid renter incomes; 776 units permitted in Providence County in 2024 (229 in 5+ unit buildings).
- At $7,334/mo this rent would consume 85% of the median local household income ($103k/yr) (locally 1567% of renters already pay >50% of income on rent) — very limited rent-growth headroom before tenants either downsize or default.
Forward outlook
- Local home prices are declining (-3.0%/yr); year-one equity from $6k of loan paydown is wiped out by about $24k of value loss. Plan a longer hold.
- Providence County population projected at +5% by 2050 — modest demand growth; plan on rents tracking national, not racing it.
- At projected returns (-3.0% appreciation + 7.5% rent growth), your $224k cash investment doubles in ~10 years — after that, you're playing with house money.
Negotiation context
- It's been on market 40 days — a 3% lower offer ($775k) is reasonable based on typical stale-listing flexibility.
- 3 sale attempts since 2y ago with the ask held roughly flat each time — persistent listings suggest the price (not the market) is what's stuck; bring a comps-based counter.
Risks & watch-outs
- Watch-outs: built in 1900 — expect roof / HVAC / electrical / plumbing capex.
- Climate carrying-cost: major wind risk, 70% chance of damaging wind over 30y; extreme-heat days projected 7→15/yr by 2055 (HVAC capex compounding) — expect insurance premiums to compound above CPI over the hold.
Questions for the listing agent
- It's been on market 40 days. Have you received any prior offers? Is the seller open to a 8% concession, seller financing, or rate buy-down credit?
- Can we see the unit-by-unit rent roll, current vacancy, and any below-market leases? What's the average tenancy length?
- What capital expenditures (roof, boiler, parking lot, exteriors) have been made in the last 5 years, and what's planned in the next 2?
- Built in 1900 — when were the roof, HVAC, electrical panel, plumbing, and water heater last replaced?
- Is there a deadline driving the sale (1031 exchange, divorce, estate, relocation)? That informs how much negotiation room exists.
- Schools are F-rated, which usually means shorter tenancies and higher turnover. Who's the typical renter profile here, and what's been the actual vacancy rate?
- The area grade is low — what's the realistic commute time and amenity access for the typical tenant pool here? Any planned neighborhood developments (good or bad) we should know about?
- What's the average days-on-market for RENTAL listings here right now (not sales)? A rising rental-DOM trend means longer vacancies and softer asking-rent achievability than the comps imply.
- What's the recent tenant-quality profile in this submarket — average credit score on applications, eviction rate, late-payment / NSF rate, and stable-employment percentage? A property-management company in the area should have these aggregated.
- How much new apartment / multifamily construction is in the pipeline within 1–3 miles? Heavy new supply (>2% of stock underway) typically softens rents 12–24 months out; light construction supports rent growth.
Investment metrics
- 1% rule
- 0.92% ✗
- Cap rate
- 7.31%
- Cash-on-cash
- 3.64%
- DSCR
- 1.16
- GRM
- 9.1
CMA / ARV
- ARV (median comp)
- $747,333
- List price
- $799,000
- Delta
- 6.91%
- Verdict
- FAIR
- Comps
- 20 within 1.0 mi
Show comp detail 2 sales within ~0.75 mi
| Address | Dist | Beds/Ba | Sqft | Sold | Price | $/sf | Match |
|---|---|---|---|---|---|---|---|
| 299 Lowden St | 0.58mi | 8/4.0 (-1) | 3,000 (-7%) | 21mo | $660,000 | $220 | 34 |
| 29 31 Heaton St | 0.72mi | 9/3.0 | 2,839 (-12%) | 17mo | $625,000 | $220 | 32 |
Match score weights: distance 35% · size 25% · config 20% · recency 20%. Top-matched comps best support the ARV.
Projected returns pro-forma
-3.0% appreciation · 7.46% rent growth · sell at horizon
- IRR
- -6.0%
- Equity multiple
- 0.77×
- Total profit
- $-51,983
- Equity at exit
- $119,133
- IRR
- 8.1%
- Equity multiple
- 1.74×
- Total profit
- $164,593
- Equity at exit
- $69,083
Cash invested: $223,720 (down + closing). Projections, not guarantees.
Landlord ↔ Tenant lean methodology
- Overall (STATE)
- 31 Tenant-Leaning
- State Rhode Island
- 31 Tenant-Leaning · D+8
- County
- — inherits STATE
- City
- — inherits STATE
ZIP-level market 02906
- Rents YoY
- 7.5%
- Active inventory
- 147
- Price-to-rent
- 27.2×
Monthly cashflow live
- Estimated rent
- $7,334 high interval (Pro) →
- Mortgage (P&I)
- −$4,190
- Tax from tax record
- −$592 /mo · $7,104/yr
- Insurance
- −$333
- HOA
- −$0
- Vacancy / Maint / Mgmt
- −$1,540
- Net cashflow
- $679
Break-even live
Sensitivity live
| Price | -10% $1,131 | -5% $905 | +0% $679 | +5% $453 | +10% $227 |
|---|---|---|---|---|---|
| Rent | -10% $100 | -5% $389 | +0% $679 | +5% $969 | +10% $1,258 |
| Rate | -1.0pp $1,081 | -0.5pp $882 | base $679 | +0.5pp $472 | +1.0pp $261 |
3-unit breakdown (identical units grouped — click to expand)
| Units | Beds | Baths | Est. rent |
|---|---|---|---|
| 3× units | 3 | 1 | $7,335 |
| #1 | 3 | 1 | $2,445 |
| #2 | 3 | 1 | $2,445 |
| #3 | 3 | 1 | $2,445 |
| Total (3 units) | $7,334 | ||
UW: 25.0% down · 7.5% · 30yr · 1.5% tax · 5.0% vac · 8.0% maint · 8.0% mgmt
Financing live
Cash to close
- Down payment
- $199,750
- Closing costs
- $23,970
- Reserves months
- —
- Total cash needed
- —
Loan-product check · same deal, 3 products live
Conventional
25% down · 7.5% · 30yr
- Down + closing
- —
- Monthly P&I
- —
- Monthly cashflow
- —
- DSCR
- —
- Eligible?
- —
Personal DTI + credit; lowest rate.
DSCR
20% down · 8.5% · 30yr
- Down + closing
- —
- Monthly P&I
- —
- Monthly cashflow
- —
- DSCR
- —
- Eligible?
- —
No personal income docs; deal must DSCR.
Hard money
10% down · 12.0% · 12mo
- Down + closing
- —
- Monthly P&I
- —
- Monthly cashflow
- —
- DSCR
- —
- Eligible?
- —
Short-term bridge; refi at stabilization.
Listing history 19 events
-
2026-06-21days on market $799,000 Active 40 DOM
-
2026-06-18days on market $799,000 Active 37 DOM
-
2026-06-17days on market $799,000 Active 36 DOM
-
2026-06-16days on market $799,000 Active 35 DOM
-
2026-06-15days on market $799,000 Active 34 DOM
-
2026-06-13days on market $799,000 Active 32 DOM
-
2026-06-09days on market $799,000 Active 28 DOM
-
2026-06-08days on market $799,000 Active 27 DOM
-
2026-06-07days on market $799,000 Active 26 DOM
-
2026-06-05days on market $799,000 Active 23 DOM
-
2026-06-03days on market $799,000 Active 22 DOM
-
2026-06-02days on market $799,000 Active 21 DOM
-
2026-06-01days on market $799,000 Active 20 DOM
-
2026-05-31days on market $799,000 Active 19 DOM
-
2026-05-12$819,000 Active 905-char remark
-
2025-07-28historical
-
2025-07-25$799,000 Active
-
2025-04-18historical
-
2024-11-11$799,000 Active
ⓘ Source: listings_history table (triggers on properties + properties_extension) + one-shot
backfill from property_details.listing_events for pre-trigger history.
Tax reassessment forecast RI · Partial reset (capped growth)
- Current annual tax
- $7,104 · $592/mo
- Projected year-2 tax
- $10,064 · $839/mo
- Expected delta
- +$2,960/yr (+$247/mo · 41.7%)
ⓘ Screening estimate from a state-policy table — verify with the county assessor before closing.
Climate risk First Street
- Flood 1/10 Low FEMA zone X (unshaded) · 0% chance over 30 yrs
- Wildfire 1/10 Low
- Heat 6/10 Major 7 d/yr ≥97°F today · 15 d/yr by 30 yrs out
- Wind 6/10 Major 70% chance of damaging wind over 30 yrs
- Air quality 2/10 Low 1 unhealthy d/yr today · 2 by 30 yrs out
Nearby sold comps map
Loading sold comps map…
Walkable amenities ~0.75 mi
Loading nearby amenities…
Taxation est. · year 1
- Rental income
- $88,008
- − Mortgage interest
- −$44,756
- − Property taxes
- −$7,104
- − Insurance
- −$3,995
- − Repairs & maintenance
- −$7,041
- − Management
- −$7,041
- − Depreciation
- −$23,244
- Taxable loss
- −$5,172
- Est. tax savings @ 24.0%
- +$1,241
- After-tax cash flow
- $9,388/yr
For passive investors: Depreciation is non-cash, so a rental often shows a tax loss while cash-flowing — sheltering income. Rental losses are passive: they offset passive income freely, and up to $25,000/yr can offset ordinary (W-2) income if you actively participate and your MAGI is under $100k (phasing out to $0 by $150k); unused losses carry forward. On sale, claimed depreciation is recaptured at up to 25%, and gains may owe capital-gains tax (a 1031 exchange can defer both). Figures are a year-1 estimate at your 24.0% rate — not tax advice; consult a CPA.
Schools (NCES district)
- District
- Providence
- NCES district ID
- 4400900
- Math proficiency
- 8% ▼ -4.00%
- Reading proficiency
- 16% ▼ -2.00%
- Median HH income
- $38,197
- Composite
- 10.12/100
- National rank
- #9803
- State rank
- #34 of 39 in RI
Livability — Providence
- Score
- 84/100
- State rank
- #2
- US rank
- #794
Category grades
Schools grade is shown separately in the Schools card above.
Census & demographics
- Census place
- Providence, RI
- County
- Providence County · 548,917 people
- City population
- 212,734
- Metro
- Providence-Warwick, RI-MA
- Population (ZIP)
- 26,380
- Household income
- $103,050
- Rent vs Own
- Severe rent burden
- 1567.0
Population outlook (Providence County) Hauer SSP2
- Today (2025)
- 653,469 people
- By 2030
- 660,819 · +1.1%
- By 2040
- 672,747 · +3.0%
- By 2050
- 683,741 · +4.6%
- By 2075
- 720,435 · +10.2%
- By 2100
- 741,582 · +13.5%
Race, ethnicity, and origin ACS 2023
- Neighborhood character
- Predominantly White (72%)
- Race & ethnicity
- White 72% Asian 11% Hispanic / Latino 8% Two or more races 8% Black 3%
- Hispanic origin (detail)
- Mexican 2% Puerto Rican 1%
- Common ancestry
- Lithuanian 6% Romanian 5% Scotch-Irish 4%
- Foreign-born
- 17% · Canada, China, South Korea
- Languages at home
- 80% English-only · Other Indo-European 6% Spanish 5% Chinese 3%
Political lean MEDSL · Providence
- 2024 margin
- D (+14.4) · D 56.1% · R 41.7% · Other 2.2%
- 2008→2024 swing
- -20.0pp toward R · 2008: 34.4pp · 2024: 14.4pp
- All cycles
- 2024: D+14.4 2020: D+22.9 2016: D+21.2 2012: D+34.9 2008: D+34.4
Not yet ingested
- Civics
- —
Market trends
- HPI YoY
- ▼ -792.46%
- Current HPI
- 355.3795
- Rent YoY
- ▲ 7.46%
- Metro
- Providence-Warwick, RI-MA
- State GDP YoY
- ▲ 2.25%
- F500 in state
- 10
Industry mix (Fortune 500 HQ in RI)
| Industry | F500 HQs | Revenue |
|---|---|---|
| Healthcare | 1 | $373B |
|
||
| Food Distribution | 1 | $31B |
|
||
| Aerospace / Defense | 1 | $14B |
|
||
| Financial Services | 1 | $8B |
|
||
| Consumer Goods | 1 | $4B |
|
||
Price history
+0.0% since first listed6 events — show timeline
- 2026-05-27 Price Changed $799,000 RIS
- 2026-05-12 Listed $819,000 RIS
- 2025-07-28 Listing Removed — RIS
- 2025-07-25 Listed $799,000 RIS
- 2025-04-18 Listing Removed — RIS
- 2024-11-11 Listed $799,000 RIS
Property tax history
+1.8%/yrLatest (2025): $7,104 · +21.3% YoY. Source: county tax records.
Cash-flow waterfall
monthlySold comps — $/sqft
last 12 mo · ≤1 miLoading sold comps…