3185 Bluebird Ln · Belvedere Park, GA
Flood risk 1/10 · Minimal
- FEMA flood zone
- X (unshaded)
- Chance of flooding over 30 yrs
- 0.0%
- Est. flood insurance / yr
- $507 – $1,088
Fire risk 1/10 · Minimal
- Est. fire insurance / yr
- $963 – $1,789
Heat risk 5/10 · Moderate
- Hot days now (above 104°F)
- 7 days/yr
- Hot days in 30 yrs
- 17 days/yr
Wind risk 5/10 · Moderate
- Chance of severe wind over 30 yrs
- 26.0%
Air-quality risk 5/10 · Moderate
- Unhealthy air days now
- 6 days/yr
- Unhealthy air days in 30 yrs
- 8 days/yr
Risk factors via First Street. Map © Google.
Why this score? — see what drove the D grade
The composite is a weighted blend of 9 inputs, each scored 0–100. Each bar is that input's sub-score; the figure is the points it added to the 100-point composite (weight × sub-score).
- ARV discount +15.0/15.0
- Cash flow +10.2/30.0
- 1% rule +3.4/10.0
- Livability +3.4/5.0
- DSCR +2.9/10.0
- Rent growth +2.8/5.0
- Condition / age +2.5/5.0
- Schools +2.1/10.0
- Appreciation +0.0/10.0
$206,000
🖨 Deal sheet 📄 Offer letter ✓ Due diligence
Listing remarks MLS
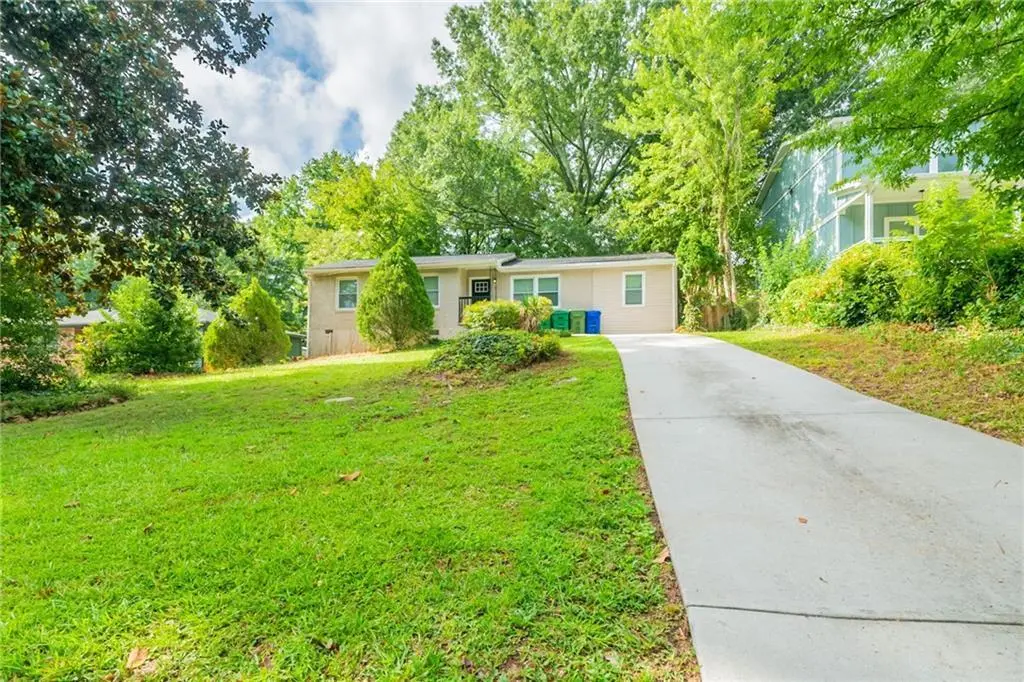
Spacious home featuring a functional layout with comfortable living spaces designed for everyday living and entertaining. The main living area offers an inviting atmosphere, while the kitchen provides ample cabinet and counter space with easy access to the dining area. Generous bedrooms provide flexibility for guests, home office, or hobbies. The primary suite offers a private retreat. Enjoy backyard space perfect for relaxing or outdoor gatherings. Great opportunity to make this home your own. One or more photo(s) was virtually staged.
Key facts
- Private retreat
- Backyard space
- 0.24 acre lot
Tags
Property features AI
Exterior
- Parking: Driveway with open parking
- Utilities: Other water source; Other sewer; Other utilities
- Home design: One-level home; Resale property
- Construction: Stucco construction; Composition roof; Block foundation
- Exterior features: Paved road frontage; Other road frontage type
Interior
- Kitchen: Electric range; Microwave; Refrigerator; Other kitchen features
- Bedrooms: Three main-level bedrooms; Primary suite on the main level
- Flooring: Vinyl flooring
- Bathrooms: One full bathroom (main level)
- Heating & cooling: Central heating; Ceiling fans for cooling
- Interior features: Open concept dining area; No shared/common walls; Other interior features
- Laundry & utility: Other laundry features
Neighborhood map
What this means for you Summary
Snapshot
- This is a 3-bed/1.0-bath single-family listed at $206k.
Deal economics
- At list price, monthly cash flow is $-118 ($-1k/yr) — negative.
- To cash-flow at today's rent, offer at most $185k (10.2% below list).
- To meet the 1% rule (rent ≥ 1% of price), the offer needs to be $172k (16.5% below list).
- Recommended offer: $172k (16.5% below list) — sets the bar for 1% rule.
- Cap rate 5.6% vs local median 3.8% in Belvedere Park — top-decile yield for the area; either an underpriced asset or a hidden risk that comps aren't pricing in. Stress-test before assuming the spread holds.
Location & tenants
- Location reads 68/100 on livability (#153 in GA) — a middle-class / working-renter tenant base. Strengths: cost of living A+, housing A+; Watch: amenities F, commute F, health & safety F.
- Dekalb County (suburban): math 19% / reading 28% proficiency, ranked #125 of 174 in GA (top 72%) — low school quality limits family demand, transient renter base, plan for 1-2y turnover; 68% free/reduced lunch — lower-income household profile, screen leases tightly.
- Zoned schools: Peachcrest Elementary School (math 2% / reading 8%, grade F, #1,160 of 1,228 statewide, top 98%, 677 students, 100% FRL); Mary Mcleod Bethune Middle School (math 4% / reading 13%, grade F, #439 of 470 statewide, top 94%, 718 students, 100% FRL); Towers High School (math 2% / reading 12%, grade F, #385 of 424 statewide, top 92%, 764 students, 100% FRL) — zoned schools average 100% FRL vs 68% district-wide (32 pts higher); higher-poverty schools than district average — tighter screening recommended.
- Zoned-school proficiency averages 7% at this address vs 24% district-wide (-17 pts) — the specific schools serving this property underperform the Dekalb County average; the district grade overstates school quality for this exact location.
- Market conditions: Rents rising (+1.3%/yr); 422 active listings in the ZIP; 40 comparable units currently listed for rent nearby; rentals at typical pace (median 25d on market — plan ~3-4 weeks tenant-placement turnaround); 1,240 units permitted in DeKalb County in 2024 (385 in 5+ unit buildings).
- This rent runs 33% of the median local income ($63k/yr) — at the standard rent-burdened threshold; future hikes will face affordability resistance.
Forward outlook
- Local home prices are declining (-3.0%/yr); year-one equity from $1k of loan paydown is wiped out by about $6k of value loss. Plan a longer hold.
- DeKalb County population projected at +28% by 2050 — long-run rental-demand tailwind backs the buy-and-hold thesis.
Negotiation context
- It's been on market 25 days — a 2% lower offer ($203k) is reasonable based on typical stale-listing flexibility.
- 3 sale attempts since 18y ago with the ask held roughly flat each time — persistent listings suggest the price (not the market) is what's stuck; bring a comps-based counter.
Risks & watch-outs
- Watch-outs: built in 1954 — expect roof / HVAC / electrical / plumbing capex.
- Climate carrying-cost: moderate wind risk, 26% chance of damaging wind over 30y; extreme-heat days projected 7→17/yr by 2055 (HVAC capex compounding) — expect insurance premiums to compound above CPI over the hold.
Questions for the listing agent
- What do current leases actually rent for vs. the listed asking? Can we see a recent rent roll and the last 12 months of T-12 income?
- Built in 1954 — when were the roof, HVAC, electrical panel, plumbing, and water heater last replaced?
- Is there a deadline driving the sale (1031 exchange, divorce, estate, relocation)? That informs how much negotiation room exists.
- Schools are F-rated, which usually means shorter tenancies and higher turnover. Who's the typical renter profile here, and what's been the actual vacancy rate?
- The area grade is low — what's the realistic commute time and amenity access for the typical tenant pool here? Any planned neighborhood developments (good or bad) we should know about?
- What's the average days-on-market for RENTAL listings here right now (not sales)? A rising rental-DOM trend means longer vacancies and softer asking-rent achievability than the comps imply.
- What's the recent tenant-quality profile in this submarket — average credit score on applications, eviction rate, late-payment / NSF rate, and stable-employment percentage? A property-management company in the area should have these aggregated.
- How much new for-sale + rental construction is in the pipeline within 1–3 miles? Heavy new supply typically softens prices + rents 12–24 months out; constrained supply supports both.
Investment metrics
- 1% rule
- 0.84% ✗
- Cap rate
- 5.60%
- Cash-on-cash
- -2.46%
- DSCR
- 0.89
- GRM
- 10.0
CMA / ARV
- ARV (median comp)
- $275,323
- List price
- $206,000
- Delta
- -25.18%
- Verdict
- UNDERPRICED
- Comps
- 20 within 1.0 mi
Show comp detail 12 sales within ~0.75 mi
| Address | Dist | Beds/Ba | Sqft | Sold | Price | $/sf | Match |
|---|---|---|---|---|---|---|---|
| 3094 Santa Monica Dr | 0.38mi | 3/1.5 | 1,213 (-2%) | 3mo | $185,000 | $153 | 75 |
| 1546 Alverado Way | 0.33mi | 3/2.0 | 1,157 (-6%) | 2mo | $290,000 | $251 | 69 |
| 2996 Laguna Dr | 0.44mi | 3/2.0 | 1,140 (-8%) | 1mo | $290,000 | $254 | 61 |
| 3013 Catalina Dr | 0.41mi | 3/3.0 | 1,347 (+9%) | 1mo | $360,000 | $267 | 57 |
| 1737 Mckenzie Dr | 0.57mi | 3/1.0 | 1,125 (-9%) | 2mo | $204,000 | $181 | 57 |
| 3042 Monterey Dr | 0.35mi | 3/2.0 | 1,392 (+13%) | 3mo | $245,000 | $176 | 56 |
| 3012 Monterey Dr | 0.42mi | 3/2.0 | 1,092 (-12%) | 3mo | $275,000 | $252 | 55 |
| 3340 Pinehill Dr | 0.39mi | 3/1.5 | 1,058 (-14%) | 3mo | $168,500 | $159 | 53 |
| 2930 Belvedere Ln | 0.61mi | 3/2.0 | 1,131 (-8%) | 3mo | $317,900 | $281 | 51 |
| 3193 Beech Dr | 0.59mi | 4/2.0 (+1) | 1,340 (+8%) | 2mo | $345,000 | $257 | 48 |
| 3260 Beech Dr | 0.65mi | 3/1.0 | 1,074 (-13%) | 1mo | $257,000 | $239 | 47 |
| 2926 Monterey Dr | 0.62mi | 3/2.0 | 1,379 (+12%) | 2mo | $320,000 | $232 | 46 |
Match score weights: distance 35% · size 25% · config 20% · recency 20%. Top-matched comps best support the ARV.
Projected returns pro-forma
-3.0% appreciation · 1.34% rent growth · sell at horizon
- IRR
- -22.3%
- Equity multiple
- 0.24×
- Total profit
- $-43,689
- Equity at exit
- $30,715
- IRR
- -21.2%
- Equity multiple
- -0.02×
- Total profit
- $-58,731
- Equity at exit
- $17,811
Cash invested: $57,680 (down + closing). Projections, not guarantees.
Landlord ↔ Tenant lean methodology
- Overall (STATE)
- 90 Strongly Landlord-Friendly
- State Georgia
- 90 Strongly Landlord-Friendly · R+3
- County
- — inherits STATE
- City
- — inherits STATE
ZIP-level market 30032
- Rents YoY
- 1.3%
- Active inventory
- 422
- Price-to-rent
- 10.0×
Monthly cashflow live
- Estimated rent
- $1,720 high interval (Pro) →
- Mortgage (P&I)
- −$1,080
- Tax from tax record
- −$311 /mo · $3,736/yr
- Insurance
- −$86
- HOA
- −$0
- Vacancy / Maint / Mgmt
- −$361
- Net cashflow
- $-118
Break-even live
UW: 25.0% down · 7.5% · 30yr · 1.5% tax · 5.0% vac · 8.0% maint · 8.0% mgmt
Financing live
Cash to close
- Down payment
- $51,500
- Closing costs
- $6,180
- Reserves months
- —
- Total cash needed
- —
Loan-product check · same deal, 3 products live
Conventional
25% down · 7.5% · 30yr
- Down + closing
- —
- Monthly P&I
- —
- Monthly cashflow
- —
- DSCR
- —
- Eligible?
- —
Personal DTI + credit; lowest rate.
DSCR
20% down · 8.5% · 30yr
- Down + closing
- —
- Monthly P&I
- —
- Monthly cashflow
- —
- DSCR
- —
- Eligible?
- —
No personal income docs; deal must DSCR.
Hard money
10% down · 12.0% · 12mo
- Down + closing
- —
- Monthly P&I
- —
- Monthly cashflow
- —
- DSCR
- —
- Eligible?
- —
Short-term bridge; refi at stabilization.
Rent comps 40 comps
| Address | Beds | Baths | Sqft | Rent | $/sqft | DOM | Units | Dist |
|---|---|---|---|---|---|---|---|---|
| 3191 Bluebird Ln Decatur, GA | 4.0 | 2.0 | 1300 | $7,250 | $5.58 | 24d | 1 | 0.04mi |
| 3024 Pasadena Dr Decatur, GA | 3.0 | 2.0 | 1079 | $1,993 | $1.85 | 5d | 1 | 0.40mi |
| 1368 Alverado Way Decatur, GA | 2.0 | 1.0 | 1088 | $1,523 | $1.40 | 44d | 1 | 0.47mi |
| 1387 Midview Dr Decatur, GA | 3.0 | 1.0 | 1026 | $1,750 | $1.71 | 44d | 1 | 0.48mi |
| 3010 Santa Monica Dr Decatur, GA | 4.0 | 2.0 | 1392 | $2,095 | $1.51 | 44d | 1 | 0.50mi |
| 1598 San Gabriel Ave Decatur, GA | 3.0 | 2.0 | 1451 | $2,023 | $1.39 | 24d | 1 | 0.54mi |
| 1428 David Cir Unit A11 Decatur, GA | 3.0 | 1.5 | 1362 | $1,830 | $1.34 | 44d | 1 | 0.55mi |
| 2939 Belvedere Ln Decatur, GA | 3.0 | 1.5 | 1500 | $1,595 | $1.06 | 13d | 1 | 0.56mi |
| 2939 Belvedere Ln Decatur, GA | 3.0 | 1.5 | 1500 | $1,595 | $1.06 | 10d | 1 | 0.56mi |
| 3365 Columbia Trce Decatur, GA | 3.0 | 2.0 | 1252 | $1,450 | $1.16 | 5d | 1 | 0.57mi |
| 3381 Columbia Trce Decatur, GA | 3.0 | 2.0 | 1252 | $1,450 | $1.16 | 5d | 1 | 0.59mi |
| 3427 Jackson Dr Decatur, GA | 3.0 | 2.0 | 1400 | $1,900 | $1.36 | 19d | 1 | 0.59mi |
| 1752 Lynn Ln Decatur, GA | 3.0 | 2.0 | 1390 | $1,950 | $1.40 | 44d | 1 | 0.59mi |
| 3395 Columbia Trce Decatur, GA | 3.0 | 2.0 | 1252 | $1,450 | $1.16 | 24d | 1 | 0.61mi |
| 3405 Cobbs Ferry Dr Unit 3405 Decatur, GA | 3.0 | 2.0 | 1331 | $1,550 | $1.16 | 44d | 1 | 0.62mi |
| 3235 Beech Dr Decatur, GA | 3.0 | 2.0 | 1264 | $2,400 | $1.90 | 44d | 1 | 0.62mi |
| 1693 San Gabriel Ave Decatur, GA | 3.0 | 2.0 | 1265 | $1,995 | $1.58 | 4d | 1 | 0.69mi |
| 1689 San Gabriel Ave Decatur, GA | 3.0 | 1.0 | 989 | $1,450 | $1.47 | 44d | 1 | 0.69mi |
| 3432 Cobbs Ferry Dr Decatur, GA | 3.0 | 2.0 | 1252 | $1,450 | $1.16 | 5d | 1 | 0.70mi |
| 3445 Cobbs Ferry Dr Decatur, GA | 3.0 | 2.0 | 1252 | $1,450 | $1.16 | 24d | 1 | 0.73mi |
| 3485 Cobbs Ferry Dr Decatur, GA | 3.0 | 2.0 | 1252 | $1,450 | $1.16 | 24d | 1 | 0.76mi |
| 1150 Maple Walk Cir Decatur, GA | 2.0 | 2.0 | 1050 | $1,299 | $1.24 | 24d | 3 | 0.82mi |
| 1855 Shamrock Dr Decatur, GA | 3.0 | 2.0 | 1310 | $1,771 | $1.35 | 5d | 1 | 0.84mi |
| 2873 White Oak Dr Decatur, GA | 2.0 | 1.5 | 816 | $1,800 | $2.21 | 44d | 1 | 0.85mi |
| 1873 Shamrock Dr Decatur, GA | 4.0 | 1.5 | 1492 | $1,075 | $0.72 | 5d | 1 | 0.88mi |
| 3503 Misty Valley Rd Decatur, GA | 3.0 | 1.5 | 984 | $1,495 | $1.52 | 24d | 1 | 0.94mi |
| 4100 Glenwood Rd Decatur, GA | 1.0–2.0 | 1.0–1.5 | 925 | $1,450 | $1.57 | 5d | 17 | 0.95mi |
| 3900 Memorial Dr Decatur, GA | 1.0–2.0 | 1.0–1.5 | 1050 | $1,275 | $1.21 | 13d | 4 | 0.95mi |
| 1932 Rosewood Rd Decatur, GA | 4.0 | 2.5 | 1294 | $1,120 | $0.87 | 24d | 1 | 1.04mi |
| 1932 Rosewood Rd Decatur, GA | 4.0 | 2.5 | 1215 | $1,485 | $1.22 | 13d | 1 | 1.04mi |
| 3405 Elgin Dr Decatur, GA | 3.0 | 2.0 | 1198 | $1,700 | $1.42 | 44d | 1 | 1.05mi |
| 2771 White Oak Dr Decatur, GA | 3.0 | 2.0 | 1032 | $1,524 | $1.48 | 5d | 2 | 1.06mi |
| 1953 Laurel Ln Decatur, GA | 3.0 | 1.0 | 1202 | $945 | $0.79 | 21d | 1 | 1.07mi |
| 3529 Robins Landing Way Decatur, GA | 1.0–3.0 | 1.0–2.0 | 982 | $1,677 | $1.71 | 44d | 26 | 1.10mi |
| 3529 Robins Landing Way Decatur, GA | 1.0–4.0 | 1.0–2.0 | 1042 | $1,443 | $1.38 | 2d | 37 | 1.10mi |
| 2758 Amelia Ave Decatur, GA | 2.0 | 1.0 | 850 | $1,500 | $1.76 | 13d | 1 | 1.11mi |
| 1972 Glendale Dr Decatur, GA | 3.0 | 2.0 | 1211 | $1,790 | $1.48 | 44d | 1 | 1.13mi |
| 1978 Glendale Dr Decatur, GA | 3.0 | 2.0 | 1211 | $1,490 | $1.23 | 13d | 1 | 1.14mi |
| 1978 Glendale Dr Decatur, GA | 3.0 | 2.0 | 1211 | $1,200 | $0.99 | 18d | 1 | 1.14mi |
| 1978 Glendale Dr Decatur, GA | 3.0 | 2.0 | 1211 | $1,100 | $0.91 | 4d | 1 | 1.14mi |
Listing history 13 events
-
2026-06-02status $206,000 Pending 25 DOM
-
2026-06-01days on market $206,000 Active 25 DOM
Show marketing remark (542 chars)
Spacious home featuring a functional layout with comfortable living spaces designed for everyday living and entertaining. The main living area offers an inviting atmosphere, while the kitchen provides ample cabinet and counter space with easy access to the dining area. Generous bedrooms provide flexibility for guests, home office, or hobbies. The primary suite offers a private retreat. Enjoy backyard space perfect for relaxing or outdoor gatherings. Great opportunity to make this home your own. One or more photo(s) was virtually staged.
-
2026-05-31days on market $206,000 Active 24 DOM
-
2026-04-23$206,000 New 542-char remark
Show marketing remark (542 chars)
Spacious home featuring a functional layout with comfortable living spaces designed for everyday living and entertaining. The main living area offers an inviting atmosphere, while the kitchen provides ample cabinet and counter space with easy access to the dining area. Generous bedrooms provide flexibility for guests, home office, or hobbies. The primary suite offers a private retreat. Enjoy backyard space perfect for relaxing or outdoor gatherings. Great opportunity to make this home your own. One or more photo(s) was virtually staged.
-
2026-04-23$206,000 Active 542-char remark
Show marketing remark (542 chars)
Spacious home featuring a functional layout with comfortable living spaces designed for everyday living and entertaining. The main living area offers an inviting atmosphere, while the kitchen provides ample cabinet and counter space with easy access to the dining area. Generous bedrooms provide flexibility for guests, home office, or hobbies. The primary suite offers a private retreat. Enjoy backyard space perfect for relaxing or outdoor gatherings. Great opportunity to make this home your own. One or more photo(s) was virtually staged.
-
2019-04-17soldstatus $1,305,000
-
2018-03-14soldstatus $912,000
-
2016-03-15soldstatus $51,000
-
2013-03-20soldstatus $45,000
-
2009-04-22soldstatus $15,000
Show marketing remark (94 chars)
Come make an offer on this ranch! Needs some TLC but good bones. Sold as-is, no disclosures.
-
2008-09-16$25,000
Show marketing remark (94 chars)
Come make an offer on this ranch! Needs some TLC but good bones. Sold as-is, no disclosures.
-
2004-09-09soldstatus $140,000
-
1991-01-16soldstatus $46,000
ⓘ Source: listings_history table (triggers on properties + properties_extension) + one-shot
backfill from property_details.listing_events for pre-trigger history.
Tax reassessment forecast GA · Resets to sale price
- Current annual tax
- $3,736 · $311/mo
- Projected year-2 tax
- $3,736 · $311/mo
- Expected delta
- $0/yr ($0/mo · 0.0%)
ⓘ Screening estimate from a state-policy table — verify with the county assessor before closing.
Climate risk First Street
- Flood 1/10 Low FEMA zone X (unshaded) · 0% chance over 30 yrs
- Wildfire 1/10 Low
- Heat 5/10 Major 7 d/yr ≥104°F today · 17 d/yr by 30 yrs out
- Wind 5/10 Major 26% chance of damaging wind over 30 yrs
- Air quality 5/10 Major 6 unhealthy d/yr today · 8 by 30 yrs out
Nearby sold comps map
Loading sold comps map…
Walkable amenities ~0.75 mi
Loading nearby amenities…
Taxation est. · year 1
- Rental income
- $20,644
- − Mortgage interest
- −$11,539
- − Property taxes
- −$3,736
- − Insurance
- −$1,030
- − Repairs & maintenance
- −$1,651
- − Management
- −$1,651
- − Depreciation
- −$5,993
- Taxable loss
- −$4,957
- Est. tax savings @ 24.0%
- +$1,190
- After-tax cash flow
- $-231/yr
For passive investors: Depreciation is non-cash, so a rental often shows a tax loss while cash-flowing — sheltering income. Rental losses are passive: they offset passive income freely, and up to $25,000/yr can offset ordinary (W-2) income if you actively participate and your MAGI is under $100k (phasing out to $0 by $150k); unused losses carry forward. On sale, claimed depreciation is recaptured at up to 25%, and gains may owe capital-gains tax (a 1031 exchange can defer both). Figures are a year-1 estimate at your 24.0% rate — not tax advice; consult a CPA.
Schools (NCES district)
- District
- Dekalb County
- NCES district ID
- 1301740
- Math proficiency
- 19% ▼ -12.00%
- Reading proficiency
- 28% ▼ -7.00%
- Median HH income
- $51,448
- Composite
- 20.92/100
- National rank
- #8482
- State rank
- #125 of 174 in GA
Livability — Belvedere Park
- Score
- 68/100
- State rank
- #153
- US rank
- #9886
Category grades
Schools grade is shown separately in the Schools card above.
Census & demographics
- Census place
- Belvedere Park, GA
- County
- Dekalb County · 782,738 people
- City population
- 42,812
- Metro
- Atlanta-Sandy Springs-Alpharetta, GA
- Population (ZIP)
- 42,948
- Household income
- $62,765
- Rent vs Own
- Severe rent burden
- 2097.0
Population outlook (DeKalb County) Hauer SSP2
- Today (2025)
- 839,977 people
- By 2030
- 891,768 · +6.2%
- By 2040
- 988,894 · +17.7%
- By 2050
- 1,074,583 · +27.9%
- By 2075
- 1,245,026 · +48.2%
- By 2100
- 1,303,135 · +55.1%
Race, ethnicity, and origin ACS 2023
- Neighborhood character
- Predominantly Black (70%)
- Race & ethnicity
- Black 70% White 18% Two or more races 6% Hispanic / Latino 5% Asian 2%
- Hispanic origin (detail)
- Mexican 2%
- Common ancestry
- Slovak 1% Italian 1% Serbian 1%
- Foreign-born
- 7% · Canada, China, Guatemala
- Languages at home
- 91% English-only · Spanish 4% Arabic 1% Other Indo-European 0%
Political lean MEDSL · DeKalb
- 2024 margin
- Solid D (+64.8) · D 81.9% · R 17.1% · Other 1.0%
- 2008→2024 swing
- +6.1pp toward D · 2008: 58.6pp · 2024: 64.8pp
- All cycles
- 2024: D+64.8 2020: D+67.4 2016: D+64.8 2012: D+56.8 2008: D+58.6
Not yet ingested
- Civics
- —
Market trends
- HPI YoY
- ▼ -203.83%
- Current HPI
- 221.0467
- Rent YoY
- ▲ 1.34%
- Metro
- Atlanta-Sandy Springs-Alpharetta, GA
- State GDP YoY
- ▲ 2.66%
- F500 in state
- 28
Industry mix (Fortune 500 HQ in GA)
| Industry | F500 HQs | Revenue |
|---|---|---|
| Paper / Packaging | 2 | $29B |
|
||
| Retail | 1 | $160B |
|
||
| Transportation / Logistics | 1 | $91B |
|
||
| Airlines | 1 | $62B |
|
||
| Consumer Goods | 1 | $47B |
|
||
| Utilities | 1 | $25B |
|
||
Price history
+347.8% since first listed12 events — show timeline
- 2026-06-01 Pending — GAMLS
- 2026-06-01 Pending — FMLS
- 2026-04-23 Listed $206,000 FMLS
- 2026-04-23 Listed $206,000 GAMLS
- 2019-04-17 Sold (Public Records) $1,305,000 Public Records
- 2018-03-14 Sold (Public Records) $912,000 Public Records
- 2016-03-15 Sold (Public Records) $51,000 Public Records
- 2013-03-20 Sold (Public Records) $45,000 Public Records
- 2009-04-22 Sold (MLS) $15,000 FMLS
- 2008-09-16 Listed $25,000 FMLS
- 2004-09-09 Sold (Public Records) $140,000 Public Records
- 1991-01-16 Sold (Public Records) $46,000 Public Records
Property tax history
+3.9%/yrLatest (2025): $3,736 · +0.1% YoY. Source: county tax records.
Cash-flow waterfall
monthlySold comps — $/sqft
last 12 mo · ≤1 miLoading sold comps…