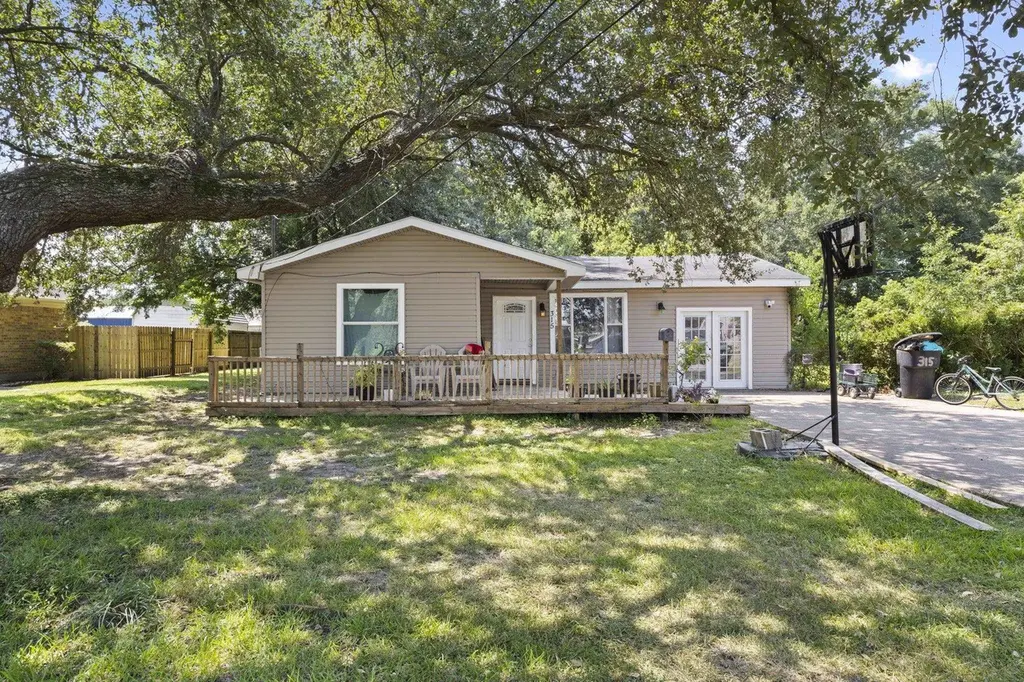
315 N 3rd St · Nederland, TX
Flood risk 4/10 · Minor
- FEMA flood zone
- —
- Chance of flooding over 30 yrs
- 0.23%
- Est. flood insurance / yr
- —
Fire risk 2/10 · Minimal
- Est. fire insurance / yr
- $1,222 – $2,270
Heat risk 9/10 · Severe
- Hot days now (above 109°F)
- 7 days/yr
- Hot days in 30 yrs
- 24 days/yr
Wind risk 9/10 · Severe
- Chance of severe wind over 30 yrs
- 99.0%
Air-quality risk 2/10 · Minimal
- Unhealthy air days now
- 1 days/yr
- Unhealthy air days in 30 yrs
- 1 days/yr
Risk factors via First Street. Map © Google.
Why this score? — see what drove the C grade
The composite is a weighted blend of 9 inputs, each scored 0–100. Each bar is that input's sub-score; the figure is the points it added to the 100-point composite (weight × sub-score).
- Cash flow +19.6/30.0
- ARV discount +11.3/15.0
- DSCR +6.2/10.0
- Rent growth +4.8/5.0
- 1% rule +4.6/10.0
- Schools +4.5/10.0
- Livability +3.8/5.0
- Condition / age +2.5/5.0
- Appreciation +0.0/10.0
$180,000
🖨 Deal sheet 📄 Offer letter ✓ Due diligence
Listing remarks
Great investment opportunity in the highly-sought Nederland ISD! Spacious 3 bedroom, 2 bath home + an additional 50 x 140 lot. Front porch wooden deck. Split bedroom floor plan. Large primary bedroom with full bath and walk-in closet. Indoor utility room. Spacious patio area overlooking the backyard. Zoned for Highland Park Elementary and Central Middle School. SELLER WILLING TO CONSIDER ALL OFFERS!
Key facts
- Spacious patio area
- Indoor utility room
- 0.32 acre lot
Tags
Property features AI
Exterior
- Utilities: Public water; Public sewer
- Home design: Single-family residence; Residential property
- Construction: Vinyl siding
- Exterior features: Composition roof; Public maintained road; Storage structure on the property
Interior
- Kitchen: Includes dishwasher
- Flooring: Carpet; Vinyl
- Bathrooms: 2 full bathrooms
- Heating & cooling: Central heating (natural gas); Central air conditioning
- Interior features: Dishwasher
Neighborhood map
What this means for you Summary
Snapshot
- This is a 3-bed/2.0-bath single-family listed at $180k.
Deal economics
- At list price, monthly cash flow is $207 ($2k/yr) — positive.
- The deal already cash-flows at list — no discount required.
- To meet the 1% rule (rent ≥ 1% of price), the offer needs to be $172k (4.3% below list).
- Recommended offer: $172k (4.3% below list) — sets the bar for 1% rule.
- Cap rate 7.7% vs local median 4.6% in Nederland — top-decile yield for the area; either an underpriced asset or a hidden risk that comps aren't pricing in. Stress-test before assuming the spread holds.
Location & tenants
- Location reads 75/100 on livability (#129 in TX, #3,906 nationally) — a middle-class / working-renter tenant base. Strengths: employment A+, cost of living A+, housing A+; Watch: amenities F, commute F.
- Nederland ISD (suburban): math 51% / reading 52% proficiency, ranked #138 of 826 in TX (top 17%) — acceptable for families but not a draw, mixed tenant base, ~2y average lease.
- Market conditions: Rents rising fast (+9.3%/yr); 111 active listings in the ZIP; 8 comparable units currently listed for rent nearby; rentals at typical pace (median 23d on market — plan ~3-4 weeks tenant-placement turnaround); solid renter incomes; 343 units permitted in Jefferson County in 2024 (0 in 5+ unit buildings).
Forward outlook
- Local home prices are declining (-3.0%/yr); year-one equity from $1k of loan paydown is wiped out by about $5k of value loss. Plan a longer hold.
- At projected returns (-3.0% appreciation + 8.0% rent growth), your $50k cash investment doubles in ~10 years — after that, you're playing with house money.
Negotiation context
- It's been on market 30 days — a 2% lower offer ($177k) is reasonable based on typical stale-listing flexibility.
- 2 sale attempts; this cycle's ask has dropped $10k (5%) from the opening price — seller is motivated, your offer sets the floor, not the list.
- Current owner paid $89k; list at $180k implies a 102% gain — meaningful room to come down on a strong offer.
Risks & watch-outs
- Climate carrying-cost: severe wind risk, 99% chance of damaging wind over 30y; extreme-heat days projected 7→24/yr by 2055 (HVAC capex compounding) — expect insurance premiums to compound above CPI over the hold.
Questions for the listing agent
- Built in 1962 — when were the roof, HVAC, electrical panel, plumbing, and water heater last replaced?
- Is there a deadline driving the sale (1031 exchange, divorce, estate, relocation)? That informs how much negotiation room exists.
- Schools are A-rated — typically a magnet for longer-tenancy family renters. What's the average tenant stay here, and is there a school-zone premium baked into asking?
- What's the average days-on-market for RENTAL listings here right now (not sales)? A rising rental-DOM trend means longer vacancies and softer asking-rent achievability than the comps imply.
- What's the recent tenant-quality profile in this submarket — average credit score on applications, eviction rate, late-payment / NSF rate, and stable-employment percentage? A property-management company in the area should have these aggregated.
- How much new for-sale + rental construction is in the pipeline within 1–3 miles? Heavy new supply typically softens prices + rents 12–24 months out; constrained supply supports both.
Investment metrics
- 1% rule
- 0.96% ✗
- Cap rate
- 7.67%
- Cash-on-cash
- 4.92%
- DSCR
- 1.22
- GRM
- 8.7
CMA / ARV
- ARV (on-the-fly)
- $196,560
- Comps found
- 12
Show comp detail 12 sales within ~0.75 mi
| Address | Dist | Beds/Ba | Sqft | Sold | Price | $/sf | Match |
|---|---|---|---|---|---|---|---|
| 522 Boston Ave | 0.18mi | 3/2.0 | 1,662 (+6%) | 12mo | $299,900 | $180 | 71 |
| 211 S 5 1/2 St | 0.31mi | 3/2.5 | 1,425 (-9%) | 11mo | $265,000 | $186 | 60 |
| 116 S 4th 1/2 St | 0.25mi | 3/2.0 | 1,352 (-13%) | 14mo | $169,900 | $126 | 54 |
| 412 S 4th 1/2 St | 0.40mi | 4/2.0 (+1) | 1,368 (-12%) | 3mo | $164,900 | $121 | 54 |
| 2113 2nd St | 0.67mi | 3/2.0 | 1,660 (+6%) | 6mo | $135,000 | $81 | 53 |
| 2234 6th St | 0.73mi | 3/2.0 | 1,607 (+3%) | 13mo | $179,900 | $112 | 50 |
| 204 S 2 1/2 St | 0.32mi | 3/1.0 | 1,406 (-10%) | 19mo | $192,500 | $137 | 49 |
| 307 S 3rd St | 0.33mi | 4/2.0 (+1) | 1,368 (-12%) | 18mo | $160,000 | $117 | 44 |
| 623 S 8th St | 0.64mi | 3/2.0 | 1,384 (-11%) | 10mo | $178,500 | $129 | 42 |
| 2233 5th St | 0.69mi | 4/1.0 (+1) | 1,606 (+3%) | 16mo | $189,900 | $118 | 41 |
| 603 S 2nd St | 0.52mi | 3/1.5 | 1,752 (+12%) | 15mo | $190,000 | $108 | 41 |
| 708 S 5th 1/2 St | 0.61mi | 3/2.0 | 1,788 (+15%) | 13mo | $279,900 | $157 | 36 |
Match score weights: distance 35% · size 25% · config 20% · recency 20%. Top-matched comps best support the ARV.
Projected returns pro-forma
-3.0% appreciation · 8.0% rent growth · sell at horizon
- IRR
- -3.5%
- Equity multiple
- 0.86×
- Total profit
- $-6,938
- Equity at exit
- $26,839
- IRR
- 10.9%
- Equity multiple
- 2.04×
- Total profit
- $52,206
- Equity at exit
- $15,563
Cash invested: $50,400 (down + closing). Projections, not guarantees.
Landlord ↔ Tenant lean methodology
- Overall (STATE)
- 87 Strongly Landlord-Friendly
- State Texas
- 87 Strongly Landlord-Friendly · R+5
- County
- — inherits STATE
- City
- — inherits STATE
ZIP-level market 77627
- Rents YoY
- 9.3%
- Active inventory
- 111
- Price-to-rent
- 8.7×
Monthly cashflow live
- Estimated rent
- $1,722 high interval (Pro) →
- Mortgage (P&I)
- −$944
- Tax from tax record
- −$135 /mo · $1,620/yr
- Insurance
- −$75
- HOA
- −$0
- Vacancy / Maint / Mgmt
- −$362
- Net cashflow
- $207
Break-even live
UW: 25.0% down · 7.5% · 30yr · 1.5% tax · 5.0% vac · 8.0% maint · 8.0% mgmt
Financing live
Cash to close
- Down payment
- $45,000
- Closing costs
- $5,400
- Reserves months
- —
- Total cash needed
- —
Loan-product check · same deal, 3 products live
Conventional
25% down · 7.5% · 30yr
- Down + closing
- —
- Monthly P&I
- —
- Monthly cashflow
- —
- DSCR
- —
- Eligible?
- —
Personal DTI + credit; lowest rate.
DSCR
20% down · 8.5% · 30yr
- Down + closing
- —
- Monthly P&I
- —
- Monthly cashflow
- —
- DSCR
- —
- Eligible?
- —
No personal income docs; deal must DSCR.
Hard money
10% down · 12.0% · 12mo
- Down + closing
- —
- Monthly P&I
- —
- Monthly cashflow
- —
- DSCR
- —
- Eligible?
- —
Short-term bridge; refi at stabilization.
Rent comps 8 comps
| Address | Beds | Baths | Sqft | Rent | $/sqft | DOM | Units | Dist |
|---|---|---|---|---|---|---|---|---|
| 311 Nederland Ave Nederland, TX | 3.0 | 2.0 | 1360 | $1,890 | $1.39 | 13d | 1 | 0.21mi |
| 304 Avenue E Nederland, TX | 3.0 | 2.0 | 1511 | $1,900 | $1.26 | 13d | 1 | 0.47mi |
| 1815 Helena Ave Nederland, TX | 3.0 | 2.0 | 1248 | $1,750 | $1.40 | 23d | 1 | 1.23mi |
| 1619 Avenue G Unit G Nederland, TX | 3.0 | 1.5 | 1100 | $1,750 | $1.59 | 23d | 1 | 1.32mi |
| 1107 S 16th St Unit 1 Nederland, TX | 2.0 | 1.0 | 1395 | $1,250 | $0.90 | 13d | 1 | 1.33mi |
| 2125 Avenue A Unit A Nederland, TX | 3.0 | 2.0 | 1200 | $1,600 | $1.33 | 23d | 1 | 1.44mi |
| 2125 Avenue A Unit A Nederland, TX | 3.0 | 2.0 | 1200 | $1,600 | $1.33 | 44d | 1 | 1.44mi |
| 2125 Avenue A Unit A Nederland, TX | 3.0 | 2.0 | 1175 | $1,600 | $1.36 | 13d | 1 | 1.44mi |
Listing history 20 events
-
2026-06-18days on market $180,000 Active 30 DOM
-
2026-06-17days on market $180,000 Active 29 DOM
-
2026-06-16days on market $180,000 Active 28 DOM
-
2026-06-15days on market $180,000 Active 27 DOM
-
2026-06-14days on market $180,000 Active 25 DOM
-
2026-06-13days on market $180,000 Active 24 DOM
-
2026-06-10days on market $180,000 Active 22 DOM
-
2026-06-09days on market $180,000 Active 21 DOM
-
2026-06-08days on market $180,000 Active 20 DOM
-
2026-06-07days on market $180,000 Active 19 DOM
-
2026-06-05pricedays on market $180,000 Active 16 DOM
-
2026-06-03days on market $190,000 Active 15 DOM
-
2026-06-02days on market $190,000 Active 14 DOM
-
2026-06-01days on market $190,000 Active 13 DOM
-
2026-05-31days on market $190,000 Active 12 DOM
-
2026-05-30days on market $190,000 Active 11 DOM
-
2026-05-19$190,000 Active
-
2025-10-31price $195,000
-
2025-09-17$200,000 Active
-
2009-09-28soldstatus $89,280
ⓘ Source: listings_history table (triggers on properties + properties_extension) + one-shot
backfill from property_details.listing_events for pre-trigger history.
Tax reassessment forecast TX · Resets to sale price
- Current annual tax
- $1,620 · $135/mo
- Projected year-2 tax
- $3,294 · $274/mo
- Expected delta
- +$1,674/yr (+$140/mo · 103.4%)
ⓘ Screening estimate from a state-policy table — verify with the county assessor before closing.
Climate risk First Street
- Flood 4/10 Moderate 23% chance over 30 yrs
- Wildfire 2/10 Low
- Heat 9/10 Extreme 7 d/yr ≥109°F today · 24 d/yr by 30 yrs out
- Wind 9/10 Extreme 99% chance of damaging wind over 30 yrs
- Air quality 2/10 Low 1 unhealthy d/yr today · 1 by 30 yrs out
Nearby sold comps map
Loading sold comps map…
Walkable amenities ~0.75 mi
Loading nearby amenities…
Taxation est. · year 1
- Rental income
- $20,666
- − Mortgage interest
- −$10,083
- − Property taxes
- −$1,620
- − Insurance
- −$900
- − Repairs & maintenance
- −$1,653
- − Management
- −$1,653
- − Depreciation
- −$5,236
- Taxable loss
- −$479
- Est. tax savings @ 24.0%
- +$115
- After-tax cash flow
- $2,594/yr
For passive investors: Depreciation is non-cash, so a rental often shows a tax loss while cash-flowing — sheltering income. Rental losses are passive: they offset passive income freely, and up to $25,000/yr can offset ordinary (W-2) income if you actively participate and your MAGI is under $100k (phasing out to $0 by $150k); unused losses carry forward. On sale, claimed depreciation is recaptured at up to 25%, and gains may owe capital-gains tax (a 1031 exchange can defer both). Figures are a year-1 estimate at your 24.0% rate — not tax advice; consult a CPA.
Schools (NCES district)
- District
- Nederland ISD
- NCES district ID
- 4832280
- Math proficiency
- 51% ▼ -3.00%
- Reading proficiency
- 52% ▼ -3.00%
- Median HH income
- $59,647
- Composite
- 44.95/100
- National rank
- #2709
- State rank
- #138 of 826 in TX
Livability — Nederland
- Score
- 75/100
- State rank
- #129
- US rank
- #3906
Category grades
Schools grade is shown separately in the Schools card above.
Census & demographics
- Census place
- Nederland, TX
- County
- Jefferson County · 203,592 people
- City population
- 22,357
- Metro
- Beaumont-Port Arthur, TX
- Population (ZIP)
- 22,357
- Household income
- $78,001
- Rent vs Own
- Severe rent burden
- 572.0
Population outlook (Jefferson County) Hauer SSP2
- Today (2025)
- 259,015 people
- By 2030
- 260,685 · +0.6%
- By 2040
- 263,309 · +1.7%
- By 2050
- 265,237 · +2.4%
- By 2075
- 270,193 · +4.3%
- By 2100
- 255,628 · -1.3%
Race, ethnicity, and origin ACS 2023
- Neighborhood character
- Predominantly White (78%)
- Race & ethnicity
- White 78% Hispanic / Latino 12% Two or more races 8% Black 4% Asian 3%
- Hispanic origin (detail)
- Mexican 8%
- Common ancestry
- Lithuanian 10% Slovak 3% Italian 2%
- Foreign-born
- 5% · Canada, Vietnam
- Languages at home
- 87% English-only · Spanish 8% Other Indo-European 1% Vietnamese 1%
Political lean MEDSL · Jefferson
- 2024 margin
- Lean R (+8.9) · D 45.1% · R 54.0%
- 2008→2024 swing
- -11.1pp toward R · 2008: 2.2pp · 2024: -8.9pp
- All cycles
- 2024: R+8.9 2020: R+1.6 2016: R+0.5 2012: D+1.6 2008: D+2.2
Not yet ingested
- Civics
- —
Market trends
- HPI YoY
- ▼ -228.91%
- Current HPI
- 176.2132
- Rent YoY
- ▲ 9.27%
- Metro
- Beaumont-Port Arthur, TX
- State GDP YoY
- ▲ 3.95%
- F500 in state
- 110
Industry mix (Fortune 500 HQ in TX)
| Industry | F500 HQs | Revenue |
|---|---|---|
| Energy | 16 | $1,198B |
|
||
| Technology | 5 | $198B |
|
||
| Engineering / Construction | 4 | $72B |
|
||
| Energy Services | 3 | $60B |
|
||
| Utilities | 3 | $41B |
|
||
| Healthcare | 2 | $330B |
|
||
Price history
+112.8% since first listed4 events — show timeline
- 2026-05-19 Listed $190,000 BBOR
- 2025-10-31 Price Changed $195,000 BBOR
- 2025-09-17 Listed $200,000 BBOR
- 2009-09-28 Sold (Public Records) $89,280 Public Records
Property tax history
+0.7%/yrLatest (2020): $1,620 · -35.2% YoY. Source: county tax records.
Cash-flow waterfall
monthlySold comps — $/sqft
last 12 mo · ≤1 miLoading sold comps…