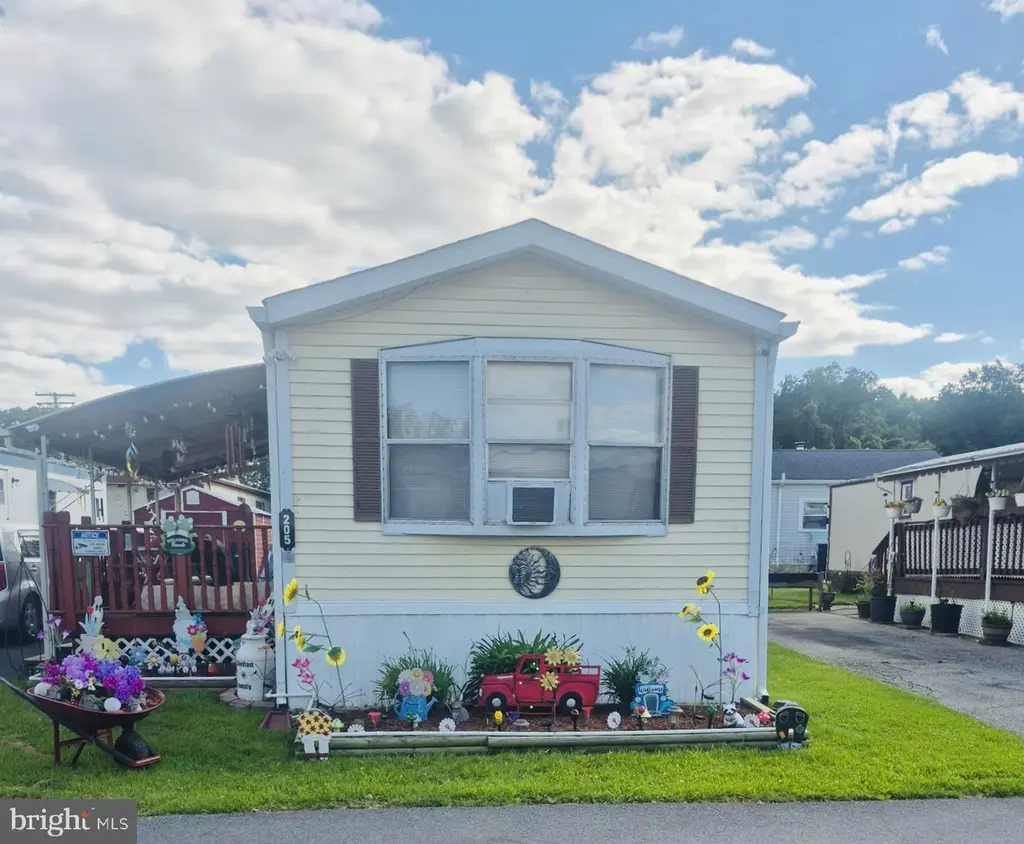
205 Robwood Rd · Dundalk, MD
Flood risk No data
- FEMA flood zone
- —
- Chance of flooding over 30 yrs
- —
- Est. flood insurance / yr
- —
Fire risk No data
- Est. fire insurance / yr
- —
Heat risk No data
- Hot days now (above threshold)
- —
- Hot days in 30 yrs
- —
Wind risk No data
- Chance of severe wind over 30 yrs
- —
Air-quality risk No data
- Unhealthy air days now
- —
- Unhealthy air days in 30 yrs
- —
Risk factors via First Street. Map © Google.
Why this score? — see what drove the B- grade
The composite is a weighted blend of 9 inputs, each scored 0–100. Each bar is that input's sub-score; the figure is the points it added to the 100-point composite (weight × sub-score).
- Cash flow +30.0/30.0
- 1% rule +10.0/10.0
- DSCR +10.0/10.0
- ARV discount +7.5/15.0
- Livability +4.2/5.0
- Rent growth +2.5/5.0
- Condition / age +2.5/5.0
- Schools +2.3/10.0
- Appreciation +0.0/10.0
$50,000
🖨 Deal sheet 📄 Offer letter ✓ Due diligence
Listing remarks MLS
Clean, quiet community. Close to 695 and 95, key Bridge. Lots of shopping nearby.
Key facts
- Single-level living
- Convenient location
- Off-street parking
Tags
Property features AI
Finance
- Other: Ownership interest: Ground Rent
- Financial info: Ground rent: $960 per month (annualized in income/expense list)
Exterior
- Parking: Driveway parking; Off-street parking
- Utilities: Public water; Public sewer; Electric service for heating, cooling, and hot water
- Home design: Manufactured home; Vinyl siding
- Construction: Vinyl siding exterior; Other type of foundation; Above-grade structures present
- Exterior features: Not in a federal flood zone; Ground rent exists (paid monthly)
Interior
- Bedrooms: Two bedrooms on the main level
- Bathrooms: One full bathroom on the main level; One half bathroom on the main level; Total: one full and one half bathroom
- Heating & cooling: Heat pump with electric backup; Electric heating fuel; Central air conditioning (electric); Electric hot water
- Interior features: Estimated living area; No basement; Level entry to main level; Doors with lever handles; Doors swing in; Accessible 32+ inch wide doorways; Multiple access/egress points (2+ exits)
Neighborhood map
What this means for you Summary
Snapshot
- This is a 2-bed/1.5-bath manufactured listed at $50k.
Deal economics
- At list price, monthly cash flow is $1k ($13k/yr) — positive.
- The deal already cash-flows at list — no discount required.
- Meets the 1% rule at list price ($2k rent vs $50k).
- Recommended offer: $49k (1.5% below list) — sets the bar for market timing.
- Cap rate 31.8% vs local median 6.2% in Dundalk — top-decile yield for the area; either an underpriced asset or a hidden risk that comps aren't pricing in. Stress-test before assuming the spread holds.
Location & tenants
- Location reads 85/100 on livability (#16 in MD, #510 nationally) — a professional / high-income tenant draw. Strengths: amenities A+, commute A+, housing A+; Watch: crime F.
- Baltimore County Public Schools (suburban): math 15% / reading 34% proficiency, ranked #11 of 24 in MD (top 46%) — low school quality limits family demand, transient renter base, plan for 1-2y turnover.
- Zoned schools: Sparrows Point High (math 18% / reading 53%, grade F, #144 of 222 statewide, top 65%, 1,146 students, 44% FRL).
- Market conditions: Rents soft (-0.1%/yr); 236 active listings in the ZIP; 14 comparable units currently listed for rent nearby; rentals leasing fast (median 13d on market — plan ~1-2 weeks tenant-placement turnaround); 1,511 units permitted in Baltimore County in 2024 (643 in 5+ unit buildings).
- This rent runs 33% of the median local income ($64k/yr) — at the standard rent-burdened threshold; future hikes will face affordability resistance.
Forward outlook
- Local home prices are declining (-3.0%/yr); year-one equity from $346 of loan paydown is wiped out by about $2k of value loss. Plan a longer hold.
- Baltimore County population projected at +12% by 2050 — modest demand growth; plan on rents tracking national, not racing it.
- At projected returns (-3.0% appreciation + 0.0% rent growth), your $14k cash investment doubles in ~2 years — after that, you're playing with house money.
Negotiation context
- It's been on market 18 days — a 2% lower offer ($49k) is reasonable based on typical stale-listing flexibility.
- 4 sale attempts since 14y ago with the ask held roughly flat each time — persistent listings suggest the price (not the market) is what's stuck; bring a comps-based counter.
Questions for the listing agent
- Is there a deadline driving the sale (1031 exchange, divorce, estate, relocation)? That informs how much negotiation room exists.
- Schools are A-rated — typically a magnet for longer-tenancy family renters. What's the average tenant stay here, and is there a school-zone premium baked into asking?
- Crime grade is F in this area — have there been break-ins, vandalism, or insurance claims at this property in the last 3 years? What carrier currently insures it and at what premium?
- What's the average days-on-market for RENTAL listings here right now (not sales)? A rising rental-DOM trend means longer vacancies and softer asking-rent achievability than the comps imply.
- What's the recent tenant-quality profile in this submarket — average credit score on applications, eviction rate, late-payment / NSF rate, and stable-employment percentage? A property-management company in the area should have these aggregated.
- How much new for-sale + rental construction is in the pipeline within 1–3 miles? Heavy new supply typically softens prices + rents 12–24 months out; constrained supply supports both.
Investment metrics
- 1% rule
- 3.57% ✓
- Cap rate
- 31.84%
- Cash-on-cash
- 91.23%
- DSCR
- 5.06
- GRM
- 2.3
CMA / ARV
No comps found within radius.
Projected returns pro-forma
-3.0% appreciation · 0.0% rent growth · sell at horizon
- IRR
- 88.5%
- Equity multiple
- 4.89×
- Total profit
- $54,487
- Equity at exit
- $7,455
- IRR
- 90.9%
- Equity multiple
- 9.19×
- Total profit
- $114,636
- Equity at exit
- $4,323
Cash invested: $14,000 (down + closing). Projections, not guarantees.
Landlord ↔ Tenant lean methodology
- Overall (STATE)
- 27 Tenant-Leaning
- State Maryland
- 27 Tenant-Leaning · D+14
- County
- — inherits STATE
- City
- — inherits STATE
ZIP-level market 21222
- Rents YoY
- -0.1%
- Active inventory
- 236
- Price-to-rent
- 2.3×
Monthly cashflow live
- Estimated rent
- $1,785 high interval (Pro) →
- Mortgage (P&I)
- −$262
- Tax est. 1.5%
- −$62 /mo · $750/yr
- Insurance
- −$21
- HOA
- −$0
- Vacancy / Maint / Mgmt
- −$375
- Net cashflow
- $1,064
Break-even live
UW: 25.0% down · 7.5% · 30yr · 1.5% tax · 5.0% vac · 8.0% maint · 8.0% mgmt
Financing live
Cash to close
- Down payment
- $12,500
- Closing costs
- $1,500
- Reserves months
- —
- Total cash needed
- —
Loan-product check · same deal, 3 products live
Conventional
25% down · 7.5% · 30yr
- Down + closing
- —
- Monthly P&I
- —
- Monthly cashflow
- —
- DSCR
- —
- Eligible?
- —
Personal DTI + credit; lowest rate.
DSCR
20% down · 8.5% · 30yr
- Down + closing
- —
- Monthly P&I
- —
- Monthly cashflow
- —
- DSCR
- —
- Eligible?
- —
No personal income docs; deal must DSCR.
Hard money
10% down · 12.0% · 12mo
- Down + closing
- —
- Monthly P&I
- —
- Monthly cashflow
- —
- DSCR
- —
- Eligible?
- —
Short-term bridge; refi at stabilization.
Rent comps 14 comps
| Address | Beds | Baths | Sqft | Rent | $/sqft | DOM | Units | Dist |
|---|---|---|---|---|---|---|---|---|
| 3427 North Point Rd Dundalk, MD | 3.0 | 1.0 | 1008 | $2,250 | $2.23 | 20d | 1 | 0.67mi |
| 3413 Wallford Dr Dundalk, MD | 3.0 | 2.0 | 1016 | $2,000 | $1.97 | 44d | 1 | 0.71mi |
| 4004 St Monica Dr Unit 1 Dundalk, MD | 3.0 | 1.0 | 1024 | $1,895 | $1.85 | 5d | 1 | 0.85mi |
| 4004 Saint Monica Dr Dundalk, MD | 3.0 | 1.0 | 1024 | $1,925 | $1.88 | 5d | 1 | 0.85mi |
| 3221 Wallford Dr Dundalk, MD | 3.0 | 1.0 | 1008 | $1,750 | $1.74 | 3d | 1 | 0.87mi |
| 3221 Wallford Dr Unit 3221 Dundalk, MD | 3.0 | 1.0 | 1008 | $1,750 | $1.74 | 5d | 1 | 0.87mi |
| 7860 Saint Claire Ln Dundalk, MD | 3.0 | 2.0 | 1024 | $2,200 | $2.15 | 5d | 1 | 0.92mi |
| 7851 Saint Fabian Ln Dundalk, MD | 3.0 | 1.0 | 1024 | $1,595 | $1.56 | 44d | 1 | 1.01mi |
| 1610 Melbourne Rd Dundalk, MD | 1.0–2.0 | 1.0 | 664 | $1,240 | $1.87 | 12d | 1 | 1.10mi |
| 3000 Wallford Dr Dundalk, MD | 1.0–2.0 | 1.0 | 717 | $1,330 | $1.85 | 3d | 35 | 1.11mi |
| 7 Robinson Ave Dundalk, MD | 3.0 | 2.0 | 1100 | $2,600 | $2.36 | 44d | 1 | 1.22mi |
| 909 S Marlyn Ave Essex, MD | 2.0–3.0 | 1.0–1.5 | 888 | $1,375 | $1.55 | 5d | 1 | 1.29mi |
| 311 Wise Ave Dundalk, MD | 1.0 | 1.0 | 818 | $1,045 | $1.28 | 44d | 1 | 1.35mi |
| 11 Seabright Ave Dundalk, MD | 3.0 | 1.0 | 948 | $1,874 | $1.98 | 15d | 1 | 1.41mi |
Listing history 10 events
-
2026-06-18days on market $50,000 Active 18 DOM
-
2026-06-17days on market $50,000 Active 17 DOM
-
2026-06-16days on market $50,000 Active 16 DOM
-
2026-06-15days on market $50,000 Active 15 DOM
-
2026-06-13days on market $50,000 Active 13 DOM
-
2026-06-09days on market $50,000 Active 9 DOM
-
2026-06-08days on market $50,000 Active 8 DOM
-
2026-06-07days on market $50,000 Active 7 DOM
-
2026-06-04days on market $50,000 Active 4 DOM
-
2026-06-03$50,000 Active 3 DOM
ⓘ Source: listings_history table (triggers on properties + properties_extension) + one-shot
backfill from property_details.listing_events for pre-trigger history.
Nearby sold comps map
Loading sold comps map…
Walkable amenities ~0.75 mi
Loading nearby amenities…
Taxation est. · year 1
- Rental income
- $21,417
- − Mortgage interest
- −$2,801
- − Property taxes
- −$750
- − Insurance
- −$250
- − Repairs & maintenance
- −$1,713
- − Management
- −$1,713
- − Depreciation
- −$1,455
- Taxable income
- $12,735
- Est. tax owed @ 24.0%
- −$3,056
- After-tax cash flow
- $9,717/yr
For passive investors: Depreciation is non-cash, so a rental often shows a tax loss while cash-flowing — sheltering income. Rental losses are passive: they offset passive income freely, and up to $25,000/yr can offset ordinary (W-2) income if you actively participate and your MAGI is under $100k (phasing out to $0 by $150k); unused losses carry forward. On sale, claimed depreciation is recaptured at up to 25%, and gains may owe capital-gains tax (a 1031 exchange can defer both). Figures are a year-1 estimate at your 24.0% rate — not tax advice; consult a CPA.
Schools (NCES district)
- District
- Baltimore County Public Schools
- NCES district ID
- 2400120
- Math proficiency
- 15% ▼ -16.00%
- Reading proficiency
- 34% ▼ -5.00%
- Median HH income
- $66,746
- Composite
- 23.17/100
- National rank
- #7948
- State rank
- #11 of 24 in MD
Livability — Dundalk
- Score
- 85/100
- State rank
- #16
- US rank
- #510
Category grades
Schools grade is shown separately in the Schools card above.
Census & demographics
- Census place
- Dundalk, MD
- County
- Baltimore County · 769,527 people
- City population
- 59,407
- Metro
- Baltimore-Columbia-Towson, MD
- Population (ZIP)
- 59,407
- Household income
- $64,141
- Rent vs Own
- Severe rent burden
- 2566.0
Population outlook (Baltimore County) Hauer SSP2
- Today (2025)
- 885,518 people
- By 2030
- 909,272 · +2.7%
- By 2040
- 951,547 · +7.5%
- By 2050
- 990,955 · +11.9%
- By 2075
- 1,086,411 · +22.7%
- By 2100
- 1,135,078 · +28.2%
Race, ethnicity, and origin ACS 2023
- Neighborhood character
- Diverse neighborhood (Simpson 0.60)
- Race & ethnicity
- White 59% Black 18% Hispanic / Latino 15% Two or more races 7% Asian 2% Native American 1%
- Hispanic origin (detail)
- Mexican 3% Puerto Rican 2%
- Common ancestry
- Romanian 7% Lithuanian 1% Italian 1%
- Foreign-born
- 9% · Canada
- Languages at home
- 85% English-only · Spanish 11% Other Indo-European 2% Arabic 1%
Political lean MEDSL · Baltimore
- 2024 margin
- Strong D (+24.5) · D 61.0% · R 36.5% · Other 2.5%
- 2008→2024 swing
- +9.9pp toward D · 2008: 14.6pp · 2024: 24.5pp
- All cycles
- 2024: D+24.5 2020: D+27.0 2016: D+17.4 2012: D+16.4 2008: D+14.6
Not yet ingested
- Civics
- —
Market trends
- HPI YoY
- ▼ -251.44%
- Current HPI
- 228.4218
- Rent YoY
- ▼ -0.09%
- Metro
- Baltimore-Columbia-Towson, MD
- State GDP YoY
- ▲ 2.97%
- F500 in state
- 12
Industry mix (Fortune 500 HQ in MD)
| Industry | F500 HQs | Revenue |
|---|---|---|
| Aerospace / Defense | 1 | $71B |
|
||
| Utilities | 1 | $25B |
|
||
| Hotels | 1 | $24B |
|
||
| Consumer Goods | 1 | $7B |
|
||
| Real Estate | 1 | $6B |
|
||
| Chemicals | 1 | $2B |
|
||
Price history
+257.1% since first listed8 events — show timeline
- 2026-05-31 Listed $50,000 BRIGHT MLS
- 2023-04-20 Sold (MLS) $65,000 BRIGHT MLS
- 2023-03-10 Listed $69,999 BRIGHT MLS
- 2013-02-13 Delisted — MRIS
- 2013-02-13 Listing Removed — BRIGHT MLS
- 2012-09-04 Price Changed — MRIS
- 2012-05-24 Listed — MRIS
- 2012-05-24 Listed $14,000 BRIGHT MLS
Cash-flow waterfall
monthlySold comps — $/sqft
last 12 mo · ≤1 miLoading sold comps…