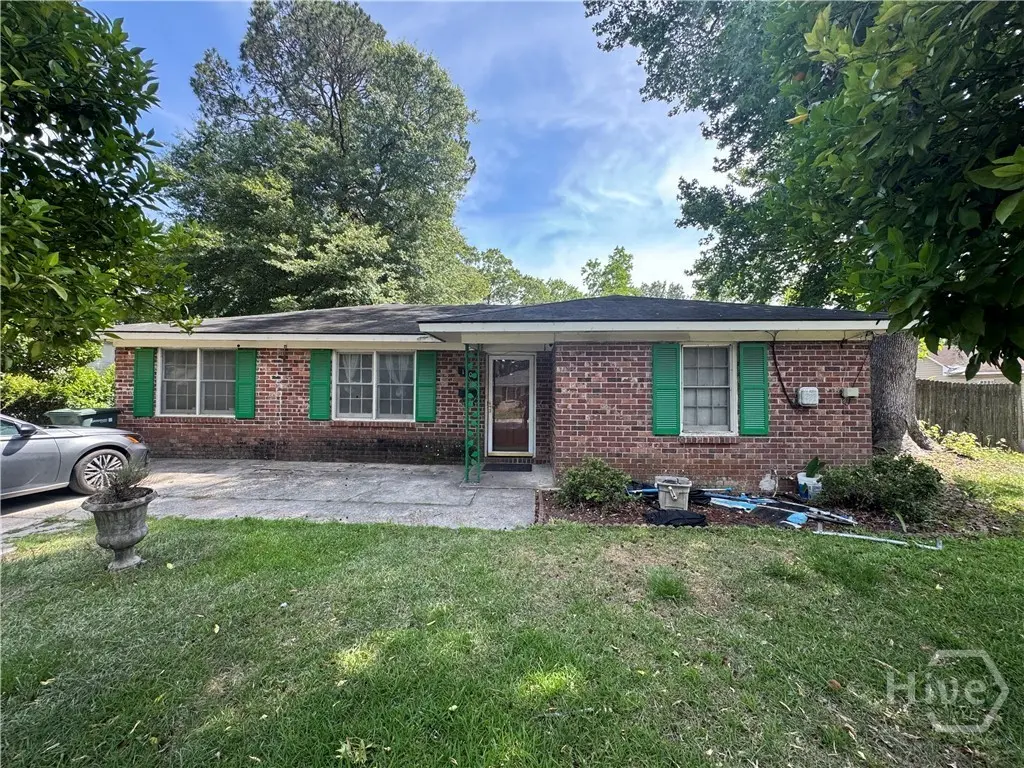
1301 E 70th St · Savannah, GA
Flood risk 4/10 · Minor
- FEMA flood zone
- X (unshaded)
- Chance of flooding over 30 yrs
- 0.21%
- Est. flood insurance / yr
- $507 – $1,088
Fire risk 1/10 · Minimal
- Est. fire insurance / yr
- $963 – $1,789
Heat risk 10/10 · Severe
- Hot days now (above 106°F)
- 7 days/yr
- Hot days in 30 yrs
- 18 days/yr
Wind risk 9/10 · Severe
- Chance of severe wind over 30 yrs
- 99.0%
Air-quality risk 2/10 · Minimal
- Unhealthy air days now
- 2 days/yr
- Unhealthy air days in 30 yrs
- 2 days/yr
Risk factors via First Street. Map © Google.
Why this score? — see what drove the C+ grade
The composite is a weighted blend of 9 inputs, each scored 0–100. Each bar is that input's sub-score; the figure is the points it added to the 100-point composite (weight × sub-score).
- Cash flow +22.6/30.0
- ARV discount +15.0/15.0
- DSCR +7.3/10.0
- 1% rule +5.4/10.0
- Livability +4.3/5.0
- Rent growth +3.4/5.0
- Condition / age +2.5/5.0
- Schools +2.0/10.0
- Appreciation +0.0/10.0
$205,000
🖨 Deal sheet 📄 Offer letter ✓ Due diligence
Listing remarks
Ranch home ready for its next owner or investors! Ideally situated on a spacious corner lot in Midtown Savannah, this property offers a convenient location with quick access to Truman Parkway, Downtown Savannah, and both Candler and Memorial Hospitals. Located just 2 blocks from Medical Arts, this home is perfect for those seeking convenience and accessibility. The 3 bedroom, 2 bath home features a recently replaced HVAC system and water heater, along with plenty of potential to make it your own. This property is being sold as-is and is offered in its current condition.
Key facts
- Convenient location
- Corner lot
- 8,015 sq ft lot
Tags
Property features AI
Exterior
- Parking: On-street parking
- Utilities: Public water; Public sewer
- Home design: Single family residence; 1 story
- Construction: Brick construction; Slab foundation
- Exterior features: Wood fencing; In-ground pool; Corner lot; Asphalt road (publicly maintained)
Interior
- Bathrooms: 2 full bathrooms
- Heating & cooling: Electric heating; Heat pump; Electric cooling; Heat pump cooling
- Interior features: Electric water heater; Has view
- Laundry & utility: Washer hookup
Neighborhood map
What this means for you Summary
Snapshot
- This is a 3-bed/1.0-bath single-family listed at $205k.
Deal economics
- At list price, monthly cash flow is $351 ($4k/yr) — positive.
- The deal already cash-flows at list — no discount required.
- Meets the 1% rule at list price ($2k rent vs $205k).
- Recommended offer: $202k (1.5% below list) — sets the bar for market timing.
- Cap rate 8.3% vs local median 4.0% in Savannah — top-decile yield for the area; either an underpriced asset or a hidden risk that comps aren't pricing in. Stress-test before assuming the spread holds.
Location & tenants
- Location reads 86/100 on livability (#1 in GA, #397 nationally) — a professional / high-income tenant draw. Strengths: crime A+, amenities A+, commute A+; Watch: employment D, schools F.
- Savannah-Chatham County (urban): math 20% / reading 26% proficiency, ranked #134 of 174 in GA (top 77%) — low school quality limits family demand, transient renter base, plan for 1-2y turnover.
- Market conditions: Rents rising (+3.6%/yr); 226 active listings in the ZIP; 40 comparable units currently listed for rent nearby; rentals at typical pace (median 24d on market — plan ~3-4 weeks tenant-placement turnaround); 42% of comp listings sitting > 30 days — soft ceiling on asking rent; 2,694 units permitted in Chatham County in 2024 (973 in 5+ unit buildings).
- At $2,135/mo this rent would consume 48% of the median local household income ($53k/yr) (locally 1649% of renters already pay >50% of income on rent) — very limited rent-growth headroom before tenants either downsize or default.
Forward outlook
- Local home prices are declining (-3.0%/yr); year-one equity from $1k of loan paydown is wiped out by about $6k of value loss. Plan a longer hold.
- Chatham County population projected at +33% by 2050 — long-run rental-demand tailwind backs the buy-and-hold thesis.
Negotiation context
- It's been on market 17 days — a 2% lower offer ($202k) is reasonable based on typical stale-listing flexibility.
- 5 sale attempts since 14y ago with the ask held roughly flat each time — persistent listings suggest the price (not the market) is what's stuck; bring a comps-based counter.
- Current owner paid $61k; list at $205k implies a 236% gain — meaningful room to come down on a strong offer.
Risks & watch-outs
- Climate carrying-cost: severe wind risk, 99% chance of damaging wind over 30y; extreme-heat days projected 7→18/yr by 2055 (HVAC capex compounding) — expect insurance premiums to compound above CPI over the hold.
Questions for the listing agent
- Built in 1964 — when were the roof, HVAC, electrical panel, plumbing, and water heater last replaced?
- Is there a deadline driving the sale (1031 exchange, divorce, estate, relocation)? That informs how much negotiation room exists.
- Schools are F-rated, which usually means shorter tenancies and higher turnover. Who's the typical renter profile here, and what's been the actual vacancy rate?
- What's the average days-on-market for RENTAL listings here right now (not sales)? A rising rental-DOM trend means longer vacancies and softer asking-rent achievability than the comps imply.
- What's the recent tenant-quality profile in this submarket — average credit score on applications, eviction rate, late-payment / NSF rate, and stable-employment percentage? A property-management company in the area should have these aggregated.
- How much new for-sale + rental construction is in the pipeline within 1–3 miles? Heavy new supply typically softens prices + rents 12–24 months out; constrained supply supports both.
Investment metrics
- 1% rule
- 1.04% ✓
- Cap rate
- 8.35%
- Cash-on-cash
- 7.33%
- DSCR
- 1.33
- GRM
- 8.0
CMA / ARV
- ARV (on-the-fly)
- $323,750
- Comps found
- 12
Show comp detail 12 sales within ~0.75 mi
| Address | Dist | Beds/Ba | Sqft | Sold | Price | $/sf | Match |
|---|---|---|---|---|---|---|---|
| 1107 Derenne Dr | 0.21mi | 3/2.0 | 1,331 (+3%) | 2mo | $333,000 | $250 | 80 |
| 1317 E 70th St | 0.09mi | 3/2.0 | 1,250 (-4%) | 8mo | $316,000 | $253 | 80 |
| 108 Walz Cir | 0.62mi | 3/1.5 | 1,314 (+2%) | 3mo | $295,000 | $225 | 64 |
| 1323 E 69th St | 0.12mi | 3/2.0 | 1,115 (-14%) | 7mo | $307,000 | $275 | 61 |
| 319 E Derenne Ave | 0.55mi | 3/2.0 | 1,290 (-0%) | 10mo | $379,900 | $294 | 61 |
| 347 Oxford Dr | 0.40mi | 3/1.0 | 1,460 (+13%) | 2mo | $347,500 | $238 | 59 |
| 128 Walz Cir | 0.74mi | 3/1.5 | 1,308 (+1%) | 4mo | $265,000 | $203 | 58 |
| 103 Pine Valley Rd | 0.68mi | 3/1.5 | 1,308 (+1%) | 10mo | $310,000 | $237 | 57 |
| 626 Mclaws St | 0.67mi | 3/2.0 | 1,236 (-5%) | 2mo | $315,000 | $255 | 55 |
| 507 E 63rd St | 0.67mi | 3/1.0 | 1,204 (-7%) | 3mo | $330,000 | $274 | 55 |
| 101 Timberline Dr | 0.68mi | 3/2.0 | 1,229 (-5%) | 9mo | $170,000 | $138 | 48 |
| 6 Redland Dr | 0.58mi | 3/2.0 | 1,133 (-12%) | 4mo | $201,500 | $178 | 45 |
Match score weights: distance 35% · size 25% · config 20% · recency 20%. Top-matched comps best support the ARV.
Projected returns pro-forma
-3.0% appreciation · 3.62% rent growth · sell at horizon
- IRR
- -4.4%
- Equity multiple
- 0.83×
- Total profit
- $-9,565
- Equity at exit
- $30,566
- IRR
- 5.9%
- Equity multiple
- 1.45×
- Total profit
- $25,924
- Equity at exit
- $17,725
Cash invested: $57,400 (down + closing). Projections, not guarantees.
Landlord ↔ Tenant lean methodology
- Overall (STATE)
- 90 Strongly Landlord-Friendly
- State Georgia
- 90 Strongly Landlord-Friendly · R+3
- County
- — inherits STATE
- City
- — inherits STATE
ZIP-level market 31404
- Rents YoY
- 3.6%
- Active inventory
- 226
- Price-to-rent
- 8.0×
Monthly cashflow live
- Estimated rent
- $2,135 high interval (Pro) →
- Mortgage (P&I)
- −$1,075
- Tax from tax record
- −$175 /mo · $2,105/yr
- Insurance
- −$85
- HOA
- −$0
- Vacancy / Maint / Mgmt
- −$448
- Net cashflow
- $351
Break-even live
UW: 25.0% down · 7.5% · 30yr · 1.5% tax · 5.0% vac · 8.0% maint · 8.0% mgmt
Financing live
Cash to close
- Down payment
- $51,250
- Closing costs
- $6,150
- Reserves months
- —
- Total cash needed
- —
Loan-product check · same deal, 3 products live
Conventional
25% down · 7.5% · 30yr
- Down + closing
- —
- Monthly P&I
- —
- Monthly cashflow
- —
- DSCR
- —
- Eligible?
- —
Personal DTI + credit; lowest rate.
DSCR
20% down · 8.5% · 30yr
- Down + closing
- —
- Monthly P&I
- —
- Monthly cashflow
- —
- DSCR
- —
- Eligible?
- —
No personal income docs; deal must DSCR.
Hard money
10% down · 12.0% · 12mo
- Down + closing
- —
- Monthly P&I
- —
- Monthly cashflow
- —
- DSCR
- —
- Eligible?
- —
Short-term bridge; refi at stabilization.
Rent comps 40 comps
| Address | Beds | Baths | Sqft | Rent | $/sqft | DOM | Units | Dist |
|---|---|---|---|---|---|---|---|---|
| 1301 E 67th St Savannah, GA | 3.0 | 2.0 | 1288 | $1,800 | $1.40 | 14d | 1 | 0.13mi |
| 1109 E 69th St Savannah, GA | 2.0 | 1.0 | 1120 | $1,800 | $1.61 | 23d | 1 | 0.19mi |
| 1207 E DeRenne Ave Savannah, GA | 3.0 | 1.0 | 946 | $1,695 | $1.79 | 21d | 1 | 0.23mi |
| 5416 Waters Dr Savannah, GA | 3.0 | 1.0 | 1723 | $2,000 | $1.16 | 23d | 1 | 0.35mi |
| 130 Andover Dr Savannah, GA | 3.0 | 2.0 | 1642 | $2,300 | $1.40 | 14d | 1 | 0.52mi |
| 317 Oxford Dr Savannah, GA | 3.0 | 2.0 | 1413 | $2,400 | $1.70 | 44d | 1 | 0.57mi |
| 317 Oxford Dr Savannah, GA | 3.0 | 2.0 | 1413 | $2,400 | $1.70 | 23d | 1 | 0.57mi |
| 1802 E 62nd St Savannah, GA | 4.0 | 2.0 | 1475 | $2,800 | $1.90 | 44d | 1 | 0.71mi |
| 30 Pine Valley Rd Savannah, GA | 3.0 | 1.0 | 1133 | $1,950 | $1.72 | 44d | 1 | 0.74mi |
| 637 Columbus Dr Savannah, GA | 3.0 | 2.0 | 1600 | $2,895 | $1.81 | 14d | 1 | 0.76mi |
| 1411 E 58th St Savannah, GA | 3.0 | 2.0 | 1100 | $1,900 | $1.73 | 23d | 1 | 0.78mi |
| 626 Columbus Dr Savannah, GA | 2.0 | 1.0 | 1350 | $1,975 | $1.46 | 23d | 1 | 0.81mi |
| 329 E 63rd St Savannah, GA | 3.0 | 2.0 | 1451 | $2,515 | $1.73 | 44d | 1 | 0.82mi |
| 6100 Waters Ave Savannah, GA | 1.0–2.0 | 1.0–2.0 | 950 | $1,558 | $1.64 | 14d | 7 | 0.87mi |
| 1815 E 58th St Savannah, GA | 3.0 | 2.0 | 1176 | $2,400 | $2.04 | 44d | 1 | 0.88mi |
| 2114 E 62nd St Savannah, GA | 3.0 | 1.5 | 920 | $1,995 | $2.17 | 14d | 1 | 0.92mi |
| 2114 E 62nd St Savannah, GA | 3.0 | 1.5 | 920 | $1,995 | $2.17 | 23d | 1 | 0.92mi |
| 206 Brandywine Rd Savannah, GA | 4.0 | 2.0 | 1691 | $3,100 | $1.83 | 44d | 1 | 0.92mi |
| 2345 Ranchland Dr Savannah, GA | 3.0 | 1.0 | 1098 | $2,100 | $1.91 | 14d | 1 | 0.93mi |
| 1901 E 57th St Savannah, GA | 3.0 | 1.0 | 1215 | $1,750 | $1.44 | 44d | 1 | 0.94mi |
| 1413 E 55th St Savannah, GA | 3.0 | 1.0 | 1100 | $2,500 | $2.27 | 44d | 1 | 0.95mi |
| 2337 Shirley Dr Savannah, GA | 3.0 | 2.0 | 1850 | $2,600 | $1.41 | 23d | 1 | 0.98mi |
| 135 E Derenne Ave Savannah, GA | 3.0 | 1.0 | 1245 | $2,095 | $1.68 | 44d | 1 | 1.00mi |
| 5545 Varn Dr Savannah, GA | 3.0 | 1.0 | 1403 | $2,195 | $1.56 | 23d | 1 | 1.02mi |
| 524 Jackson Blvd Savannah, GA | 3.0 | 2.0 | 1328 | $1,995 | $1.50 | 44d | 1 | 1.02mi |
| 105 E 66th St Savannah, GA | 3.0 | 3.0 | 1470 | $3,500 | $2.38 | 14d | 1 | 1.06mi |
| 309 E 58th St Savannah, GA | 3.0 | 2.0 | 1215 | $2,200 | $1.81 | 23d | 1 | 1.07mi |
| 2110 E 56th St Savannah, GA | 3.0 | 2.0 | 1140 | $2,200 | $1.93 | 44d | 1 | 1.11mi |
| 1534 E 53rd St Unit A Savannah, GA | 3.0 | 2.0 | 1606 | $2,950 | $1.84 | 23d | 1 | 1.11mi |
| 601 E 53rd St Unit 4 Savannah, GA | 2.0 | 1.0 | 950 | $1,800 | $1.89 | 44d | 1 | 1.14mi |
| 122 E 62nd St Savannah, GA | 1.0–2.0 | 1.0–2.5 | 832 | $2,595 | $3.12 | 14d | 24 | 1.16mi |
| 1405 E 51st St Savannah, GA | 3.0 | 2.0 | 1458 | $2,850 | $1.95 | 44d | 1 | 1.16mi |
| 1402 E 51st St Unit 1 Savannah, GA | 2.0 | 1.0 | 988 | $2,100 | $2.13 | 23d | 1 | 1.18mi |
| 120 E 61st St Savannah, GA | 4.0 | 4.0 | 1750 | $2,082 | $1.19 | 44d | 1 | 1.19mi |
| 2233 E De Renne Ave Savannah, GA | 4.0 | 2.0 | 1476 | $2,400 | $1.63 | 23d | 1 | 1.21mi |
| 3715 Skidaway Rd Savannah, GA | 3.0 | 2.0 | 1154 | $1,895 | $1.64 | 23d | 1 | 1.27mi |
| 5505 Betty Dr Savannah, GA | 3.0 | 2.0 | 1550 | $1,859 | $1.20 | 44d | 1 | 1.28mi |
| 5 Berkley Pl Savannah, GA | 2.0 | 2.0 | 1706 | $2,175 | $1.27 | 44d | 1 | 1.28mi |
| 51 Columbus Dr Apt 1 Savannah, GA | 2.0 | 1.0 | 960 | $1,600 | $1.67 | 14d | 1 | 1.29mi |
| 6803 Waters Ave Ph 05 Savannah, GA | 4.0 | 2.0 | 1680 | $2,150 | $1.28 | 44d | 1 | 1.30mi |
Listing history 23 events
-
2026-06-15statusdays on market $205,000 Pending 17 DOM
-
2026-06-14days on market $205,000 Active 16 DOM
-
2026-06-13days on market $205,000 Active 15 DOM
-
2026-06-10days on market $205,000 Active 13 DOM
-
2026-06-09days on market $205,000 Active 12 DOM
-
2026-06-08days on market $205,000 Active 11 DOM
-
2026-06-07days on market $205,000 Active 10 DOM
-
2026-06-05days on market $205,000 Active 7 DOM
-
2026-06-03days on market $205,000 Active 6 DOM
-
2026-06-02days on market $205,000 Active 5 DOM
-
2026-06-01days on market $205,000 Active 4 DOM
-
2026-05-31days on market $205,000 Active 3 DOM
-
2026-05-30days on market $205,000 Active 2 DOM
-
2026-05-28$205,000 Active
-
2024-07-21historical
-
2024-07-21historical
-
2024-07-08$210,000
-
2024-07-08$210,000
-
2024-02-08historical
-
2024-01-18$236,500
-
2013-05-01soldstatus $61,000
-
2012-07-11$60,000
-
1997-04-30soldstatus $60,000
ⓘ Source: listings_history table (triggers on properties + properties_extension) + one-shot
backfill from property_details.listing_events for pre-trigger history.
Tax reassessment forecast GA · Resets to sale price
- Current annual tax
- $2,105 · $175/mo
- Projected year-2 tax
- $2,105 · $175/mo
- Expected delta
- $0/yr ($0/mo · 0.0%)
ⓘ Screening estimate from a state-policy table — verify with the county assessor before closing.
Climate risk First Street
- Flood 4/10 Moderate FEMA zone X (unshaded) · 21% chance over 30 yrs
- Wildfire 1/10 Low
- Heat 10/10 Extreme 7 d/yr ≥106°F today · 18 d/yr by 30 yrs out
- Wind 9/10 Extreme 99% chance of damaging wind over 30 yrs
- Air quality 2/10 Low 2 unhealthy d/yr today · 2 by 30 yrs out
Nearby sold comps map
Loading sold comps map…
Walkable amenities ~0.75 mi
Loading nearby amenities…
Taxation est. · year 1
- Rental income
- $25,618
- − Mortgage interest
- −$11,483
- − Property taxes
- −$2,105
- − Insurance
- −$1,025
- − Repairs & maintenance
- −$2,049
- − Management
- −$2,049
- − Depreciation
- −$5,964
- Taxable income
- $942
- Est. tax owed @ 24.0%
- −$226
- After-tax cash flow
- $3,981/yr
For passive investors: Depreciation is non-cash, so a rental often shows a tax loss while cash-flowing — sheltering income. Rental losses are passive: they offset passive income freely, and up to $25,000/yr can offset ordinary (W-2) income if you actively participate and your MAGI is under $100k (phasing out to $0 by $150k); unused losses carry forward. On sale, claimed depreciation is recaptured at up to 25%, and gains may owe capital-gains tax (a 1031 exchange can defer both). Figures are a year-1 estimate at your 24.0% rate — not tax advice; consult a CPA.
Schools (NCES district)
- District
- Savannah-Chatham County
- NCES district ID
- 1301020
- Math proficiency
- 20% ▼ -11.00%
- Reading proficiency
- 26% ▼ -5.00%
- Median HH income
- $47,443
- Composite
- 20.14/100
- National rank
- #8639
- State rank
- #134 of 174 in GA
Livability — Savannah
- Score
- 86/100
- State rank
- #1
- US rank
- #397
Category grades
Schools grade is shown separately in the Schools card above.
Census & demographics
- Census place
- Savannah, GA
- County
- Chatham County · 271,602 people
- City population
- 216,564
- Metro
- Savannah, GA
- Population (ZIP)
- 30,062
- Household income
- $53,303
- Rent vs Own
- Severe rent burden
- 1649.0
Population outlook (Chatham County) Hauer SSP2
- Today (2025)
- 332,584 people
- By 2030
- 355,508 · +6.9%
- By 2040
- 400,030 · +20.3%
- By 2050
- 443,019 · +33.2%
- By 2075
- 534,579 · +60.7%
- By 2100
- 583,863 · +75.6%
Race, ethnicity, and origin ACS 2023
- Neighborhood character
- Majority Black (60%)
- Race & ethnicity
- Black 60% White 33% Two or more races 4% Hispanic / Latino 3% Asian 1%
- Common ancestry
- Romanian 2% Lithuanian 1% Slovak 1%
- Foreign-born
- 4% · Canada, Vietnam
- Languages at home
- 93% English-only · Spanish 3% Other Asian/Pacific 1% French/Haitian/Cajun 1%
Political lean MEDSL · Chatham
- 2024 margin
- D (+18.0) · D 58.6% · R 40.6%
- 2008→2024 swing
- +3.6pp toward D · 2008: 14.4pp · 2024: 18.0pp
- All cycles
- 2024: D+18.0 2020: D+18.8 2016: D+14.5 2012: D+12.0 2008: D+14.4
Not yet ingested
- Civics
- —
Market trends
- HPI YoY
- ▼ -187.86%
- Current HPI
- 310.0764
- Rent YoY
- ▲ 3.62%
- Metro
- Savannah, GA
- State GDP YoY
- ▲ 2.66%
- F500 in state
- 28
Industry mix (Fortune 500 HQ in GA)
| Industry | F500 HQs | Revenue |
|---|---|---|
| Paper / Packaging | 2 | $29B |
|
||
| Retail | 1 | $160B |
|
||
| Transportation / Logistics | 1 | $91B |
|
||
| Airlines | 1 | $62B |
|
||
| Consumer Goods | 1 | $47B |
|
||
| Utilities | 1 | $25B |
|
||
Price history
+241.7% since first listed10 events — show timeline
- 2026-05-28 Listed $205,000 Hive MLS
- 2024-07-21 Listing Removed — Hive MLS
- 2024-07-21 Listing Removed — Hive MLS
- 2024-07-08 Listed $210,000 Hive MLS
- 2024-07-08 Listed $210,000 Hive MLS
- 2024-02-08 Listing Removed — Hive MLS
- 2024-01-18 Listed $236,500 Hive MLS
- 2013-05-01 Sold (MLS) $61,000 Hive MLS
- 2012-07-11 Listed $60,000 Hive MLS
- 1997-04-30 Sold (Public Records) $60,000 Public Records
Property tax history
+9.6%/yrLatest (2025): $2,105 · +16.0% YoY. Source: county tax records.
Cash-flow waterfall
monthlySold comps — $/sqft
last 12 mo · ≤1 miLoading sold comps…