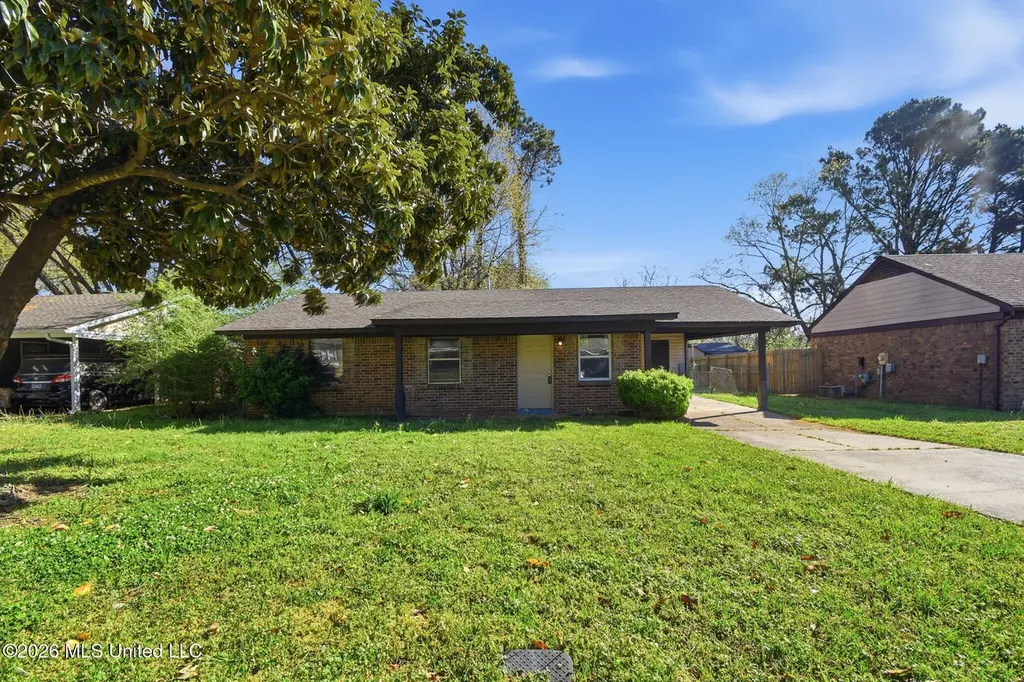
6460 Yorkshire Rd · Horn Lake, MS
Flood risk 1/10 · Minimal
- FEMA flood zone
- X (unshaded)
- Chance of flooding over 30 yrs
- 0.0%
- Est. flood insurance / yr
- $507 – $1,088
Fire risk 3/10 · Minor
- Est. fire insurance / yr
- $1,241 – $2,305
Heat risk 6/10 · Moderate
- Hot days now (above 109°F)
- 7 days/yr
- Hot days in 30 yrs
- 21 days/yr
Wind risk 4/10 · Minor
- Chance of severe wind over 30 yrs
- 19.0%
Air-quality risk 2/10 · Minimal
- Unhealthy air days now
- 2 days/yr
- Unhealthy air days in 30 yrs
- 2 days/yr
Risk factors via First Street. Map © Google.
Why this score? — see what drove the C grade
The composite is a weighted blend of 9 inputs, each scored 0–100. Each bar is that input's sub-score; the figure is the points it added to the 100-point composite (weight × sub-score).
- Cash flow +21.5/30.0
- ARV discount +12.7/15.0
- DSCR +6.9/10.0
- 1% rule +5.1/10.0
- Schools +4.0/10.0
- Livability +3.1/5.0
- Condition / age +2.5/5.0
- Rent growth +2.3/5.0
- Appreciation +0.0/10.0
$151,900
🖨 Deal sheet (PDF) 📄 Offer letter ✓ Due diligence
Listing remarks MLS
Spacious single-story home featuring 3 bedrooms, 2 bathrooms with a functional and inviting layout. The main living areas offer comfortable space for both everyday living and entertaining, while the kitchen provides ample cabinet and counter space and flows into the dining and living areas. The primary bedroom includes an en-suite bathroom and generous closet space. Additional bedrooms offer flexibility for guests, office, or hobbies. Enjoy the backyard with space to relax or entertain. Great opportunity with plenty of potential!
Key facts
- 8,276 sq ft lot
- Parking
- Built 1985
Neighborhood map
What this means for you Summary
Snapshot
- This is a 3-bed/1.5-bath single-family listed at $152k.
Deal economics
- At list price, monthly cash flow is $229 ($3k/yr) — positive.
- The deal already cash-flows at list — no discount required.
- Meets the 1% rule at list price ($2k rent vs $152k).
- Recommended offer: $143k (6.0% below list) — sets the bar for market timing.
- Cap rate 8.1% vs local median 5.9% in Horn Lake — top-decile yield for the area; either an underpriced asset or a hidden risk that comps aren't pricing in. Stress-test before assuming the spread holds.
Location & tenants
- Location reads 61/100 on livability (#196 in MS) — a middle-class / working-renter tenant base. Strengths: cost of living A+, housing A+, crime A; Watch: employment D, amenities F, commute F.
- Desoto County School District (suburban): math 48% / reading 42% proficiency, ranked #20 of 130 in MS (top 15%) — families likely to look elsewhere, expect single-tenant / working-renter base with shorter leases.
- Zoned schools: Horn Lake Intermediate School (math 11% / reading 22%, grade F, #269 of 375 statewide, top 72%, 921 students, 100% FRL); Horn Lake Middle School (math 37% / reading 21%, grade F, #90 of 179 statewide, top 52%, 1,021 students, 100% FRL); Horn Lake High (math 28% / reading 30%, grade F, #98 of 197 statewide, top 49%, 1,361 students, 100% FRL) — zoned schools average 100% FRL vs 43% district-wide (56 pts higher); higher-poverty schools than district average — tighter screening recommended.
- Zoned-school proficiency averages 25% at this address vs 45% district-wide (-20 pts) — the specific schools serving this property underperform the Desoto County School District average; the district grade overstates school quality for this exact location.
- Market conditions: Rents soft (-0.7%/yr); 98 active listings in the ZIP; 15 comparable units currently listed for rent nearby; rentals at typical pace (median 26d on market — plan ~3-4 weeks tenant-placement turnaround); 1,155 units permitted in DeSoto County in 2024 (0 in 5+ unit buildings).
- This rent runs 35% of the median local income ($53k/yr) — at the standard rent-burdened threshold; future hikes will face affordability resistance.
Forward outlook
- Local home prices are declining (-3.0%/yr); year-one equity from $1k of loan paydown is wiped out by about $5k of value loss. Plan a longer hold.
- DeSoto County population projected at +33% by 2050 — long-run rental-demand tailwind backs the buy-and-hold thesis.
Negotiation context
- It's been on market 82 days — a 6% lower offer ($143k) is reasonable based on typical stale-listing flexibility.
- 6 sale attempts since 2y ago; this cycle's ask has dropped $8k (5%) from the opening price — seller is motivated, your offer sets the floor, not the list.
Risks & watch-outs
- Climate carrying-cost: extreme-heat days projected 7→21/yr by 2055 (HVAC capex compounding) — expect insurance premiums to compound above CPI over the hold.
Questions for the listing agent
- It's been on market 82 days. Have you received any prior offers? Is the seller open to a 6% concession, seller financing, or rate buy-down credit?
- Why hasn't it sold? Are there any deal-killer items the seller is aware of (foundation, flood, title, zoning, code violations)?
- Is there a deadline driving the sale (1031 exchange, divorce, estate, relocation)? That informs how much negotiation room exists.
- Schools are F-rated, which usually means shorter tenancies and higher turnover. Who's the typical renter profile here, and what's been the actual vacancy rate?
- What's the average days-on-market for RENTAL listings here right now (not sales)? A rising rental-DOM trend means longer vacancies and softer asking-rent achievability than the comps imply.
- What's the recent tenant-quality profile in this submarket — average credit score on applications, eviction rate, late-payment / NSF rate, and stable-employment percentage? A property-management company in the area should have these aggregated.
- How much new for-sale + rental construction is in the pipeline within 1–3 miles? Heavy new supply typically softens prices + rents 12–24 months out; constrained supply supports both.
Investment metrics
- 1% rule
- 1.01% ✓
- Cap rate
- 8.10%
- Cash-on-cash
- 6.47%
- DSCR
- 1.29
- GRM
- 8.2
CMA / ARV
- ARV (median comp)
- $171,563
- List price
- $151,900
- Delta
- -11.46%
- Verdict
- UNDERPRICED
- Comps
- 20 within 1.0 mi
Show comp detail 12 sales within ~0.75 mi
| Address | Dist | Beds/Ba | Sqft | Sold | Price | $/sf | Match |
|---|---|---|---|---|---|---|---|
| 6470 Forest Glen Dr | 0.13mi | 3/1.0 | 938 (-4%) | 2mo | $147,300 | $157 | 83 |
| 2940 Meadowbrook Dr | 0.38mi | 3/1.0 | 1,000 (+2%) | 10mo | $142,800 | $143 | 69 |
| 3430 Mayfair Dr | 0.22mi | 3/2.0 | 1,089 (+11%) | 3mo | $204,900 | $188 | 66 |
| 6705 Gatewood Cir | 0.25mi | 3/1.5 | 1,069 (+9%) | 8mo | $199,900 | $187 | 66 |
| 6435 Knight Cv | 0.21mi | 3/1.5 | 1,079 (+10%) | 11mo | $175,000 | $162 | 64 |
| 6455 Knight Cv | 0.22mi | 3/2.0 | 1,117 (+14%) | 8mo | $209,900 | $188 | 58 |
| 3530 Woodmont Cv | 0.36mi | 3/1.5 | 1,100 (+12%) | 7mo | $189,500 | $172 | 57 |
| 3400 Shadow Oaks Pkwy | 0.42mi | 3/2.0 | 1,080 (+10%) | 12mo | $190,000 | $176 | 52 |
| 6670 Embassy Cir | 0.74mi | 3/1.0 | 932 (-5%) | 5mo | $110,000 | $118 | 51 |
| 3420 Laurel Dr | 0.38mi | 3/1.5 | 1,116 (+14%) | 10mo | $165,000 | $148 | 50 |
| 6215 E Carroll Cove Cv | 0.50mi | 3/1.5 | 1,110 (+13%) | 9mo | $145,000 | $131 | 47 |
| 2848 Normandy Dr | 0.55mi | 3/1.0 | 1,095 (+12%) | 8mo | $167,000 | $153 | 46 |
Match score weights: distance 35% · size 25% · config 20% · recency 20%. Top-matched comps best support the ARV.
Projected returns pro-forma
-3.0% appreciation · 0.0% rent growth · sell at horizon
- IRR
- -9.6%
- Equity multiple
- 0.66×
- Total profit
- $-14,532
- Equity at exit
- $22,649
- IRR
- -4.7%
- Equity multiple
- 0.73×
- Total profit
- $-11,320
- Equity at exit
- $13,134
Cash invested: $42,532 (down + closing). Projections, not guarantees.
Landlord ↔ Tenant lean methodology
- Overall (STATE)
- 90 Strongly Landlord-Friendly
- State Mississippi
- 90 Strongly Landlord-Friendly · R+11
- County
- — inherits STATE
- City
- — inherits STATE
ZIP-level market 38637
- Home prices YoY
- -13.4%
- Rents YoY
- -0.7%
- Active inventory
- 98
- Price-to-rent
- 8.2×
Monthly cashflow live
- Estimated rent
- $1,536 high interval (Pro) →
- Mortgage (P&I)
- −$797
- Tax from tax record
- −$124 /mo · $1,493/yr
- Insurance
- −$63
- HOA
- −$0
- Vacancy / Maint / Mgmt
- −$323
- Net cashflow
- $229
Break-even live
Sensitivity live
| Price | -10% $315 | -5% $272 | +0% $229 | +5% $186 | +10% $143 |
|---|---|---|---|---|---|
| Rent | -10% $108 | -5% $169 | +0% $229 | +5% $290 | +10% $351 |
| Rate | -1.0pp $306 | -0.5pp $268 | base $229 | +0.5pp $190 | +1.0pp $150 |
UW: 25.0% down · 7.5% · 30yr · 1.5% tax · 5.0% vac · 8.0% maint · 8.0% mgmt
Financing live
Cash to close
- Down payment
- $37,975
- Closing costs
- $4,557
- Reserves months
- —
- Total cash needed
- —
Loan-product check · same deal, 3 products live
Conventional
25% down · 7.5% · 30yr
- Down + closing
- —
- Monthly P&I
- —
- Monthly cashflow
- —
- DSCR
- —
- Eligible?
- —
Personal DTI + credit; lowest rate.
DSCR
20% down · 8.5% · 30yr
- Down + closing
- —
- Monthly P&I
- —
- Monthly cashflow
- —
- DSCR
- —
- Eligible?
- —
No personal income docs; deal must DSCR.
Hard money
10% down · 12.0% · 12mo
- Down + closing
- —
- Monthly P&I
- —
- Monthly cashflow
- —
- DSCR
- —
- Eligible?
- —
Short-term bridge; refi at stabilization.
Rent comps 15 comps
| Address | Beds | Baths | Sqft | Rent | $/sqft | DOM | Units | Dist |
|---|---|---|---|---|---|---|---|---|
| 6475 Forest Glen Dr Horn Lake, MS | 3.0 | 1.5 | 1100 | $1,395 | $1.27 | 45d | 1 | 0.11mi |
| 6420 Forestgate Rd Horn Lake, MS | 3.0 | 2.0 | 1120 | $1,573 | $1.40 | 23d | 1 | 0.12mi |
| 3060 Fairmeadow Dr Horn Lake, MS | 3.0 | 1.5 | 1104 | $1,663 | $1.51 | 3d | 1 | 0.18mi |
| 6165 Forestgate Rd Horn Lake, MS | 3.0 | 1.5 | 1079 | $1,400 | $1.30 | 45d | 1 | 0.30mi |
| 3305 Laurel Dr Horn Lake, MS | 3.0 | 2.0 | 1085 | $1,450 | $1.34 | 25d | 1 | 0.39mi |
| 6420 Sandhurst Rd Horn Lake, MS | 3.0 | 2.0 | 1101 | $1,623 | $1.47 | 23d | 1 | 0.48mi |
| 2905 Brook Cv Horn Lake, MS | 3.0 | 1.0 | 1112 | $1,195 | $1.07 | 3d | 1 | 0.49mi |
| 2905 Brook Cv Horn Lake, MS | 3.0 | 1.0 | 1112 | $1,195 | $1.07 | 23d | 1 | 0.49mi |
| 2900 Brachton Cv W Horn Lake, MS | 2.0 | 2.0 | 1000 | $1,225 | $1.23 | 25d | 1 | 0.54mi |
| 2675 Ridgewood Cv Horn Lake, MS | 3.0 | 1.0 | 1035 | $1,195 | $1.15 | 25d | 1 | 0.54mi |
| 2675 Ridgewood Cv Horn Lake, MS | 3.0 | 1.0 | 1065 | $1,195 | $1.12 | 23d | 1 | 0.54mi |
| 6270 Jamestown Ave Horn Lake, MS | 3.0 | 2.0 | 1053 | $1,523 | $1.45 | 45d | 1 | 0.74mi |
| 7066 Foxhall Dr Horn Lake, MS | 3.0 | 2.0 | 998 | $1,395 | $1.40 | 46d | 1 | 0.91mi |
| 4192 Anderton Blvd Horn Lake, MS | 3.0 | 2.0 | 1100 | $1,575 | $1.43 | 16d | 1 | 1.41mi |
| 4192 Anderton Blvd Horn Lake, MS | 3.0 | 2.0 | 1100 | $1,575 | $1.43 | 25d | 1 | 1.41mi |
Listing history 32 events
-
2026-06-21days on market $151,900 Active 82 DOM
-
2026-06-18days on market $151,900 Active 79 DOM
-
2026-06-17days on market $151,900 Active 78 DOM
-
2026-06-16days on market $151,900 Active 77 DOM
-
2026-06-15days on market $151,900 Active 76 DOM
-
2026-06-13pricedays on market $151,900 Active 74 DOM
-
2026-06-10days on market $154,900 Active 71 DOM
-
2026-06-09days on market $154,900 Active 70 DOM
-
2026-06-08days on market $154,900 Active 69 DOM
-
2026-06-07days on market $154,900 Active 68 DOM
-
2026-06-03days on market $154,900 Active 64 DOM
-
2026-06-02days on market $154,900 Active 63 DOM
-
2026-06-01days on market $154,900 Active 62 DOM
-
2026-05-31days on market $154,900 Active 61 DOM
-
2026-03-31$159,900 Active 535-char remark
Show marketing remark (535 chars)
Spacious single-story home featuring 3 bedrooms, 2 bathrooms with a functional and inviting layout. The main living areas offer comfortable space for both everyday living and entertaining, while the kitchen provides ample cabinet and counter space and flows into the dining and living areas. The primary bedroom includes an en-suite bathroom and generous closet space. Additional bedrooms offer flexibility for guests, office, or hobbies. Enjoy the backyard with space to relax or entertain. Great opportunity with plenty of potential!
-
2026-01-26historical
-
2026-01-21status Active
-
2026-01-16status Active
-
2026-01-16historical
-
2026-01-12historical
-
2025-12-22status Active
-
2025-12-22historical
-
2025-12-15$178,500 Active
-
2024-11-28historical $1,280
-
2024-11-25price $1,280
-
2024-11-12price $1,295
-
2024-11-04price $1,315
-
2024-10-21price $1,345
-
2024-10-15price $1,375
-
2024-10-07price $1,395
-
2024-10-03$1,410
-
2002-12-19soldstatus
ⓘ Source: listings_history table (triggers on properties + properties_extension) + one-shot
backfill from property_details.listing_events for pre-trigger history.
Tax reassessment forecast MS · Resets to sale price
- Current annual tax
- $1,493 · $124/mo
- Projected year-2 tax
- $1,493 · $124/mo
- Expected delta
- $0/yr ($0/mo · 0.0%)
ⓘ Screening estimate from a state-policy table — verify with the county assessor before closing.
Climate risk First Street
- Flood 1/10 Low FEMA zone X (unshaded) · 0% chance over 30 yrs
- Wildfire 3/10 Moderate
- Heat 6/10 Major 7 d/yr ≥109°F today · 21 d/yr by 30 yrs out
- Wind 4/10 Moderate 19% chance of damaging wind over 30 yrs
- Air quality 2/10 Low 2 unhealthy d/yr today · 2 by 30 yrs out
Nearby sold comps map
Loading sold comps map…
Walkable amenities ~0.75 mi
Loading nearby amenities…
Taxation est. · year 1
- Rental income
- $18,434
- − Mortgage interest
- −$8,509
- − Property taxes
- −$1,493
- − Insurance
- −$760
- − Repairs & maintenance
- −$1,475
- − Management
- −$1,475
- − Depreciation
- −$4,419
- Taxable income
- $304
- Est. tax owed @ 24.0%
- −$73
- After-tax cash flow
- $2,678/yr
For passive investors: Depreciation is non-cash, so a rental often shows a tax loss while cash-flowing — sheltering income. Rental losses are passive: they offset passive income freely, and up to $25,000/yr can offset ordinary (W-2) income if you actively participate and your MAGI is under $100k (phasing out to $0 by $150k); unused losses carry forward. On sale, claimed depreciation is recaptured at up to 25%, and gains may owe capital-gains tax (a 1031 exchange can defer both). Figures are a year-1 estimate at your 24.0% rate — not tax advice; consult a CPA.
Schools (NCES district)
- District
- Desoto County School District
- NCES district ID
- 2801320
- Math proficiency
- 48% ▼ -13.00%
- Reading proficiency
- 42% ▼ -6.00%
- Median HH income
- $59,272
- Composite
- 39.56/100
- National rank
- #3933
- State rank
- #20 of 130 in MS
Livability — Horn Lake
- Score
- 61/100
- State rank
- #196
- US rank
- #17977
Category grades
Schools grade is shown separately in the Schools card above.
Census & demographics
- Census place
- Horn Lake, MS
- County
- DeSoto County · 176,513 people
- City population
- 26,647
- Metro
- Memphis, TN-MS-AR
- Population (ZIP)
- 26,647
- Household income
- $53,311
- Rent vs Own
- Severe rent burden
- 1052.0
Population outlook (DeSoto County) Hauer SSP2
- Today (2025)
- 203,338 people
- By 2030
- 217,692 · +7.1%
- By 2040
- 245,320 · +20.6%
- By 2050
- 270,133 · +32.8%
- By 2075
- 323,341 · +59.0%
- By 2100
- 348,742 · +71.5%
Race, ethnicity, and origin ACS 2023
- Neighborhood character
- Diverse neighborhood (Simpson 0.62)
- Race & ethnicity
- Black 44% White 42% Hispanic / Latino 9% Two or more races 5% Asian 1%
- Hispanic origin (detail)
- Mexican 7%
- Common ancestry
- Slovak 2% Lithuanian 1% Serbian 1%
- Foreign-born
- 7% · Canada
- Languages at home
- 91% English-only · Spanish 8%
Political lean MEDSL · DeSoto
- 2024 margin
- Strong R (+24.1) · D 36.7% · R 60.8% · Other 2.5%
- 2008→2024 swing
- +14.2pp toward D · 2008: -38.2pp · 2024: -24.1pp
- All cycles
- 2024: R+24.1 2020: R+23.9 2016: R+34.8 2012: R+33.5 2008: R+38.2
Not yet ingested
- Civics
- —
Market trends
- HPI YoY
- ▼ -32.08%
- Current HPI
- 206.5542
- Rent YoY
- ▼ -0.66%
- Metro
- Memphis, TN-MS-AR
- State GDP YoY
- —
- F500 in state
- 0
Price history
+11240.4% since first listed18 events — show timeline
- 2026-03-31 Listed $159,900 MLSU
- 2026-01-26 Listing Removed — MLSU
- 2026-01-21 Relisted — MLSU
- 2026-01-16 Relisted — MLSU
- 2026-01-16 Listing Removed — MLSU
- 2026-01-12 Listing Removed — MLSU
- 2025-12-22 Relisted — MLSU
- 2025-12-22 Listing Removed — MLSU
- 2025-12-15 Listed $178,500 MLSU
- 2024-11-28 Rental Removed $1,280 RENT.
- 2024-11-25 Price Changed $1,280 RENT.
- 2024-11-12 Price Changed $1,295 RENT.
- 2024-11-04 Price Changed $1,315 RENT.
- 2024-10-21 Price Changed $1,345 RENT.
- 2024-10-15 Price Changed $1,375 RENT.
- 2024-10-07 Price Changed $1,395 RENT.
- 2024-10-03 Listed for Rent $1,410 RENT.
- 2002-12-19 Sold (Public Records) — Public Records
Property tax history
+54.9%/yrLatest (2025): $1,493 · +13.4% YoY. Source: county tax records.
Cash-flow waterfall
monthlySold comps — $/sqft
last 12 mo · ≤1 miLoading sold comps…