 Multi-family
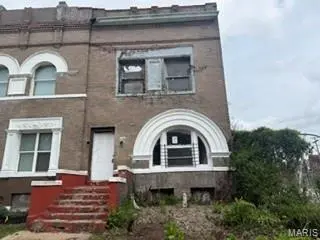
5233 Cates Ave · St. Louis, MO
Flood risk 1/10 · Minimal
- FEMA flood zone
- X (unshaded)
- Chance of flooding over 30 yrs
- 0.0%
- Est. flood insurance / yr
- $473 – $860
Fire risk 1/10 · Minimal
- Est. fire insurance / yr
- $1,054 – $1,958
Heat risk 5/10 · Moderate
- Hot days now (above 107°F)
- 7 days/yr
- Hot days in 30 yrs
- 21 days/yr
Wind risk 2/10 · Minimal
- Chance of severe wind over 30 yrs
- 1.0%
Air-quality risk 4/10 · Minor
- Unhealthy air days now
- 4 days/yr
- Unhealthy air days in 30 yrs
- 5 days/yr
Risk factors via First Street. Map © Google.
Why this score? — see what drove the D grade
The composite is a weighted blend of 9 inputs, each scored 0–100. Each bar is that input's sub-score; the figure is the points it added to the 100-point composite (weight × sub-score).
- Cash flow +15.0/30.0
- ARV discount +7.5/15.0
- 1% rule +5.0/10.0
- DSCR +5.0/10.0
- Rent growth +3.3/5.0
- Livability +2.5/5.0
- Condition / age +2.5/5.0
- Schools +1.2/10.0
- Appreciation +0.0/10.0
$29,900
🖨 Deal sheet 📄 Offer letter ✓ Due diligence
Multi-family units
County records classify this as Multi-Family (2-4 Unit). Listing-text estimate: 1 unit. estimate disagrees with records
Listing remarks MLS
Great opportunity in St. Louis City! This 2-story home offers approximately 1,912 livable square feet, featuring 6 rooms, including 3 bedrooms and 2 full baths. Property is a full rehab project and is not move-in ready—perfect for investors or buyers looking to customize a home to their vision. Features include a fenced backyard and strong potential for value-add improvements. Bring your ideas and finishing touches to transform this property. Property is being sold as-is. Buyer to verify all information, including school district, square footage, and any permits required to complete renovations.
Key facts
- 3,101 sq ft lot
- Built 1898
- Listed 73 days
Neighborhood map
What this means for you Summary
Snapshot
- This is a 2-bed/2.0-bath multifamily listed at $30k.
Deal economics
- At list price, monthly cash flow is $1k ($17k/yr) — positive.
- The deal already cash-flows at list — no discount required.
- Meets the 1% rule at list price ($2k rent vs $30k).
- Recommended offer: $28k (6.0% below list) — sets the bar for market timing.
- Cap rate 62.8% vs local median 5.0% in St. Louis — top-decile yield for the area; either an underpriced asset or a hidden risk that comps aren't pricing in. Stress-test before assuming the spread holds.
Location & tenants
- Location reads: area grade D — affects rentability + tenant quality, not the cash-flow math above.
- St. Louis City (urban): math 10% / reading 18% proficiency, ranked #312 of 324 in MO (top 96%) — low school quality limits family demand, transient renter base, plan for 1-2y turnover; 80% free/reduced lunch — lower-income household profile, screen leases tightly.
- Market conditions: Rents rising (+3.1%/yr); 152 active listings in the ZIP; 40 comparable units currently listed for rent nearby; rentals at typical pace (median 18d on market — plan ~3-4 weeks tenant-placement turnaround); 294 units permitted in St. Louis city in 2024 (227 in 5+ unit buildings).
- This rent runs 44% of the median local income ($55k/yr) — at the standard rent-burdened threshold; future hikes will face affordability resistance.
Forward outlook
- Local home prices are declining (-3.0%/yr); year-one equity from $207 of loan paydown is wiped out by about $897 of value loss. Plan a longer hold.
- St. Louis County population projected to shrink 6% by 2050 — rents likely to lag national; underwrite the cash flow, not the appreciation.
- At projected returns (-3.0% appreciation + 3.1% rent growth), your $8k cash investment doubles in ~1 year — after that, you're playing with house money.
Negotiation context
- It's been on market 73 days — a 6% lower offer ($28k) is reasonable based on typical stale-listing flexibility.
- 4 sale attempts with the ask held roughly flat each time — persistent listings suggest the price (not the market) is what's stuck; bring a comps-based counter.
Risks & watch-outs
- Watch-outs: built in 1898 — expect roof / HVAC / electrical / plumbing capex.
- Climate carrying-cost: extreme-heat days projected 7→21/yr by 2055 (HVAC capex compounding) — expect insurance premiums to compound above CPI over the hold.
Questions for the listing agent
- It's been on market 73 days. Have you received any prior offers? Is the seller open to a 6% concession, seller financing, or rate buy-down credit?
- Built in 1898 — when were the roof, HVAC, electrical panel, plumbing, and water heater last replaced?
- Why hasn't it sold? Are there any deal-killer items the seller is aware of (foundation, flood, title, zoning, code violations)?
- Is there a deadline driving the sale (1031 exchange, divorce, estate, relocation)? That informs how much negotiation room exists.
- The area grade is low — what's the realistic commute time and amenity access for the typical tenant pool here? Any planned neighborhood developments (good or bad) we should know about?
- What's the average days-on-market for RENTAL listings here right now (not sales)? A rising rental-DOM trend means longer vacancies and softer asking-rent achievability than the comps imply.
- What's the recent tenant-quality profile in this submarket — average credit score on applications, eviction rate, late-payment / NSF rate, and stable-employment percentage? A property-management company in the area should have these aggregated.
- How much new apartment / multifamily construction is in the pipeline within 1–3 miles? Heavy new supply (>2% of stock underway) typically softens rents 12–24 months out; light construction supports rent growth.
Investment metrics
- 1% rule
- 6.77% ✓
- Cap rate
- 62.77%
- Cash-on-cash
- 201.69%
- DSCR
- 9.97
- GRM
- 1.2
CMA / ARV
- ARV (median comp)
- $92,073
- List price
- $29,900
- Delta
- -67.53%
- Verdict
- UNDERPRICED
- Comps
- 20 within 1.0 mi
Show comp detail 1 sale within ~0.75 mi
| Address | Dist | Beds/Ba | Sqft | Sold | Price | $/sf | Match |
|---|---|---|---|---|---|---|---|
| 4969 Fountain Ave | 0.50mi | 3/3.0 (+1) | 2,040 (+7%) | 20mo | $250,000 | $123 | 40 |
Match score weights: distance 35% · size 25% · config 20% · recency 20%. Top-matched comps best support the ARV.
Projected returns pro-forma
-3.0% appreciation · 3.1% rent growth · sell at horizon
- IRR
- —
- Equity multiple
- 11.15×
- Total profit
- $85,002
- Equity at exit
- $4,458
- IRR
- —
- Equity multiple
- 23.74×
- Total profit
- $190,347
- Equity at exit
- $2,585
Cash invested: $8,372 (down + closing). Projections, not guarantees.
Landlord ↔ Tenant lean methodology
- Overall (STATE)
- 81 Strongly Landlord-Friendly
- State Missouri
- 81 Strongly Landlord-Friendly · R+10
- County
- — inherits STATE
- City
- — inherits STATE
ZIP-level market 63108
- Home prices YoY
- -33.1%
- Rents YoY
- 3.1%
- Active inventory
- 152
- Price-to-rent
- 1.2×
Monthly cashflow live
- Estimated rent
- $2,024 high interval (Pro) →
- Mortgage (P&I)
- −$157
- Tax from tax record
- −$22 /mo · $269/yr
- Insurance
- −$12
- HOA
- −$0
- Vacancy / Maint / Mgmt
- −$425
- Net cashflow
- $1,407
Break-even live
UW: 25.0% down · 7.5% · 30yr · 1.5% tax · 5.0% vac · 8.0% maint · 8.0% mgmt
Financing live
Cash to close
- Down payment
- $7,475
- Closing costs
- $897
- Reserves months
- —
- Total cash needed
- —
Loan-product check · same deal, 3 products live
Conventional
25% down · 7.5% · 30yr
- Down + closing
- —
- Monthly P&I
- —
- Monthly cashflow
- —
- DSCR
- —
- Eligible?
- —
Personal DTI + credit; lowest rate.
DSCR
20% down · 8.5% · 30yr
- Down + closing
- —
- Monthly P&I
- —
- Monthly cashflow
- —
- DSCR
- —
- Eligible?
- —
No personal income docs; deal must DSCR.
Hard money
10% down · 12.0% · 12mo
- Down + closing
- —
- Monthly P&I
- —
- Monthly cashflow
- —
- DSCR
- —
- Eligible?
- —
Short-term bridge; refi at stabilization.
Rent comps 40 comps
| Address | Beds | Baths | Sqft | Rent | $/sqft | DOM | Units | Dist |
|---|---|---|---|---|---|---|---|---|
| 1320 Academy Ave Unit A St. Louis, MO | 2.0 | 1.0 | 1600 | $1,090 | $0.68 | 43d | 1 | 0.44mi |
| 5096 Minerva Ave Unit C St. Louis, MO | 3.0 | 1.0 | 1800 | $1,395 | $0.78 | 43d | 1 | 0.44mi |
| 5137 Waterman Blvd Apt 4 St. Louis, MO | 3.0 | 2.0 | 1550 | $1,700 | $1.10 | 23d | 1 | 0.50mi |
| 5137 Waterman Blvd Apt 4 St. Louis, MO | 3.0 | 2.0 | 1550 | $1,700 | $1.10 | 43d | 1 | 0.50mi |
| 5527 Waterman Blvd St. Louis, MO | 2.0 | 1.5 | 1389 | $1,495 | $1.08 | 16d | 1 | 0.63mi |
| 625 N Euclid Ave St. Louis, MO | 2.0 | 1.0–2.0 | 984 | $3,120 | $3.17 | 1d | 16 | 0.64mi |
| 275 Union Blvd St. Louis, MO | 3.0 | 1.0–3.0 | 1317 | $3,426 | $2.60 | 1d | 58 | 0.64mi |
| 321 Belt Ave St. Louis, MO | 3.0 | 2.0 | 1549 | $2,300 | $1.48 | 4d | 1 | 0.65mi |
| 5345 Wells Ave Saint Louis, MO | 3.0 | 1.0 | 2254 | $1,295 | $0.57 | 43d | 1 | 0.66mi |
| 4901 Washington Blvd Saint Louis, MO | 2.0 | 2.0 | 1620 | $2,500 | $1.54 | 11d | 1 | 0.66mi |
| 5394 Pershing Ave Saint Louis, MO | 3.0 | 2.0 | 1500 | $2,595 | $1.73 | 43d | 1 | 0.69mi |
| 401 N Euclid Ave St. Louis, MO | 3.0 | 1.0 | 1025 | $1,615 | $1.58 | 1d | 4 | 0.74mi |
| 4738 Olive St Saint Louis, MO | 2.0 | 2.0 | 1413 | $1,925 | $1.36 | 23d | 1 | 0.77mi |
| 232 Kingshighway Blvd St. Louis, MO | 1.0 | 1.5 | 1240 | $4,200 | $3.39 | 43d | 1 | 0.85mi |
| 5804 Cates Ave Unit 2 St. Louis, MO | 3.0 | 1.0 | 1500 | $1,500 | $1.00 | 4d | 1 | 0.85mi |
| 5333 Patton Ave St. Louis, MO | 3.0 | 1.5 | 1262 | $1,250 | $0.99 | 43d | 1 | 0.87mi |
| 100 N Kingshighway Blvd Saint Louis, MO | 3.0 | 1.0–2.0 | 1211 | $5,531 | $4.57 | 43d | 84 | 0.98mi |
| 100 N Kingshighway Blvd Saint Louis, MO | 3.0 | 1.0–2.0 | 1171 | $5,438 | $4.64 | 1d | 80 | 0.98mi |
| 5783 McPherson Ave Unit 1FL St. Louis, MO | 2.0 | 2.0 | 1250 | $1,950 | $1.56 | 7d | 1 | 0.98mi |
| 5783 McPherson Ave Unit 2FL St. Louis, MO | 3.0 | 2.0 | 1320 | $2,550 | $1.93 | 7d | 1 | 0.98mi |
| 40 N Kingshighway Blvd Saint Louis, MO | 3.0 | 1.0–2.0 | 872 | $2,195 | $2.52 | 43d | 54 | 1.03mi |
| 40 N Kingshighway Blvd Saint Louis, MO | 2.0 | 1.0–2.0 | 860 | $2,545 | $2.96 | 1d | 54 | 1.03mi |
| 4615 Lindell Blvd Saint Louis, MO | 1.0–2.0 | 1.0–2.5 | 1251 | $2,075 | $1.66 | 7d | 6 | 1.04mi |
| 4605 Lindell Blvd Saint Louis, MO | 2.0 | 2.0–3.0 | 1868 | $2,398 | $1.28 | 7d | 3 | 1.06mi |
| 10 S Kingshighway Blvd St. Louis, MO | 2.0 | 2.0 | 2178 | $2,500 | $1.15 | 17d | 1 | 1.07mi |
| 4466 Olive St Saint Louis, MO | 1.0–2.0 | 1.0–2.5 | 1222 | $2,495 | $2.04 | 1d | 7 | 1.08mi |
| 4567 W Pine Blvd Saint Louis, MO | 2.0–3.0 | 2.0 | 1326 | $2,575 | $1.94 | 1d | 7 | 1.11mi |
| 5803 Waterman Blvd St. Louis, MO | 2.0 | 2.0 | 1432 | $1,850 | $1.29 | 43d | 1 | 1.12mi |
| 4446 McPherson Ave Saint Louis, MO | 2.0 | 1.5 | 1440 | $2,100 | $1.46 | 23d | 1 | 1.13mi |
| 5861 Nina Pl Unit 3W St. Louis, MO | 3.0 | 1.0 | 1550 | $1,750 | $1.13 | 17d | 1 | 1.15mi |
| 5861 Nina Pl Apt 2W St. Louis, MO | 3.0 | 1.0 | 1400 | $1,750 | $1.25 | 43d | 1 | 1.15mi |
| 4909 Laclede Ave Saint Louis, MO | 2.0 | 2.0 | 1405 | $3,800 | $2.70 | 4d | 1 | 1.16mi |
| 4909 Laclede Ave Saint Louis, MO | 2.0 | 2.0 | 1405 | $3,800 | $2.70 | 3d | 1 | 1.16mi |
| 4400 Delmar Blvd St. Louis, MO | 3.0 | 1.0 | 1450 | $1,600 | $1.10 | 43d | 1 | 1.20mi |
| 5920 McPherson Ave Unit 1st Floor St. Louis, MO | 3.0 | 1.0 | 1300 | $2,550 | $1.96 | 43d | 1 | 1.22mi |
| 5760 Theodosia Ave Saint Louis, MO | 3.0 | 1.5 | 1702 | $1,420 | $0.83 | 23d | 1 | 1.22mi |
| 6009 Kingsbury Ave Saint Louis, MO | 3.0 | 1.0 | 1368 | $2,000 | $1.46 | 3d | 1 | 1.29mi |
| 6009 Kingsbury Ave Saint Louis, MO | 2.0 | 1.0 | 1368 | $1,300 | $0.95 | 23d | 1 | 1.29mi |
| 4535 Forest Park Ave Saint Louis, MO | 1.0–2.0 | 1.0–2.0 | 1017 | $2,645 | $2.60 | 2d | 15 | 1.30mi |
| 6017 Kingsbury Ave Unit 1F St. Louis, MO | 3.0 | 1.0 | 1600 | $2,700 | $1.69 | 17d | 1 | 1.31mi |
Listing history 24 events
-
2026-06-18days on market $29,900 Active 73 DOM
-
2026-06-17days on market $29,900 Active 72 DOM
-
2026-06-16days on market $29,900 Active 71 DOM
-
2026-06-15days on market $29,900 Active 70 DOM
-
2026-06-13days on market $29,900 Active 68 DOM
-
2026-06-09days on market $29,900 Active 64 DOM
-
2026-06-08days on market $29,900 Active 63 DOM
-
2026-06-08days on market $29,900 Active 62 DOM
-
2026-06-05days on market $29,900 Active 59 DOM
-
2026-06-03days on market $29,900 Active 58 DOM
-
2026-06-02days on market $29,900 Active 57 DOM
-
2026-06-01days on market $29,900 Active 56 DOM
-
2026-05-31days on market $29,900 Active 55 DOM
-
2026-04-06$29,900 Active 610-char remark
Show marketing remark (610 chars)
Great opportunity in St. Louis City! This 2-story home offers approximately 1,912 livable square feet, featuring 6 rooms, including 3 bedrooms and 2 full baths. Property is a full rehab project and is not move-in ready—perfect for investors or buyers looking to customize a home to their vision. Features include a fenced backyard and strong potential for value-add improvements. Bring your ideas and finishing touches to transform this property. Property is being sold as-is. Buyer to verify all information, including school district, square footage, and any permits required to complete renovations.
-
2025-11-18price $45,000
-
2025-11-03price $49,900
-
2025-11-03price $45,000
-
2025-10-03price $49,900
-
2025-10-03status Active
-
2025-09-05price $59,900
-
2025-08-04price $69,900
-
2025-07-02$79,900 Active
-
2025-04-02$249,900 Active
-
2020-01-10soldstatus
ⓘ Source: listings_history table (triggers on properties + properties_extension) + one-shot
backfill from property_details.listing_events for pre-trigger history.
Tax reassessment forecast MO · Resets to sale price
- Current annual tax
- $269 · $22/mo
- Projected year-2 tax
- $290 · $24/mo
- Expected delta
- +$21/yr (+$2/mo · 7.8%)
ⓘ Screening estimate from a state-policy table — verify with the county assessor before closing.
Climate risk First Street
- Flood 1/10 Low FEMA zone X (unshaded) · 0% chance over 30 yrs
- Wildfire 1/10 Low
- Heat 5/10 Major 7 d/yr ≥107°F today · 21 d/yr by 30 yrs out
- Wind 2/10 Low 100% chance of damaging wind over 30 yrs
- Air quality 4/10 Moderate 4 unhealthy d/yr today · 5 by 30 yrs out
Nearby sold comps map
Loading sold comps map…
Walkable amenities ~0.75 mi
Loading nearby amenities…
Taxation est. · year 1
- Rental income
- $24,286
- − Mortgage interest
- −$1,675
- − Property taxes
- −$269
- − Insurance
- −$150
- − Repairs & maintenance
- −$1,943
- − Management
- −$1,943
- − Depreciation
- −$870
- Taxable income
- $17,437
- Est. tax owed @ 24.0%
- −$4,185
- After-tax cash flow
- $12,701/yr
For passive investors: Depreciation is non-cash, so a rental often shows a tax loss while cash-flowing — sheltering income. Rental losses are passive: they offset passive income freely, and up to $25,000/yr can offset ordinary (W-2) income if you actively participate and your MAGI is under $100k (phasing out to $0 by $150k); unused losses carry forward. On sale, claimed depreciation is recaptured at up to 25%, and gains may owe capital-gains tax (a 1031 exchange can defer both). Figures are a year-1 estimate at your 24.0% rate — not tax advice; consult a CPA.
Schools (NCES district)
- District
- St. Louis City
- NCES district ID
- 2929280
- Math proficiency
- 10% ▼ -6.00%
- Reading proficiency
- 18% ▼ -3.00%
- Median HH income
- $35,685
- Composite
- 11.54/100
- National rank
- #9699
- State rank
- #312 of 324 in MO
Livability — St. Louis
No livability data for this city. (Only ~50 U.S. cities are tracked.)
Census & demographics
- Census place
- St. Louis, MO
- County
- Saint Louis City · 254,015 people
- City population
- 283,259
- Metro
- St. Louis, MO-IL
- Population (ZIP)
- 21,336
- Household income
- $55,147
- Rent vs Own
- Severe rent burden
- 2180.0
Population outlook (St. Louis County) Hauer SSP2
- Today (2025)
- 315,737 people
- By 2030
- 313,865 · -0.6%
- By 2040
- 305,439 · -3.3%
- By 2050
- 296,529 · -6.1%
- By 2075
- 271,028 · -14.2%
- By 2100
- 255,359 · -19.1%
Race, ethnicity, and origin ACS 2023
- Neighborhood character
- Diverse neighborhood (Simpson 0.62)
- Race & ethnicity
- White 54% Black 26% Asian 13% Hispanic / Latino 4% Two or more races 4%
- Common ancestry
- Lithuanian 4% Romanian 3% Iranian 2%
- Foreign-born
- 13% · China, Canada, South Korea
- Languages at home
- 85% English-only · Chinese 3% Other Asian/Pacific 3% Spanish 3%
Political lean MEDSL · St. Louis
- 2024 margin
- Solid D (+64.7) · D 81.4% · R 16.7% · Other 2.0%
- 2008→2024 swing
- -3.5pp toward R · 2008: 68.2pp · 2024: 64.7pp
- All cycles
- 2024: D+64.7 2020: D+66.2 2016: D+63.7 2012: D+66.6 2008: D+68.2
Not yet ingested
- Civics
- —
Market trends
- HPI YoY
- ▼ -111.22%
- Current HPI
- 225.1081
- Rent YoY
- ▲ 3.10%
- Metro
- St. Louis, MO-IL
- State GDP YoY
- ▲ 1.84%
- F500 in state
- 20
Industry mix (Fortune 500 HQ in MO)
| Industry | F500 HQs | Revenue |
|---|---|---|
| Healthcare | 1 | $163B |
|
||
| Insurance | 1 | $21B |
|
||
| Industrial Technology | 1 | $17B |
|
||
| Retail | 1 | $16B |
|
||
| Industrial Distribution | 1 | $10B |
|
||
| Utilities | 1 | $9B |
|
||
Price history
-88.0% since first listed11 events — show timeline
- 2026-04-06 Listed $29,900 MARIS as Distributed by MLS Grid
- 2025-11-18 Price Changed $45,000 MARIS as Distributed by MLS Grid
- 2025-11-03 Price Changed $49,900 MARIS as Distributed by MLS Grid
- 2025-11-03 Price Changed $45,000 MARIS as Distributed by MLS Grid
- 2025-10-03 Price Changed $49,900 MARIS as Distributed by MLS Grid
- 2025-10-03 Relisted — MARIS as Distributed by MLS Grid
- 2025-09-05 Price Changed $59,900 MARIS as Distributed by MLS Grid
- 2025-08-04 Price Changed $69,900 MARIS as Distributed by MLS Grid
- 2025-07-02 Listed $79,900 MARIS as Distributed by MLS Grid
- 2025-04-02 Listed $249,900 MARIS as Distributed by MLS Grid
- 2020-01-10 Sold (Public Records) — Public Records
Property tax history
+1.4%/yrLatest (2024): $269 · +4.6% YoY. Source: county tax records.
Cash-flow waterfall
monthlySold comps — $/sqft
last 12 mo · ≤1 miLoading sold comps…