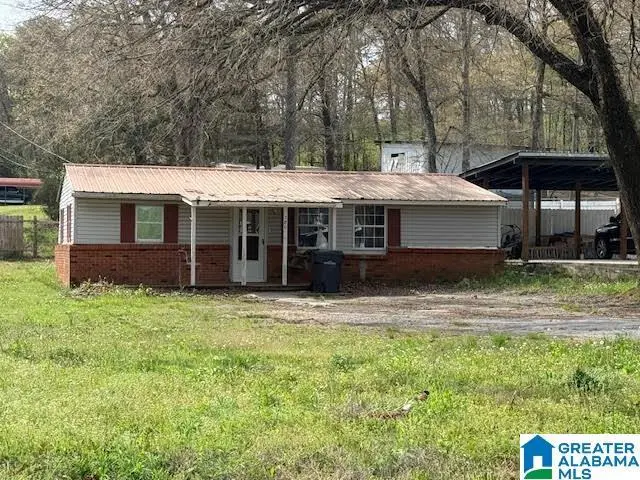
780 15th St · Calera, AL
Flood risk 1/10 · Minimal
- FEMA flood zone
- X (unshaded)
- Chance of flooding over 30 yrs
- 0.0%
- Est. flood insurance / yr
- $507 – $1,088
Fire risk 4/10 · Minor
- Est. fire insurance / yr
- $916 – $1,700
Heat risk 6/10 · Moderate
- Hot days now (above 106°F)
- 7 days/yr
- Hot days in 30 yrs
- 19 days/yr
Wind risk 6/10 · Moderate
- Chance of severe wind over 30 yrs
- 56.0%
Air-quality risk 2/10 · Minimal
- Unhealthy air days now
- 1 days/yr
- Unhealthy air days in 30 yrs
- 2 days/yr
Risk factors via First Street. Map © Google.
Why this score? — see what drove the B grade
The composite is a weighted blend of 9 inputs, each scored 0–100. Each bar is that input's sub-score; the figure is the points it added to the 100-point composite (weight × sub-score).
- Cash flow +30.0/30.0
- 1% rule +10.0/10.0
- DSCR +10.0/10.0
- ARV discount +7.5/15.0
- Schools +3.9/10.0
- Rent growth +3.4/5.0
- Livability +3.0/5.0
- Condition / age +2.5/5.0
- Appreciation +0.0/10.0
$82,900
🖨 Deal sheet 📄 Offer letter ✓ Due diligence
Listing remarks MLS
"Under FinCEN's new RRE Rule, transfers will be subject to reporting when buyers use entities or trusts to take title to residential real estate, or when the transaction is all cash or privately financed. " One level on corner lot with driveway parking. Needs interior updating but has 3 bedrooms and 1.5 bathrooms. Partially fenced back yard.
Key facts
- 6,534 sq ft lot
- Built 1945
- Listed 86 days
Neighborhood map
What this means for you Summary
Snapshot
- This is a 3-bed/2.0-bath single-family listed at $83k.
Deal economics
- At list price, monthly cash flow is $857 ($10k/yr) — positive.
- The deal already cash-flows at list — no discount required.
- Meets the 1% rule at list price ($2k rent vs $83k).
- Recommended offer: $78k (6.0% below list) — sets the bar for market timing.
- Cap rate 18.7% vs local median 4.5% in Calera — top-decile yield for the area; either an underpriced asset or a hidden risk that comps aren't pricing in. Stress-test before assuming the spread holds.
Location & tenants
- Location reads 59/100 on livability (#325 in AL) — a working-class tenant base; expect higher turnover. Strengths: cost of living A+, housing A+, employment A-; Watch: schools D+, amenities F, commute F.
- Shelby County (suburban): math 30% / reading 58% proficiency, ranked #16 of 129 in AL (top 12%) — families likely to look elsewhere, expect single-tenant / working-renter base with shorter leases.
- Market conditions: Rents rising (+3.7%/yr); 374 active listings in the ZIP; 12 comparable units currently listed for rent nearby; rentals at typical pace (median 16d on market — plan ~3-4 weeks tenant-placement turnaround); solid renter incomes; 987 units permitted in Shelby County in 2024 (0 in 5+ unit buildings).
Forward outlook
- Local home prices are declining (-3.0%/yr); year-one equity from $573 of loan paydown is wiped out by about $2k of value loss. Plan a longer hold.
- Shelby County population projected at +23% by 2050 — long-run rental-demand tailwind backs the buy-and-hold thesis.
- At projected returns (-3.0% appreciation + 3.7% rent growth), your $23k cash investment doubles in ~3 years — after that, you're playing with house money.
Negotiation context
- It's been on market 86 days — a 6% lower offer ($78k) is reasonable based on typical stale-listing flexibility.
- Current owner paid $58k; 43% above their basis — modest negotiation headroom, anchor on the comps not their cost.
Risks & watch-outs
- Watch-outs: built in 1945 — expect roof / HVAC / electrical / plumbing capex.
- Climate carrying-cost: major wind risk, 56% chance of damaging wind over 30y; extreme-heat days projected 7→19/yr by 2055 (HVAC capex compounding) — expect insurance premiums to compound above CPI over the hold.
Questions for the listing agent
- It's been on market 86 days. Have you received any prior offers? Is the seller open to a 6% concession, seller financing, or rate buy-down credit?
- Built in 1945 — when were the roof, HVAC, electrical panel, plumbing, and water heater last replaced?
- Why hasn't it sold? Are there any deal-killer items the seller is aware of (foundation, flood, title, zoning, code violations)?
- Is there a deadline driving the sale (1031 exchange, divorce, estate, relocation)? That informs how much negotiation room exists.
- Schools are D-rated, which usually means shorter tenancies and higher turnover. Who's the typical renter profile here, and what's been the actual vacancy rate?
- What's the average days-on-market for RENTAL listings here right now (not sales)? A rising rental-DOM trend means longer vacancies and softer asking-rent achievability than the comps imply.
- What's the recent tenant-quality profile in this submarket — average credit score on applications, eviction rate, late-payment / NSF rate, and stable-employment percentage? A property-management company in the area should have these aggregated.
- How much new for-sale + rental construction is in the pipeline within 1–3 miles? Heavy new supply typically softens prices + rents 12–24 months out; constrained supply supports both.
Investment metrics
- 1% rule
- 2.07% ✓
- Cap rate
- 18.69%
- Cash-on-cash
- 44.28%
- DSCR
- 2.97
- GRM
- 4.0
CMA / ARV
- ARV (median comp)
- $241,558
- List price
- $82,900
- Delta
- -65.68%
- Verdict
- UNDERPRICED
- Comps
- 20 within 1.0 mi
Show comp detail 12 sales within ~0.75 mi
| Address | Dist | Beds/Ba | Sqft | Sold | Price | $/sf | Match |
|---|---|---|---|---|---|---|---|
| 228 Meriweather Ln | 0.42mi | 3/2.0 | 1,076 (-1%) | 12mo | $177,000 | $164 | 69 |
| 401 Meriweather Ln | 0.52mi | 3/2.0 | 1,159 (+7%) | 6mo | $164,000 | $142 | 59 |
| 1540 19th Ave | 0.59mi | 3/2.0 | 1,104 (+2%) | 14mo | $181,500 | $164 | 58 |
| 157 Coleman Way | 0.60mi | 3/2.0 | 1,068 (-2%) | 16mo | $218,000 | $204 | 56 |
| 311 Amber Ave | 0.71mi | 3/2.0 | 1,068 (-2%) | 13mo | $228,390 | $214 | 53 |
| 1003 Meriweather Dr | 0.68mi | 3/2.0 | 1,177 (+8%) | 2mo | $225,000 | $191 | 52 |
| 319 Amber Ave | 0.71mi | 3/2.0 | 1,143 (+5%) | 11mo | $232,900 | $204 | 49 |
| 2041 Glades Dr | 0.49mi | 3/2.0 | 1,202 (+11%) | 15mo | $225,000 | $187 | 47 |
| 1001 Glades Ln | 0.51mi | 3/2.0 | 1,202 (+11%) | 15mo | $222,000 | $185 | 46 |
| 1873 19th St | 0.73mi | 3/2.0 | 1,226 (+13%) | 2mo | $260,000 | $212 | 42 |
| 213 Hampton Dr | 0.63mi | 3/2.0 | 1,204 (+11%) | 13mo | $206,000 | $171 | 42 |
| 307 Amber Ave | 0.71mi | 3/2.0 | 1,234 (+14%) | 12mo | $225,000 | $182 | 34 |
Match score weights: distance 35% · size 25% · config 20% · recency 20%. Top-matched comps best support the ARV.
Projected returns pro-forma
-3.0% appreciation · 3.67% rent growth · sell at horizon
- IRR
- 42.0%
- Equity multiple
- 2.82×
- Total profit
- $42,274
- Equity at exit
- $12,361
- IRR
- 48.4%
- Equity multiple
- 5.82×
- Total profit
- $111,847
- Equity at exit
- $7,168
Cash invested: $23,212 (down + closing). Projections, not guarantees.
Landlord ↔ Tenant lean methodology
- Overall (STATE)
- 90 Strongly Landlord-Friendly
- State Alabama
- 90 Strongly Landlord-Friendly · R+15
- County
- — inherits STATE
- City
- — inherits STATE
ZIP-level market 35040
- Home prices YoY
- -16.5%
- Rents YoY
- 3.7%
- Active inventory
- 374
- Price-to-rent
- 4.0×
Monthly cashflow live
- Estimated rent
- $1,720 high interval (Pro) →
- Mortgage (P&I)
- −$435
- Tax from tax record
- −$33 /mo · $392/yr
- Insurance
- −$35
- HOA
- −$0
- Vacancy / Maint / Mgmt
- −$361
- Net cashflow
- $857
Break-even live
UW: 25.0% down · 7.5% · 30yr · 1.5% tax · 5.0% vac · 8.0% maint · 8.0% mgmt
Financing live
Cash to close
- Down payment
- $20,725
- Closing costs
- $2,487
- Reserves months
- —
- Total cash needed
- —
Loan-product check · same deal, 3 products live
Conventional
25% down · 7.5% · 30yr
- Down + closing
- —
- Monthly P&I
- —
- Monthly cashflow
- —
- DSCR
- —
- Eligible?
- —
Personal DTI + credit; lowest rate.
DSCR
20% down · 8.5% · 30yr
- Down + closing
- —
- Monthly P&I
- —
- Monthly cashflow
- —
- DSCR
- —
- Eligible?
- —
No personal income docs; deal must DSCR.
Hard money
10% down · 12.0% · 12mo
- Down + closing
- —
- Monthly P&I
- —
- Monthly cashflow
- —
- DSCR
- —
- Eligible?
- —
Short-term bridge; refi at stabilization.
Rent comps 12 comps
| Address | Beds | Baths | Sqft | Rent | $/sqft | DOM | Units | Dist |
|---|---|---|---|---|---|---|---|---|
| 1114 Emerald Ridge Dr Calera, AL | 3.0 | 2.0 | 1166 | $1,536 | $1.32 | 3d | 1 | 0.58mi |
| 208 Hampton Dr Calera, AL | 3.0 | 2.0 | 1293 | $1,738 | $1.34 | 16d | 1 | 0.64mi |
| 127 Renwick Ln Calera, AL | 3.0 | 2.0 | 1395 | $1,501 | $1.08 | 23d | 1 | 0.67mi |
| 500 Margaret Ln Calera, AL | 3.0 | 2.0 | 1337 | $1,723 | $1.29 | 3d | 1 | 0.76mi |
| 813 Ashford Dr Calera, AL | 3.0 | 2.0 | 1068 | $1,895 | $1.77 | 23d | 1 | 0.86mi |
| 817 Ashford Dr Calera, AL | 3.0 | 2.0 | 1143 | $1,895 | $1.66 | 23d | 1 | 0.86mi |
| 821 Ashford Dr Calera, AL | 3.0 | 2.0 | 1012 | $1,895 | $1.87 | 23d | 1 | 0.86mi |
| 108 Flagstone Ln Calera, AL | 3.0 | 2.0 | 1278 | $1,485 | $1.16 | 11d | 1 | 0.88mi |
| 512 Camden Cove Cir Calera, AL | 3.0 | 2.0 | 1500 | $1,775 | $1.18 | 11d | 1 | 0.94mi |
| 2150 20th St #2 Calera, AL | 2.0 | 1.0 | 880 | $695 | $0.79 | 3d | 1 | 0.96mi |
| 100 Enclave Ave Calera, AL | 3.0 | 2.0 | 1247 | $1,585 | $1.27 | 19d | 1 | 1.06mi |
| 148 Enclave Ave Calera, AL | 3.0 | 2.0 | 1340 | $4,150 | $3.10 | 1d | 1 | 1.20mi |
Listing history 17 events
-
2026-06-18days on market $82,900 Active 86 DOM
-
2026-06-17days on market $82,900 Active 85 DOM
-
2026-06-16days on market $82,900 Active 84 DOM
-
2026-06-15days on market $82,900 Active 83 DOM
-
2026-06-13days on market $82,900 Active 81 DOM
-
2026-06-13days on market $82,900 Active 80 DOM
-
2026-06-10days on market $82,900 Active 78 DOM
-
2026-06-09days on market $82,900 Active 77 DOM
-
2026-06-08days on market $82,900 Active 76 DOM
-
2026-06-07days on market $82,900 Active 75 DOM
-
2026-06-05days on market $82,900 Active 72 DOM
-
2026-06-03days on market $82,900 Active 71 DOM
-
2026-06-02days on market $82,900 Active 70 DOM
-
2026-06-01days on market $82,900 Active 69 DOM
-
2026-05-31days on market $82,900 Active 68 DOM
-
2026-03-24$89,900 Active 353-char remark
Show marketing remark (353 chars)
"Under FinCEN's new RRE Rule, transfers will be subject to reporting when buyers use entities or trusts to take title to residential real estate, or when the transaction is all cash or privately financed. " One level on corner lot with driveway parking. Needs interior updating but has 3 bedrooms and 1.5 bathrooms. Partially fenced back yard.
-
2004-05-21soldstatus $58,000
ⓘ Source: listings_history table (triggers on properties + properties_extension) + one-shot
backfill from property_details.listing_events for pre-trigger history.
Tax reassessment forecast AL · Resets to sale price
- Current annual tax
- $392 · $33/mo
- Projected year-2 tax
- $392 · $33/mo
- Expected delta
- $0/yr ($0/mo · 0.0%)
ⓘ Screening estimate from a state-policy table — verify with the county assessor before closing.
Climate risk First Street
- Flood 1/10 Low FEMA zone X (unshaded) · 0% chance over 30 yrs
- Wildfire 4/10 Moderate
- Heat 6/10 Major 7 d/yr ≥106°F today · 19 d/yr by 30 yrs out
- Wind 6/10 Major 56% chance of damaging wind over 30 yrs
- Air quality 2/10 Low 1 unhealthy d/yr today · 2 by 30 yrs out
Nearby sold comps map
Loading sold comps map…
Walkable amenities ~0.75 mi
Loading nearby amenities…
Taxation est. · year 1
- Rental income
- $20,636
- − Mortgage interest
- −$4,644
- − Property taxes
- −$392
- − Insurance
- −$414
- − Repairs & maintenance
- −$1,651
- − Management
- −$1,651
- − Depreciation
- −$2,412
- Taxable income
- $9,473
- Est. tax owed @ 24.0%
- −$2,273
- After-tax cash flow
- $8,006/yr
For passive investors: Depreciation is non-cash, so a rental often shows a tax loss while cash-flowing — sheltering income. Rental losses are passive: they offset passive income freely, and up to $25,000/yr can offset ordinary (W-2) income if you actively participate and your MAGI is under $100k (phasing out to $0 by $150k); unused losses carry forward. On sale, claimed depreciation is recaptured at up to 25%, and gains may owe capital-gains tax (a 1031 exchange can defer both). Figures are a year-1 estimate at your 24.0% rate — not tax advice; consult a CPA.
Schools (NCES district)
- District
- Shelby County
- NCES district ID
- 0103030
- Math proficiency
- 30% ▼ -28.00%
- Reading proficiency
- 58% ▲ 2.00%
- Median HH income
- $66,672
- Composite
- 39.29/100
- National rank
- #3995
- State rank
- #16 of 129 in AL
Livability — Calera
- Score
- 59/100
- State rank
- #325
- US rank
- #19917
Category grades
Schools grade is shown separately in the Schools card above.
Census & demographics
- Census place
- Calera, AL
- County
- Shelby County · 188,970 people
- City population
- 19,304
- Metro
- Birmingham-Hoover, AL
- Population (ZIP)
- 19,304
- Household income
- $84,554
- Rent vs Own
- Severe rent burden
- 388.0
Population outlook (Shelby County) Hauer SSP2
- Today (2025)
- 237,024 people
- By 2030
- 249,868 · +5.4%
- By 2040
- 272,778 · +15.1%
- By 2050
- 291,062 · +22.8%
- By 2075
- 326,049 · +37.6%
- By 2100
- 335,870 · +41.7%
Race, ethnicity, and origin ACS 2023
- Neighborhood character
- Diverse neighborhood (Simpson 0.56)
- Race & ethnicity
- White 59% Black 30% Hispanic / Latino 9% Two or more races 3%
- Hispanic origin (detail)
- Mexican 7%
- Common ancestry
- Slovak 3% Italian 1% Serbian 1%
- Foreign-born
- 6% · Canada, China
- Languages at home
- 91% English-only · Spanish 6% Arabic 1% Chinese 1%
Political lean MEDSL · Shelby
- 2024 margin
- Solid R (+40.9) · D 29.0% · R 69.9% · Other 1.1%
- 2008→2024 swing
- +12.6pp toward D · 2008: -53.4pp · 2024: -40.9pp
- All cycles
- 2024: R+40.9 2020: R+40.4 2016: R+50.3 2012: R+55.6 2008: R+53.4
Not yet ingested
- Civics
- —
Market trends
- HPI YoY
- ▼ -43.58%
- Current HPI
- 220.2843
- Rent YoY
- ▲ 3.67%
- Metro
- Birmingham-Hoover, AL
- State GDP YoY
- ▲ 2.94%
- F500 in state
- 4
Industry mix (Fortune 500 HQ in AL)
| Industry | F500 HQs | Revenue |
|---|---|---|
| Financial Services | 1 | $8B |
|
||
| Healthcare | 1 | $5B |
|
||
Price history
+55.0% since first listed2 events — show timeline
- 2026-03-24 Listed $89,900 Greater Alabama MLS
- 2004-05-21 Sold (Public Records) $58,000 Public Records
Property tax history
+5.2%/yrLatest (2025): $392 · +83.2% YoY. Source: county tax records.
Cash-flow waterfall
monthlySold comps — $/sqft
last 12 mo · ≤1 miLoading sold comps…