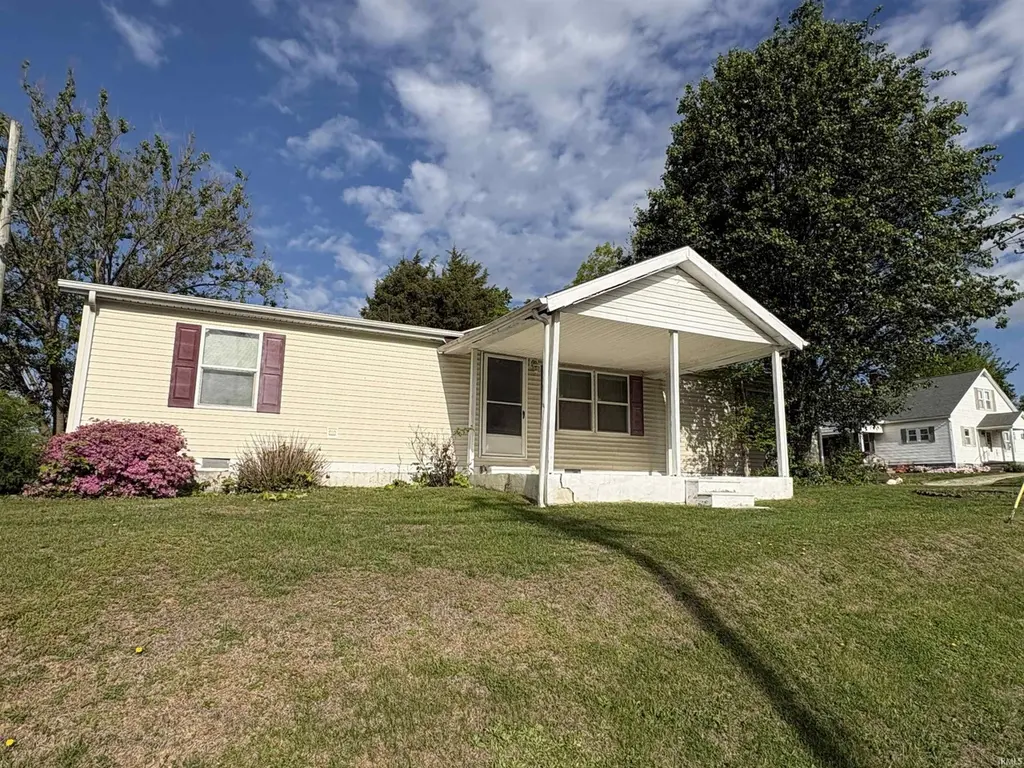
505 W Iowa St · Holland, IN
Flood risk 1/10 · Minimal
- FEMA flood zone
- X (unshaded)
- Chance of flooding over 30 yrs
- 0.0%
- Est. flood insurance / yr
- $507 – $1,088
Fire risk 1/10 · Minimal
- Est. fire insurance / yr
- $717 – $1,331
Heat risk 5/10 · Moderate
- Hot days now (above 106°F)
- 7 days/yr
- Hot days in 30 yrs
- 19 days/yr
Wind risk 2/10 · Minimal
- Chance of severe wind over 30 yrs
- 2.0%
Air-quality risk 3/10 · Minor
- Unhealthy air days now
- 2 days/yr
- Unhealthy air days in 30 yrs
- 5 days/yr
Risk factors via First Street. Map © Google.
Why this score? — see what drove the B grade
The composite is a weighted blend of 9 inputs, each scored 0–100. Each bar is that input's sub-score; the figure is the points it added to the 100-point composite (weight × sub-score).
- Cash flow +23.8/30.0
- ARV discount +15.0/15.0
- DSCR +7.7/10.0
- Appreciation +7.1/10.0
- 1% rule +6.0/10.0
- Schools +4.3/10.0
- Livability +3.4/5.0
- Rent growth +2.5/5.0
- Condition / age +2.5/5.0
$125,000
🖨 Deal sheet (PDF) 📄 Offer letter ✓ Due diligence
Listing remarks MLS
Cute corner home offering plenty of space and potential. This one owner, 4 bedroom, 2 full bath home in Holland features an open concept layout with a split bedroom floor plan. The bright and open kitchen and dining area provides great space for entertaining, along with a breakfast bar, roomy closets, and a functional layout throughout. Outside, enjoy the spacious yard, covered front porch, and patio. Conveniently located near the park, school, and churches, this home offers both comfort and location. The property is being sold as-is, and the price reflects that condition, presenting a great opportunity for buyers looking to add value.
Key facts
- Bright kitchen
- Corner home
- Dining area
Tags
Neighborhood map
What this means for you Summary
Snapshot
- This is a 4-bed/2.0-bath single-family listed at $125k.
Deal economics
- At list price, monthly cash flow is $240 ($3k/yr) — positive.
- The deal already cash-flows at list — no discount required.
- Meets the 1% rule at list price ($1k rent vs $125k).
- Recommended offer: $121k (3.0% below list) — sets the bar for market timing.
Location & tenants
- Location reads 67/100 on livability (#250 in IN) — a middle-class / working-renter tenant base. Strengths: cost of living A+, housing A+, schools B+; Watch: health & safety C-, crime D+, amenities F.
- Southwest Dubois County School Corporation (rural): math 50% / reading 50% proficiency, ranked #56 of 301 in IN (top 19%) — acceptable for families but not a draw, mixed tenant base, ~2y average lease.
- Market conditions: 3 active listings in the ZIP; 197 units permitted in Dubois County in 2024 (20 in 5+ unit buildings).
Forward outlook
- In year one you build about $6k of equity ($864 loan paydown + $5k appreciation (4.2% local appreciation)).
- Dubois County population projected to shrink 5% by 2050 — rents likely to lag national; underwrite the cash flow, not the appreciation.
- At projected returns (4.2% appreciation + 3.0% rent growth), your $35k cash investment doubles in ~4 years — after that, you're playing with house money.
- By year 6, paydown + projected appreciation supports a ~$32k cash-out refi (75% LTV) — recoverable capital for the next deal without selling this one.
Negotiation context
- It's been on market 58 days — a 3% lower offer ($121k) is reasonable based on typical stale-listing flexibility.
- 3 sale attempts since 11y ago with the ask held roughly flat each time — persistent listings suggest the price (not the market) is what's stuck; bring a comps-based counter.
- Current owner paid $64k; list at $125k implies a 97% gain — meaningful room to come down on a strong offer.
Risks & watch-outs
- Climate carrying-cost: extreme-heat days projected 7→19/yr by 2055 (HVAC capex compounding) — expect insurance premiums to compound above CPI over the hold.
Questions for the listing agent
- It's been on market 58 days. Have you received any prior offers? Is the seller open to a 3% concession, seller financing, or rate buy-down credit?
- Is there a deadline driving the sale (1031 exchange, divorce, estate, relocation)? That informs how much negotiation room exists.
- Schools are B-rated — typically a magnet for longer-tenancy family renters. What's the average tenant stay here, and is there a school-zone premium baked into asking?
- Crime grade is D in this area — have there been break-ins, vandalism, or insurance claims at this property in the last 3 years? What carrier currently insures it and at what premium?
- What's the average days-on-market for RENTAL listings here right now (not sales)? A rising rental-DOM trend means longer vacancies and softer asking-rent achievability than the comps imply.
- What's the recent tenant-quality profile in this submarket — average credit score on applications, eviction rate, late-payment / NSF rate, and stable-employment percentage? A property-management company in the area should have these aggregated.
- How much new for-sale + rental construction is in the pipeline within 1–3 miles? Heavy new supply typically softens prices + rents 12–24 months out; constrained supply supports both.
Investment metrics
- 1% rule
- 1.10% ✓
- Cap rate
- 8.60%
- Cash-on-cash
- 8.24%
- DSCR
- 1.37
- GRM
- 7.6
CMA / ARV
- ARV (median comp)
- $162,530
- List price
- $125,000
- Delta
- -23.09%
- Verdict
- UNDERPRICED
- Comps
- 3 within 1.0 mi
Show comp detail 3 sales within ~0.75 mi
| Address | Dist | Beds/Ba | Sqft | Sold | Price | $/sf | Match |
|---|---|---|---|---|---|---|---|
| 107 N Meridian St | 0.23mi | 3/2.0 (-1) | 1,440 (-1%) | 6mo | $129,880 | $90 | 77 |
| 801 W Ohio St | 0.24mi | 4/2.0 | 1,560 (+7%) | 14mo | $140,000 | $90 | 65 |
| 207 E Main St | 0.31mi | 3/1.5 (-1) | 1,258 (-14%) | 9mo | $169,900 | $135 | 49 |
Match score weights: distance 35% · size 25% · config 20% · recency 20%. Top-matched comps best support the ARV.
Projected returns pro-forma
4.17% appreciation · 3.0% rent growth · sell at horizon
- IRR
- 18.0%
- Equity multiple
- 2.09×
- Total profit
- $38,318
- Equity at exit
- $64,650
- IRR
- 18.6%
- Equity multiple
- 4.02×
- Total profit
- $105,666
- Equity at exit
- $106,769
Cash invested: $35,000 (down + closing). Projections, not guarantees.
Landlord ↔ Tenant lean methodology
- Overall (STATE)
- 90 Strongly Landlord-Friendly
- State Indiana
- 90 Strongly Landlord-Friendly · R+11
- County
- — inherits STATE
- City
- — inherits STATE
ZIP-level market 47541
- Home prices YoY
- 1.9%
- Active inventory
- 3
- Price-to-rent
- 7.6×
Monthly cashflow live
- Estimated rent
- $1,375 medium interval (Pro) →
- Mortgage (P&I)
- −$656
- Tax from tax record
- −$139 /mo · $1,663/yr
- Insurance
- −$52
- HOA
- −$0
- Vacancy / Maint / Mgmt
- −$289
- Net cashflow
- $240
Break-even live
Sensitivity live
| Price | -10% $311 | -5% $276 | +0% $240 | +5% $205 | +10% $170 |
|---|---|---|---|---|---|
| Rent | -10% $132 | -5% $186 | +0% $240 | +5% $295 | +10% $349 |
| Rate | -1.0pp $303 | -0.5pp $272 | base $240 | +0.5pp $208 | +1.0pp $175 |
UW: 25.0% down · 7.5% · 30yr · 1.5% tax · 5.0% vac · 8.0% maint · 8.0% mgmt
Financing live
Cash to close
- Down payment
- $31,250
- Closing costs
- $3,750
- Reserves months
- —
- Total cash needed
- —
Loan-product check · same deal, 3 products live
Conventional
25% down · 7.5% · 30yr
- Down + closing
- —
- Monthly P&I
- —
- Monthly cashflow
- —
- DSCR
- —
- Eligible?
- —
Personal DTI + credit; lowest rate.
DSCR
20% down · 8.5% · 30yr
- Down + closing
- —
- Monthly P&I
- —
- Monthly cashflow
- —
- DSCR
- —
- Eligible?
- —
No personal income docs; deal must DSCR.
Hard money
10% down · 12.0% · 12mo
- Down + closing
- —
- Monthly P&I
- —
- Monthly cashflow
- —
- DSCR
- —
- Eligible?
- —
Short-term bridge; refi at stabilization.
Listing history 20 events
-
2026-06-19days on market $125,000 Active 58 DOM
-
2026-06-18days on market $125,000 Active 57 DOM
-
2026-06-17days on market $125,000 Active 56 DOM
-
2026-06-16days on market $125,000 Active 55 DOM
-
2026-06-15days on market $125,000 Active 54 DOM
-
2026-06-14days on market $125,000 Active 52 DOM
-
2026-06-12days on market $125,000 Active 51 DOM
-
2026-06-09days on market $125,000 Active 48 DOM
-
2026-06-08days on market $125,000 Active 47 DOM
-
2026-06-07days on market $125,000 Active 46 DOM
-
2026-06-07days on market $125,000 Active 45 DOM
-
2026-06-04days on market $125,000 Active 42 DOM
-
2026-06-02days on market $125,000 Active 41 DOM
-
2026-06-01days on market $125,000 Active 40 DOM
-
2026-05-31days on market $125,000 Active 39 DOM
-
2026-05-31days on market $125,000 Active 38 DOM
-
2026-04-22$125,000 Active 643-char remark
Show marketing remark (643 chars)
Cute corner home offering plenty of space and potential. This one owner, 4 bedroom, 2 full bath home in Holland features an open concept layout with a split bedroom floor plan. The bright and open kitchen and dining area provides great space for entertaining, along with a breakfast bar, roomy closets, and a functional layout throughout. Outside, enjoy the spacious yard, covered front porch, and patio. Conveniently located near the park, school, and churches, this home offers both comfort and location. The property is being sold as-is, and the price reflects that condition, presenting a great opportunity for buyers looking to add value.
-
2018-12-18soldstatus $63,500
-
2018-09-24$69,900
-
2015-09-22$72,900
ⓘ Source: listings_history table (triggers on properties + properties_extension) + one-shot
backfill from property_details.listing_events for pre-trigger history.
Tax reassessment forecast IN · Partial reset (capped growth)
- Current annual tax
- $1,663 · $139/mo
- Projected year-2 tax
- $1,663 · $139/mo
- Expected delta
- $0/yr ($0/mo · 0.0%)
ⓘ Screening estimate from a state-policy table — verify with the county assessor before closing.
Climate risk First Street
- Flood 1/10 Low FEMA zone X (unshaded) · 0% chance over 30 yrs
- Wildfire 1/10 Low
- Heat 5/10 Major 7 d/yr ≥106°F today · 19 d/yr by 30 yrs out
- Wind 2/10 Low 2% chance of damaging wind over 30 yrs
- Air quality 3/10 Moderate 2 unhealthy d/yr today · 5 by 30 yrs out
Nearby sold comps map
Loading sold comps map…
Walkable amenities ~0.75 mi
Loading nearby amenities…
Taxation est. · year 1
- Rental income
- $16,506
- − Mortgage interest
- −$7,002
- − Property taxes
- −$1,663
- − Insurance
- −$625
- − Repairs & maintenance
- −$1,320
- − Management
- −$1,320
- − Depreciation
- −$3,636
- Taxable income
- $938
- Est. tax owed @ 24.0%
- −$225
- After-tax cash flow
- $2,660/yr
For passive investors: Depreciation is non-cash, so a rental often shows a tax loss while cash-flowing — sheltering income. Rental losses are passive: they offset passive income freely, and up to $25,000/yr can offset ordinary (W-2) income if you actively participate and your MAGI is under $100k (phasing out to $0 by $150k); unused losses carry forward. On sale, claimed depreciation is recaptured at up to 25%, and gains may owe capital-gains tax (a 1031 exchange can defer both). Figures are a year-1 estimate at your 24.0% rate — not tax advice; consult a CPA.
Schools (NCES district)
- District
- Southwest Dubois County School Corporation
- NCES district ID
- 1810870
- Math proficiency
- 50% ▼ -4.00%
- Reading proficiency
- 50% ▼ -1.00%
- Median HH income
- $47,814
- Composite
- 42.58/100
- National rank
- #3193
- State rank
- #56 of 301 in IN
Livability — Holland
- Score
- 67/100
- State rank
- #250
- US rank
- #10671
Category grades
Schools grade is shown separately in the Schools card above.
Census & demographics
- Census place
- Holland, IN
- Population (ZIP)
- 1,110
Population outlook (Dubois County) Hauer SSP2
- Today (2025)
- 43,036 people
- By 2030
- 43,079 · +0.1%
- By 2040
- 42,531 · -1.2%
- By 2050
- 40,762 · -5.3%
- By 2075
- 36,227 · -15.8%
- By 2100
- 28,083 · -34.7%
Race, ethnicity, and origin ACS 2023
- Neighborhood character
- Predominantly White (91%)
- Race & ethnicity
- White 91% Hispanic / Latino 8% Two or more races 5%
- Hispanic origin (detail)
- Mexican 5% Puerto Rican 1%
- Common ancestry
- Romanian 3% Danish 1% German 1%
- Foreign-born
- 7% · Canada
- Languages at home
- 95% English-only · Spanish 4% German/W. Germanic 1%
Political lean MEDSL · Dubois
- 2024 margin
- Solid R (+42.2) · D 27.8% · R 70.0% · Other 2.2%
- 2008→2024 swing
- -38.0pp toward R · 2008: -4.2pp · 2024: -42.2pp
- All cycles
- 2024: R+42.2 2020: R+40.1 2016: R+40.0 2012: R+27.7 2008: R+4.2
Not yet ingested
- Civics
- —
Market trends
- HPI YoY
- ▲ 4.17%
- Current HPI
- 222.5466
- Rent YoY
- —
- Metro
- —
- State GDP YoY
- ▲ 2.90%
- F500 in state
- 18
Industry mix (Fortune 500 HQ in IN)
| Industry | F500 HQs | Revenue |
|---|---|---|
| Industrial Machinery | 2 | $37B |
|
||
| Healthcare | 1 | $177B |
|
||
| Pharmaceuticals | 1 | $45B |
|
||
| Metals / Steel | 1 | $18B |
|
||
| Agriculture | 1 | $17B |
|
||
| Packaging | 1 | $12B |
|
||
Price history
+71.5% since first listed4 events — show timeline
- 2026-04-22 Listed $125,000 IRMLS
- 2018-12-18 Sold (MLS) $63,500 IRMLS
- 2018-09-24 Listed $69,900 IRMLS
- 2015-09-22 Listed $72,900 IRMLS
Property tax history
+17.9%/yrLatest (2024): $1,663 · +5.8% YoY. Source: county tax records.
Cash-flow waterfall
monthlySold comps — $/sqft
last 12 mo · ≤1 miLoading sold comps…