 🏗️ New Construction
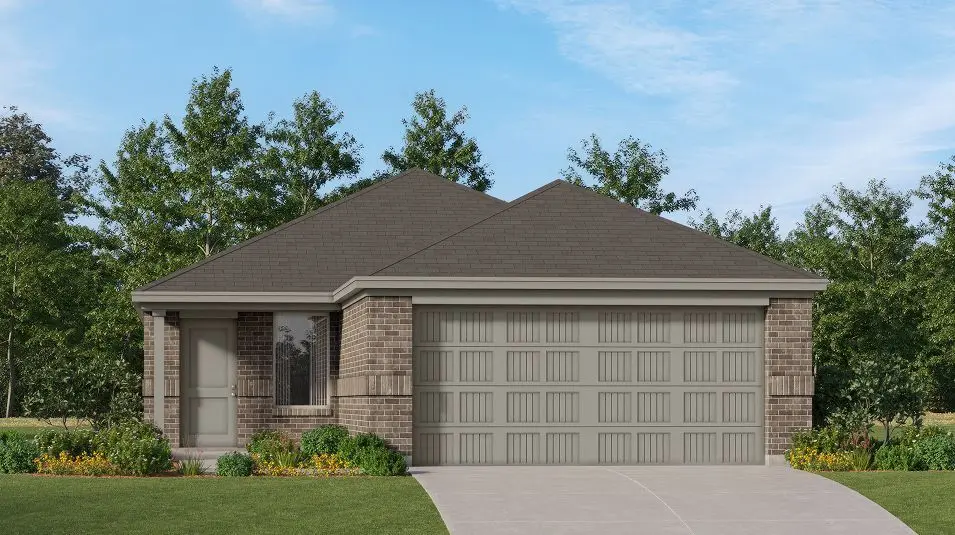
Oakridge Plan · Todd Mission, TX
Flood risk No data
- FEMA flood zone
- —
- Chance of flooding over 30 yrs
- —
- Est. flood insurance / yr
- —
Fire risk No data
- Est. fire insurance / yr
- —
Heat risk No data
- Hot days now (above threshold)
- —
- Hot days in 30 yrs
- —
Wind risk No data
- Chance of severe wind over 30 yrs
- —
Air-quality risk No data
- Unhealthy air days now
- —
- Unhealthy air days in 30 yrs
- —
Risk factors via First Street. Map © Google.
Why this score? — see what drove the D- grade
The composite is a weighted blend of 9 inputs, each scored 0–100. Each bar is that input's sub-score; the figure is the points it added to the 100-point composite (weight × sub-score).
- Cash flow +10.8/30.0
- ARV discount +7.5/15.0
- Condition / age +4.0/5.0
- Schools +3.9/10.0
- Livability +3.4/5.0
- 1% rule +3.2/10.0
- DSCR +3.1/10.0
- Rent growth +2.6/5.0
- Appreciation +0.0/10.0
$229,990
🖨 Deal sheet 📄 Offer letter ✓ Due diligence
Listing remarks MLS
This single-level home showcases a spacious open floorplan shared between the kitchen, dining area and family room for easy entertaining during gatherings. An owner's suite enjoys a private location in a rear corner of the home, complemented by an en-suite bathroom and walk-in closet. There are two secondary bedrooms along the side of the home, which are ideal for household members and hosting overnight guests.
Key facts
- Walk-in closet
- Open floorplan
- Secondary bedrooms
Tags
Neighborhood map
What this means for you Summary
Snapshot
- This is a 3-bed/2.0-bath single-family listed at $230k. Condition is rated good.
Deal economics
- At list price, monthly cash flow is $-107 ($-1k/yr) — negative.
- To cash-flow at today's rent, offer at most $223k (3.0% below list).
- To meet the 1% rule (rent ≥ 1% of price), the offer needs to be $195k (15.2% below list).
- Recommended offer: $195k (15.2% below list) — sets the bar for 1% rule.
- Cap rate 5.8% vs local median 2.9% in Todd Mission — top-decile yield for the area; either an underpriced asset or a hidden risk that comps aren't pricing in. Stress-test before assuming the spread holds.
Location & tenants
- Location reads 67/100 on livability (#549 in TX) — a middle-class / working-renter tenant base. Strengths: employment A+, cost of living A+, housing A+; Watch: schools F, amenities F, commute F.
- Magnolia ISD (rural): math 42% / reading 45% proficiency, ranked #247 of 826 in TX (top 30%) — families likely to look elsewhere, expect single-tenant / working-renter base with shorter leases.
- Market conditions: Rents flat; 2283 active listings in the ZIP; 1 comparable units currently listed for rent nearby; high-income renter base; 13,259 units permitted in Montgomery County in 2024 (1,402 in 5+ unit buildings).
Forward outlook
- Local home prices are declining (-3.0%/yr); year-one equity from $2k of loan paydown is wiped out by about $7k of value loss. Plan a longer hold.
- Montgomery County population projected at +65% by 2050 — long-run rental-demand tailwind backs the buy-and-hold thesis.
Negotiation context
- It's been on market 318 days — a 12% lower offer ($202k) is reasonable based on typical stale-listing flexibility.
- 2 sale attempts with the ask held roughly flat each time — persistent listings suggest the price (not the market) is what's stuck; bring a comps-based counter.
Questions for the listing agent
- What do current leases actually rent for vs. the listed asking? Can we see a recent rent roll and the last 12 months of T-12 income?
- It's been on market 318 days. Have you received any prior offers? Is the seller open to a 15% concession, seller financing, or rate buy-down credit?
- Why hasn't it sold? Are there any deal-killer items the seller is aware of (foundation, flood, title, zoning, code violations)?
- Is there a deadline driving the sale (1031 exchange, divorce, estate, relocation)? That informs how much negotiation room exists.
- Schools are F-rated, which usually means shorter tenancies and higher turnover. Who's the typical renter profile here, and what's been the actual vacancy rate?
- The area grade is low — what's the realistic commute time and amenity access for the typical tenant pool here? Any planned neighborhood developments (good or bad) we should know about?
- What's the average days-on-market for RENTAL listings here right now (not sales)? A rising rental-DOM trend means longer vacancies and softer asking-rent achievability than the comps imply.
- What's the recent tenant-quality profile in this submarket — average credit score on applications, eviction rate, late-payment / NSF rate, and stable-employment percentage? A property-management company in the area should have these aggregated.
- How much new for-sale + rental construction is in the pipeline within 1–3 miles? Heavy new supply typically softens prices + rents 12–24 months out; constrained supply supports both.
Investment metrics
- 1% rule
- 0.82% ✗
- Cap rate
- 5.75%
- Cash-on-cash
- -1.92%
- DSCR
- 0.91
- GRM
- 10.2
CMA / ARV
- ARV (median comp)
- $238,567
- List price
- $229,990
- Delta
- -3.60%
- Verdict
- FAIR
- Comps
- 20 within 1.0 mi
Show comp detail 12 sales within ~0.75 mi
| Address | Dist | Beds/Ba | Sqft | Sold | Price | $/sf | Match |
|---|---|---|---|---|---|---|---|
| 25292 Leather Leaf Ct | 0.10mi | 3/2.0 | 1,273 (0%) | 1mo | $232,990 | $183 | 95 |
| 25316 Leather Leaf Ct | 0.09mi | 3/2.0 | 1,273 (0%) | 2mo | $232,990 | $183 | 94 |
| 25304 Leather Leaf Ct | 0.09mi | 3/2.0 | 1,273 (0%) | 4mo | $234,990 | $185 | 92 |
| 25248 Leather Leaf Ct | 0.16mi | 3/2.0 | 1,238 (-3%) | 2mo | $220,000 | $178 | 86 |
| 25247 Leather Leaf Ct | 0.18mi | 3/2.0 | 1,367 (+7%) | 1mo | $225,000 | $165 | 78 |
| 25429 Carnation Ct | 0.00mi | 3/2.0 | 1,409 (+11%) | 5mo | $239,990 | $170 | 78 |
| 25259 Leather Leaf Ct | 0.17mi | 3/2.0 | 1,388 (+9%) | 1mo | $225,000 | $162 | 76 |
| 25296 Leather Leaf Ct | 0.10mi | 3/2.0 | 1,409 (+11%) | 2mo | $239,990 | $170 | 76 |
| 25284 Leather Leaf Ct | 0.11mi | 3/2.0 | 1,409 (+11%) | 2mo | $241,990 | $172 | 76 |
| 25288 Leather Leaf Ct | 0.11mi | 3/2.0 | 1,418 (+11%) | 3mo | $245,990 | $173 | 74 |
| 25307 Leather Leaf Ct | 0.13mi | 3/2.0 | 1,409 (+11%) | 4mo | $239,990 | $170 | 73 |
| 25303 Leather Leaf Ct | 0.13mi | 3/2.0 | 1,418 (+11%) | 4mo | $243,990 | $172 | 72 |
Match score weights: distance 35% · size 25% · config 20% · recency 20%. Top-matched comps best support the ARV.
Projected returns pro-forma
-3.0% appreciation · 0.4% rent growth · sell at horizon
- IRR
- -22.4%
- Equity multiple
- 0.25×
- Total profit
- $-50,429
- Equity at exit
- $35,571
- IRR
- -24.9%
- Equity multiple
- -0.08×
- Total profit
- $-71,962
- Equity at exit
- $20,627
Cash invested: $66,799 (down + closing). Projections, not guarantees.
Landlord ↔ Tenant lean methodology
- Overall (STATE)
- 87 Strongly Landlord-Friendly
- State Texas
- 87 Strongly Landlord-Friendly · R+5
- County
- — inherits STATE
- City
- — inherits STATE
ZIP-level market 77316
- Home prices YoY
- -10.7%
- Rents YoY
- 0.4%
- Active inventory
- 2283
- Price-to-rent
- 9.8×
Monthly cashflow live
- Estimated rent
- $1,951 medium interval (Pro) →
- Mortgage (P&I)
- −$1,251
- Tax est. 1.5%
- −$298 /mo · $3,579/yr
- Insurance
- −$99
- HOA
- −$0
- Vacancy / Maint / Mgmt
- −$410
- Net cashflow
- $-107
Break-even live
UW: 25.0% down · 7.5% · 30yr · 1.5% tax · 5.0% vac · 8.0% maint · 8.0% mgmt
Financing live
Cash to close
- Down payment
- $59,642
- Closing costs
- $7,157
- Reserves months
- —
- Total cash needed
- —
Loan-product check · same deal, 3 products live
Conventional
25% down · 7.5% · 30yr
- Down + closing
- —
- Monthly P&I
- —
- Monthly cashflow
- —
- DSCR
- —
- Eligible?
- —
Personal DTI + credit; lowest rate.
DSCR
20% down · 8.5% · 30yr
- Down + closing
- —
- Monthly P&I
- —
- Monthly cashflow
- —
- DSCR
- —
- Eligible?
- —
No personal income docs; deal must DSCR.
Hard money
10% down · 12.0% · 12mo
- Down + closing
- —
- Monthly P&I
- —
- Monthly cashflow
- —
- DSCR
- —
- Eligible?
- —
Short-term bridge; refi at stabilization.
Rent comps 1 comps
| Address | Beds | Baths | Sqft | Rent | $/sqft | DOM | Units | Dist |
|---|---|---|---|---|---|---|---|---|
| 25553 Blossom Ct Montgomery, TX | 3.0 | 2.0 | 1249 | $1,690 | $1.35 | 3d | 1 | 0.02mi |
Listing history 15 events
-
2026-06-18days on market $229,990 Active 318 DOM
-
2026-06-17days on market $229,990 Active 317 DOM
-
2026-06-16days on market $229,990 Active 316 DOM
-
2026-06-15days on market $229,990 Active 315 DOM
-
2026-06-13days on market $229,990 Active 313 DOM
-
2026-06-09days on market $229,990 Active 309 DOM
-
2026-06-08days on market $229,990 Active 308 DOM
-
2026-06-07days on market $229,990 Active 307 DOM
-
2026-06-04days on market $229,990 Active 304 DOM
-
2026-06-03days on market $229,990 Active 303 DOM
-
2026-06-02days on market $229,990 Active 302 DOM
-
2026-06-01days on market $229,990 Active 301 DOM
-
2026-05-31days on market $229,990 Active 300 DOM
-
2025-08-04$229,990 Active 414-char remark
Show marketing remark (414 chars)
This single-level home showcases a spacious open floorplan shared between the kitchen, dining area and family room for easy entertaining during gatherings. An owner's suite enjoys a private location in a rear corner of the home, complemented by an en-suite bathroom and walk-in closet. There are two secondary bedrooms along the side of the home, which are ideal for household members and hosting overnight guests.
-
2025-06-04$229,990 Active 414-char remark
Show marketing remark (414 chars)
This single-level home showcases a spacious open floorplan shared between the kitchen, dining area and family room for easy entertaining during gatherings. An owner's suite enjoys a private location in a rear corner of the home, complemented by an en-suite bathroom and walk-in closet. There are two secondary bedrooms along the side of the home, which are ideal for household members and hosting overnight guests.
ⓘ Source: listings_history table (triggers on properties + properties_extension) + one-shot
backfill from property_details.listing_events for pre-trigger history.
Nearby sold comps map
Loading sold comps map…
Walkable amenities ~0.75 mi
Loading nearby amenities…
Taxation est. · year 1
- Rental income
- $23,416
- − Mortgage interest
- −$13,363
- − Property taxes
- −$3,579
- − Insurance
- −$1,193
- − Repairs & maintenance
- −$1,873
- − Management
- −$1,873
- − Depreciation
- −$6,940
- Taxable loss
- −$5,406
- Est. tax savings @ 24.0%
- +$1,297
- After-tax cash flow
- $12/yr
For passive investors: Depreciation is non-cash, so a rental often shows a tax loss while cash-flowing — sheltering income. Rental losses are passive: they offset passive income freely, and up to $25,000/yr can offset ordinary (W-2) income if you actively participate and your MAGI is under $100k (phasing out to $0 by $150k); unused losses carry forward. On sale, claimed depreciation is recaptured at up to 25%, and gains may owe capital-gains tax (a 1031 exchange can defer both). Figures are a year-1 estimate at your 24.0% rate — not tax advice; consult a CPA.
Condition & rehab AI · 12 photos
This single-level home is in good condition with a spacious open floorplan and modern finishes. It is move-in ready and has the potential for further updates to increase its value.
Value-add opportunities
- Both Painting the exterior and interior walls — Fresh paint can enhance curb appeal and interior aesthetics.
- Both Updating the flooring in the kitchen and bathrooms — Modern flooring can improve the overall look and feel of the home.
- Both Upgrading the kitchen appliances — Newer appliances can increase the home's appeal and functionality.
- Both Adding smart home features — Smart home features can increase the home's value and appeal to tech-savvy buyers/renters.
- Both Landscaping improvements — Enhanced landscaping can improve curb appeal and add value to the home.
Renovation cost estimate screening
Value-add ROI direction
- Both Painting the exterior and interior walls — Fresh paint can enhance curb appeal and interior aesthetics. ↑
- Both Updating the flooring in the kitchen and bathrooms — Modern flooring can improve the overall look and feel of the home. ↑
- Both Upgrading the kitchen appliances — Newer appliances can increase the home's appeal and functionality. ↑
- Both Adding smart home features — Smart home features can increase the home's value and appeal to tech-savvy buyers/renters. ↑
- Both Landscaping improvements — Enhanced landscaping can improve curb appeal and add value to the home. ↑
ⓘ Cost ranges are severity-bucket heuristics (US national rule-of-thumb). Get contractor quotes + a written scope before underwriting a rehab budget.
Schools (NCES district)
- District
- Magnolia ISD
- NCES district ID
- 4828740
- Math proficiency
- 42% ▼ -7.00%
- Reading proficiency
- 45% ▼ -4.00%
- Median HH income
- $71,692
- Composite
- 39.46/100
- National rank
- #3958
- State rank
- #247 of 826 in TX
Livability — Todd Mission
- Score
- 67/100
- State rank
- #549
- US rank
- #10627
Category grades
Schools grade is shown separately in the Schools card above.
Census & demographics
- County
- Montgomery County · 663,713 people
- Metro
- Houston-The Woodlands-Sugar Land, TX
- Population (ZIP)
- 34,694
- Household income
- $124,055
- Rent vs Own
- Severe rent burden
- 273.0
Population outlook (Montgomery County) Hauer SSP2
- Today (2025)
- 713,896 people
- By 2030
- 805,263 · +12.8%
- By 2040
- 992,708 · +39.1%
- By 2050
- 1,179,590 · +65.2%
- By 2075
- 1,628,084 · +128.1%
- By 2100
- 1,937,880 · +171.5%
Race, ethnicity, and origin ACS 2023
- Neighborhood character
- Predominantly White (80%)
- Race & ethnicity
- White 80% Hispanic / Latino 14% Two or more races 11% Black 1% Asian 1%
- Hispanic origin (detail)
- Mexican 9%
- Common ancestry
- Lithuanian 6% Slovak 3% Romanian 3%
- Foreign-born
- 6% · Canada
- Languages at home
- 90% English-only · Spanish 8%
Political lean MEDSL · Montgomery
- 2024 margin
- Solid R (+45.5) · D 26.8% · R 72.3%
- 2008→2024 swing
- +7.2pp toward D · 2008: -52.7pp · 2024: -45.5pp
- All cycles
- 2024: R+45.5 2020: R+43.8 2016: R+51.4 2012: R+60.7 2008: R+52.7
Not yet ingested
- Civics
- —
Market trends
- HPI YoY
- ▼ -31.44%
- Current HPI
- 262.6973
- Rent YoY
- ▲ 0.40%
- Metro
- Houston-The Woodlands-Sugar Land, TX
- State GDP YoY
- ▲ 3.95%
- F500 in state
- 110
Industry mix (Fortune 500 HQ in TX)
| Industry | F500 HQs | Revenue |
|---|---|---|
| Energy | 16 | $1,198B |
|
||
| Technology | 5 | $198B |
|
||
| Engineering / Construction | 4 | $72B |
|
||
| Energy Services | 3 | $60B |
|
||
| Utilities | 3 | $41B |
|
||
| Healthcare | 2 | $330B |
|
||
Price history
+0.0% since first listed2 events — show timeline
- 2025-08-04 Listed $229,990 Zillow
- 2025-06-04 Listed $229,990 Zillow
Cash-flow waterfall
monthlySold comps — $/sqft
last 12 mo · ≤1 miLoading sold comps…