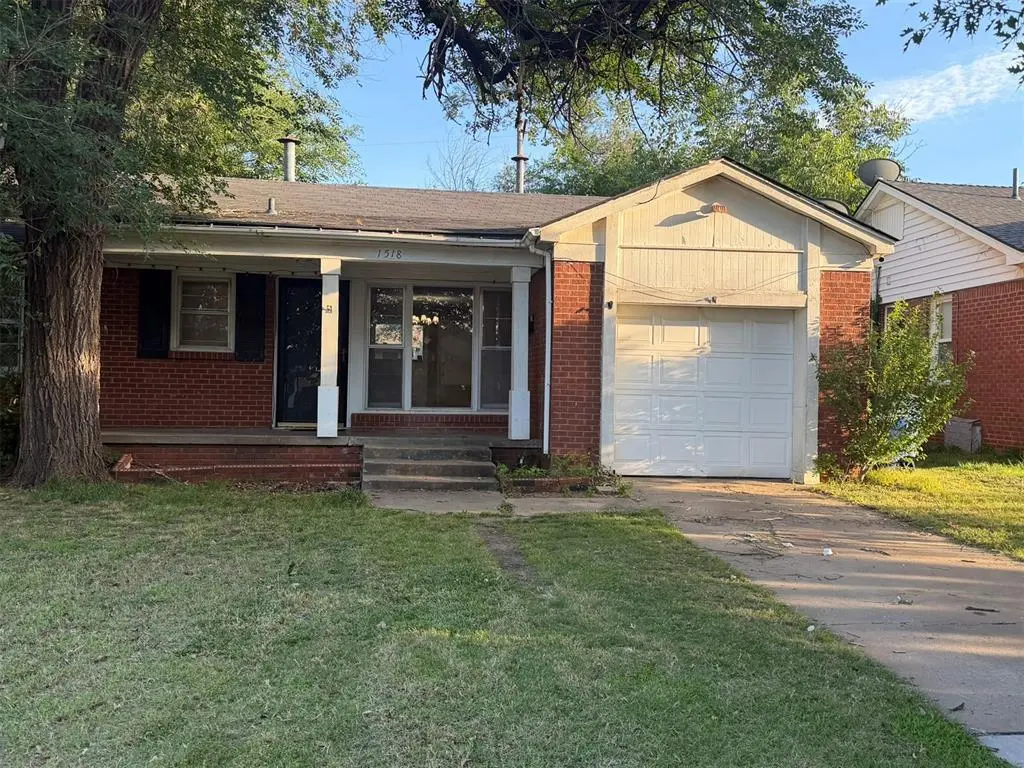
1518 Carlisle Ct · The Village, OK
Flood risk 1/10 · Minimal
- FEMA flood zone
- X (unshaded)
- Chance of flooding over 30 yrs
- 0.0%
- Est. flood insurance / yr
- $507 – $1,088
Fire risk 1/10 · Minimal
- Est. fire insurance / yr
- $2,463 – $4,575
Heat risk 6/10 · Moderate
- Hot days now (above 107°F)
- 7 days/yr
- Hot days in 30 yrs
- 19 days/yr
Wind risk 2/10 · Minimal
- Chance of severe wind over 30 yrs
- 2.0%
Air-quality risk 2/10 · Minimal
- Unhealthy air days now
- 2 days/yr
- Unhealthy air days in 30 yrs
- 2 days/yr
Risk factors via First Street. Map © Google.
Why this score? — see what drove the C grade
The composite is a weighted blend of 9 inputs, each scored 0–100. Each bar is that input's sub-score; the figure is the points it added to the 100-point composite (weight × sub-score).
- Cash flow +21.9/30.0
- ARV discount +15.0/15.0
- DSCR +7.0/10.0
- 1% rule +5.6/10.0
- Livability +3.9/5.0
- Rent growth +3.0/5.0
- Condition / age +2.5/5.0
- Schools +0.7/10.0
- Appreciation +0.0/10.0
$120,000
🖨 Deal sheet 📄 Offer letter ✓ Due diligence
Listing remarks
Come take a look at this single story brick home located in The Village. This three bedroom 1 bath home with single car garage has tons of potential. Large storage building in backyard is an added bonus. CASH AND LINES OF CREDIT ONLY AS IS SALE.
Key facts
- 5,767 sq ft lot
- Garage
- Built 1951
Tags
Property features AI
Finance
- Other: Property located in Casady Heights 2nd addition; Not homesteaded; Interior lot size approximately 0.13 acres; Listed as active; Living area reported as 1,020 (assessor)
- Financial info: Not assumable; Does not qualify for loan transfer
- HOA & community: No mandatory association dues
Exterior
- Parking: Detached or attached 1-car garage
- Home design: Single-family residence; One-story entry; Residential property; Existing property
- Construction: Brick and frame construction; Composition roof; Combination foundation
- Exterior features: Covered porch; Interior lot
Interior
- Bedrooms: Three bedrooms
- Bathrooms: One full bathroom
- Interior features: Living area with one living space; No fireplace
Neighborhood map
What this means for you Summary
Snapshot
- This is a 2-bed/1.0-bath single-family listed at $120k.
Deal economics
- At list price, monthly cash flow is $189 ($2k/yr) — positive.
- The deal already cash-flows at list — no discount required.
- Meets the 1% rule at list price ($1k rent vs $120k).
- Cap rate 8.2% vs local median 4.4% in The Village — top-decile yield for the area; either an underpriced asset or a hidden risk that comps aren't pricing in. Stress-test before assuming the spread holds.
Location & tenants
- Location reads 77/100 on livability (#9 in OK, #3,145 nationally) — a middle-class / working-renter tenant base. Strengths: cost of living A+, housing A+, employment A-; Watch: amenities D-, commute F.
- Oklahoma City (urban): math 7% / reading 10% proficiency, ranked #254 of 270 in OK (top 94%) — low school quality limits family demand, transient renter base, plan for 1-2y turnover; 82% free/reduced lunch — lower-income household profile, screen leases tightly.
- Zoned schools: Ridgeview Es (math 17% / reading 22%, grade F, #479 of 845 statewide, top 63%, 395 students, 0% FRL); John Marshall Hs (math 2% / reading 8%, grade F, #430 of 447 statewide, top 99%, 829 students, 0% FRL) — zoned schools average 0% FRL vs 82% district-wide (82 pts lower); this property's tenant base skews higher-income than the district average.
- Market conditions: Rents rising (+2.0%/yr); 333 active listings in the ZIP; 40 comparable units currently listed for rent nearby; rentals at typical pace (median 16d on market — plan ~3-4 weeks tenant-placement turnaround); 5,365 units permitted in Oklahoma County in 2024 (569 in 5+ unit buildings).
Forward outlook
- Local home prices are declining (-3.0%/yr); year-one equity from $830 of loan paydown is wiped out by about $4k of value loss. Plan a longer hold.
- Oklahoma County population projected at +41% by 2050 — long-run rental-demand tailwind backs the buy-and-hold thesis.
Negotiation context
- Only 1 days on market — expect competitive offers; lowballing is unlikely to land.
- Current owner paid $20k; list at $120k implies a 500% gain — meaningful room to come down on a strong offer.
Risks & watch-outs
- Watch-outs: built in 1951 — expect roof / HVAC / electrical / plumbing capex.
- Climate carrying-cost: extreme-heat days projected 7→19/yr by 2055 (HVAC capex compounding) — expect insurance premiums to compound above CPI over the hold.
Questions for the listing agent
- Built in 1951 — when were the roof, HVAC, electrical panel, plumbing, and water heater last replaced?
- Is there a deadline driving the sale (1031 exchange, divorce, estate, relocation)? That informs how much negotiation room exists.
- Schools are A-rated — typically a magnet for longer-tenancy family renters. What's the average tenant stay here, and is there a school-zone premium baked into asking?
- What's the average days-on-market for RENTAL listings here right now (not sales)? A rising rental-DOM trend means longer vacancies and softer asking-rent achievability than the comps imply.
- What's the recent tenant-quality profile in this submarket — average credit score on applications, eviction rate, late-payment / NSF rate, and stable-employment percentage? A property-management company in the area should have these aggregated.
- How much new for-sale + rental construction is in the pipeline within 1–3 miles? Heavy new supply typically softens prices + rents 12–24 months out; constrained supply supports both.
Investment metrics
- 1% rule
- 1.06% ✓
- Cap rate
- 8.18%
- Cash-on-cash
- 6.75%
- DSCR
- 1.30
- GRM
- 7.9
CMA / ARV
- ARV (on-the-fly)
- $162,180
- Comps found
- 12
Show comp detail 12 sales within ~0.75 mi
| Address | Dist | Beds/Ba | Sqft | Sold | Price | $/sf | Match |
|---|---|---|---|---|---|---|---|
| 1310 NW 84th St | 0.60mi | 3/1.0 (+1) | 1,024 (+0%) | 1mo | $148,400 | $145 | 66 |
| 1925 Westchester Dr | 0.62mi | 3/1.0 (+1) | 1,026 (+1%) | 1mo | $120,000 | $117 | 64 |
| 1515 Downing St | 0.19mi | 3/1.0 (+1) | 1,171 (+15%) | 2mo | $182,000 | $155 | 60 |
| 1221 NW 83rd St | 0.68mi | 3/1.0 (+1) | 996 (-2%) | 1mo | $161,000 | $162 | 58 |
| 1419 NW 98th St | 0.74mi | 2/2.0 | 1,040 (+2%) | 1mo | $160,000 | $154 | 58 |
| 1924 Hasley Dr | 0.64mi | 3/1.0 (+1) | 1,074 (+5%) | 2mo | $200,000 | $186 | 54 |
| 904 Westchester Dr | 0.71mi | 3/1.0 (+1) | 980 (-4%) | 1mo | $155,000 | $158 | 54 |
| 1817 Oxford Way | 0.46mi | 2/1.0 | 870 (-15%) | 0mo | $145,000 | $167 | 54 |
| 1732 Westchester Dr | 0.43mi | 3/1.0 (+1) | 1,159 (+14%) | 2mo | $232,000 | $200 | 51 |
| 1317 NW 95th St | 0.67mi | 2/1.0 | 1,132 (+11%) | 2mo | $105,000 | $93 | 49 |
| 2143 Carlton Way | 0.57mi | 3/1.0 (+1) | 1,155 (+13%) | 0mo | $185,000 | $160 | 46 |
| 1335 NW 94th St | 0.59mi | 3/1.5 (+1) | 1,162 (+14%) | 0mo | $185,000 | $159 | 42 |
Match score weights: distance 35% · size 25% · config 20% · recency 20%. Top-matched comps best support the ARV.
Projected returns pro-forma
-3.0% appreciation · 2.05% rent growth · sell at horizon
- IRR
- -7.0%
- Equity multiple
- 0.74×
- Total profit
- $-8,604
- Equity at exit
- $17,892
- IRR
- 1.4%
- Equity multiple
- 1.10×
- Total profit
- $3,208
- Equity at exit
- $10,375
Cash invested: $33,600 (down + closing). Projections, not guarantees.
Landlord ↔ Tenant lean methodology
- Overall (STATE)
- 83 Strongly Landlord-Friendly
- State Oklahoma
- 83 Strongly Landlord-Friendly · R+20
- County
- — inherits STATE
- City
- — inherits STATE
ZIP-level market 73120
- Rents YoY
- 2.0%
- Active inventory
- 333
- Price-to-rent
- 7.9×
Monthly cashflow live
- Estimated rent
- $1,266 high interval (Pro) →
- Mortgage (P&I)
- −$629
- Tax from tax record
- −$132 /mo · $1,586/yr
- Insurance
- −$50
- HOA
- −$0
- Vacancy / Maint / Mgmt
- −$266
- Net cashflow
- $189
Break-even live
UW: 25.0% down · 7.5% · 30yr · 1.5% tax · 5.0% vac · 8.0% maint · 8.0% mgmt
Financing live
Cash to close
- Down payment
- $30,000
- Closing costs
- $3,600
- Reserves months
- —
- Total cash needed
- —
Loan-product check · same deal, 3 products live
Conventional
25% down · 7.5% · 30yr
- Down + closing
- —
- Monthly P&I
- —
- Monthly cashflow
- —
- DSCR
- —
- Eligible?
- —
Personal DTI + credit; lowest rate.
DSCR
20% down · 8.5% · 30yr
- Down + closing
- —
- Monthly P&I
- —
- Monthly cashflow
- —
- DSCR
- —
- Eligible?
- —
No personal income docs; deal must DSCR.
Hard money
10% down · 12.0% · 12mo
- Down + closing
- —
- Monthly P&I
- —
- Monthly cashflow
- —
- DSCR
- —
- Eligible?
- —
Short-term bridge; refi at stabilization.
Rent comps 40 comps
| Address | Beds | Baths | Sqft | Rent | $/sqft | DOM | Units | Dist |
|---|---|---|---|---|---|---|---|---|
| 1618 Oxford Way Oklahoma City, OK | 3.0 | 1.0 | 1039 | $1,350 | $1.30 | 24d | 1 | 0.23mi |
| 1707 Brighton Ave Oklahoma City, OK | 3.0 | 2.0 | 1168 | $1,300 | $1.11 | 3d | 1 | 0.29mi |
| 1304 Downing St Oklahoma City, OK | 2.0 | 1.0 | 1345 | $1,395 | $1.04 | 4d | 1 | 0.30mi |
| 1622 W Britton Rd Oklahoma City, OK | 3.0 | 2.0 | 1370 | $1,460 | $1.07 | 21d | 1 | 0.30mi |
| 1702 W Britton Rd Oklahoma City, OK | 2.0 | 1.0 | 950 | $1,195 | $1.26 | 2d | 1 | 0.30mi |
| 1708 Sheffield Rd Oklahoma City, OK | 3.0 | 1.0 | 1057 | $1,400 | $1.32 | 2d | 1 | 0.31mi |
| 1435 NW 91st St Oklahoma City, OK | 2.0 | 1.5 | 1090 | $1,000 | $0.92 | 44d | 1 | 0.38mi |
| 1434 NW 92nd St Unit 3 Oklahoma City, OK | 2.0 | 1.5 | 950 | $915 | $0.96 | 44d | 1 | 0.39mi |
| 1441 NW 92nd St Oklahoma City, OK | 1.0–2.0 | 1.0 | 725 | $850 | $1.17 | 44d | 1 | 0.39mi |
| 1425 NW 94th St Oklahoma City, OK | 2.0 | 1.0 | 816 | $795 | $0.97 | 21d | 1 | 0.51mi |
| 1417 NW 95th St Oklahoma City, OK | 2.0 | 1.0 | 916 | $1,085 | $1.18 | 24d | 1 | 0.58mi |
| 9721 Georgia Ave Oklahoma City, OK | 3.0 | 2.0 | 1442 | $1,685 | $1.17 | 4d | 1 | 0.58mi |
| 1913 Downing St Oklahoma City, OK | 2.0 | 1.0 | 940 | $1,245 | $1.32 | 2d | 1 | 0.62mi |
| 1913 Downing St Oklahoma City, OK | 2.0 | 1.0 | 940 | $1,245 | $1.32 | 2d | 1 | 0.62mi |
| 1216 NW 84th St Oklahoma City, OK | 2.0 | 1.5 | 1140 | $900 | $0.79 | 4d | 1 | 0.64mi |
| 9519 Stratford Dr Oklahoma City, OK | 3.0 | 1.0 | 1141 | $1,450 | $1.27 | 2d | 1 | 0.65mi |
| 1133 NW 84th St Oklahoma City, OK | 3.0 | 1.0 | 884 | $1,150 | $1.30 | 24d | 1 | 0.74mi |
| 2024 Churchill Way Oklahoma City, OK | 3.0 | 1.0 | 1278 | $1,500 | $1.17 | 4d | 1 | 0.74mi |
| 1214 NW 81st St Oklahoma City, OK | 3.0 | 1.0 | 1100 | $1,350 | $1.23 | 2d | 1 | 0.75mi |
| 2104 Churchill Way Oklahoma City, OK | 3.0 | 1.0 | 866 | $1,365 | $1.58 | 2d | 1 | 0.78mi |
| 1000 NW 88th St Oklahoma City, OK | 1.0 | 1.0 | 849 | $745 | $0.88 | 2d | 2 | 0.79mi |
| 1000 NW 88th St Oklahoma City, OK | 1.0 | 1.0 | 850 | $875 | $1.03 | 44d | 4 | 0.79mi |
| 2116 Andover Ct Oklahoma City, OK | 3.0 | 1.0 | 1103 | $1,495 | $1.36 | 4d | 1 | 0.80mi |
| 2113 Churchill Pl Oklahoma City, OK | 3.0 | 1.0 | 1025 | $1,250 | $1.22 | 44d | 1 | 0.80mi |
| 2300 Carlton Way Oklahoma City, OK | 1.0 | 1.0 | 700 | $899 | $1.28 | 16d | 1 | 0.80mi |
| 2204 Downing St Oklahoma City, OK | 2.0 | 1.0 | 750 | $1,295 | $1.73 | 20d | 1 | 0.84mi |
| 2000 Lanesboro Dr Oklahoma City, OK | 3.0 | 2.0 | 1236 | $1,550 | $1.25 | 44d | 1 | 0.85mi |
| 10104 Haverhill Pl Oklahoma City, OK | 3.0 | 2.0 | 1188 | $1,550 | $1.30 | 15d | 1 | 0.87mi |
| 1025 NW 86th St Oklahoma City, OK | 2.0 | 1.5 | 1100 | $1,000 | $0.91 | 44d | 1 | 0.88mi |
| 2216 Hasley Dr Oklahoma City, OK | 2.0 | 1.0 | 750 | $1,400 | $1.87 | 44d | 1 | 0.90mi |
| 2216 Hasley Dr Oklahoma City, OK | 2.0 | 1.0 | 750 | $1,400 | $1.87 | 20d | 1 | 0.90mi |
| 1720 Castle St Oklahoma City, OK | 3.0 | 2.0 | 1428 | $1,800 | $1.26 | 44d | 1 | 0.91mi |
| 745 NW 89th St Oklahoma City, OK | 3.0 | 1.0 | 1000 | $1,275 | $1.27 | 2d | 1 | 1.00mi |
| 912 NW 98th St Oklahoma City, OK | 3.0 | 1.0 | 1364 | $1,250 | $0.92 | 44d | 1 | 1.07mi |
| 911 NW 98th St Oklahoma City, OK | 3.0 | 1.0 | 1122 | $1,100 | $0.98 | 2d | 1 | 1.09mi |
| 2801 Croydon Ct Oklahoma City, OK | 2.0 | 1.0 | 1102 | $1,550 | $1.41 | 2d | 1 | 1.10mi |
| 10517 N McKinley Ave Oklahoma City, OK | 3.0 | 1.5 | 1219 | $1,695 | $1.39 | 4d | 1 | 1.15mi |
| 2632 Kings Way Oklahoma City, OK | 3.0 | 1.5 | 1496 | $1,600 | $1.07 | 44d | 1 | 1.18mi |
| 9909 Sunnymeade Pl Oklahoma City, OK | 3.0 | 2.0 | 1325 | $1,695 | $1.28 | 2d | 1 | 1.22mi |
| 9913 Sunnymeade Pl Oklahoma City, OK | 3.0 | 1.5 | 1284 | $1,695 | $1.32 | 24d | 1 | 1.23mi |
Listing history 2 events
-
2026-06-07remarks 245-char remark
-
2026-06-07$120,000 Pending 1 DOM
ⓘ Source: listings_history table (triggers on properties + properties_extension) + one-shot
backfill from property_details.listing_events for pre-trigger history.
Tax reassessment forecast OK · Resets to sale price
- Current annual tax
- $1,586 · $132/mo
- Projected year-2 tax
- $1,586 · $132/mo
- Expected delta
- $0/yr ($0/mo · 0.0%)
ⓘ Screening estimate from a state-policy table — verify with the county assessor before closing.
Climate risk First Street
- Flood 1/10 Low FEMA zone X (unshaded) · 0% chance over 30 yrs
- Wildfire 1/10 Low
- Heat 6/10 Major 7 d/yr ≥107°F today · 19 d/yr by 30 yrs out
- Wind 2/10 Low 2% chance of damaging wind over 30 yrs
- Air quality 2/10 Low 2 unhealthy d/yr today · 2 by 30 yrs out
Nearby sold comps map
Loading sold comps map…
Walkable amenities ~0.75 mi
Loading nearby amenities…
Taxation est. · year 1
- Rental income
- $15,196
- − Mortgage interest
- −$6,722
- − Property taxes
- −$1,586
- − Insurance
- −$600
- − Repairs & maintenance
- −$1,216
- − Management
- −$1,216
- − Depreciation
- −$3,491
- Taxable income
- $366
- Est. tax owed @ 24.0%
- −$88
- After-tax cash flow
- $2,179/yr
For passive investors: Depreciation is non-cash, so a rental often shows a tax loss while cash-flowing — sheltering income. Rental losses are passive: they offset passive income freely, and up to $25,000/yr can offset ordinary (W-2) income if you actively participate and your MAGI is under $100k (phasing out to $0 by $150k); unused losses carry forward. On sale, claimed depreciation is recaptured at up to 25%, and gains may owe capital-gains tax (a 1031 exchange can defer both). Figures are a year-1 estimate at your 24.0% rate — not tax advice; consult a CPA.
Schools (NCES district)
- District
- Oklahoma City
- NCES district ID
- 4022770
- Math proficiency
- 7% ▼ -5.00%
- Reading proficiency
- 10% ▼ -6.00%
- Median HH income
- $35,606
- Composite
- 7.0/100
- National rank
- #9970
- State rank
- #254 of 270 in OK
Livability — The Village
- Score
- 77/100
- State rank
- #9
- US rank
- #3145
Category grades
Schools grade is shown separately in the Schools card above.
Census & demographics
- Census place
- The Village, OK
- County
- Oklahoma County · 771,644 people
- Metro
- Oklahoma City, OK
- Population (ZIP)
- 35,559
- Household income
- $64,745
- Rent vs Own
- Severe rent burden
- 2029.0
Population outlook (Oklahoma County) Hauer SSP2
- Today (2025)
- 911,875 people
- By 2030
- 982,413 · +7.7%
- By 2040
- 1,130,468 · +24.0%
- By 2050
- 1,288,422 · +41.3%
- By 2075
- 1,711,482 · +87.7%
- By 2100
- 2,088,448 · +129.0%
Race, ethnicity, and origin ACS 2023
- Neighborhood character
- Diverse neighborhood (Simpson 0.62)
- Race & ethnicity
- White 57% Black 21% Two or more races 11% Hispanic / Latino 7% Native American 3% Asian 2%
- Hispanic origin (detail)
- Mexican 4%
- Common ancestry
- Italian 3% Slovak 2% Lithuanian 2%
- Foreign-born
- 7% · Canada, China, Jamaica
- Languages at home
- 92% English-only · Spanish 4% French/Haitian/Cajun 1% Other Asian/Pacific 1%
Political lean MEDSL · Oklahoma
- 2024 margin
- Toss-up / Even · D 48.0% · R 49.7% · Other 2.3%
- 2008→2024 swing
- +15.1pp toward D · 2008: -16.8pp · 2024: -1.7pp
- All cycles
- 2024: R+1.7 2020: R+1.1 2016: R+10.5 2012: R+16.7 2008: R+16.8
Not yet ingested
- Civics
- —
Market trends
- HPI YoY
- ▼ -279.69%
- Current HPI
- 227.2832
- Rent YoY
- ▲ 2.05%
- Metro
- Oklahoma City, OK
- State GDP YoY
- ▲ 1.55%
- F500 in state
- 6
Industry mix (Fortune 500 HQ in OK)
| Industry | F500 HQs | Revenue |
|---|---|---|
| Energy | 3 | $48B |
|
||
Price history
+500.0% since first listed3 events — show timeline
- 2026-06-06 Pending — MLSOK
- 2026-06-05 Listed $120,000 MLSOK
- 1988-07-21 Sold (Public Records) $20,000 Public Records
Property tax history
+7.1%/yrLatest (2025): $1,586 · +2.9% YoY. Source: county tax records.
Cash-flow waterfall
monthlySold comps — $/sqft
last 12 mo · ≤1 miLoading sold comps…