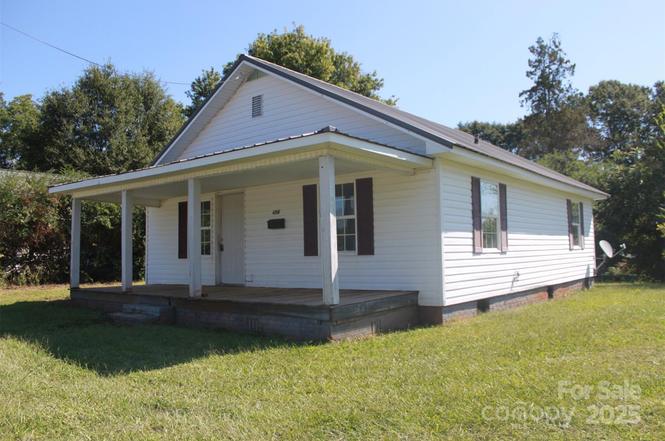
496 Spindale St · Spindale, NC
Flood risk 1/10 · Minimal
- FEMA flood zone
- X (unshaded)
- Chance of flooding over 30 yrs
- 0.0%
- Est. flood insurance / yr
- $507 – $1,088
Fire risk 4/10 · Minor
- Est. fire insurance / yr
- $906 – $1,684
Heat risk 6/10 · Moderate
- Hot days now (above 105°F)
- 7 days/yr
- Hot days in 30 yrs
- 17 days/yr
Wind risk 2/10 · Minimal
- Chance of severe wind over 30 yrs
- 1.0%
Air-quality risk 3/10 · Minor
- Unhealthy air days now
- 3 days/yr
- Unhealthy air days in 30 yrs
- 3 days/yr
Risk factors via First Street. Map © Google.
Why this score? — see what drove the B- grade
The composite is a weighted blend of 9 inputs, each scored 0–100. Each bar is that input's sub-score; the figure is the points it added to the 100-point composite (weight × sub-score).
- Cash flow +23.2/30.0
- Appreciation +10.0/10.0
- DSCR +7.5/10.0
- ARV discount +7.5/15.0
- 1% rule +5.8/10.0
- Schools +3.6/10.0
- Livability +3.4/5.0
- Rent growth +2.5/5.0
- Condition / age +2.5/5.0
$94,000
🖨 Deal sheet 📄 Offer letter ✓ Due diligence
Listing remarks
Don't miss the opportunity to make this charming bungalow your very own. This cozy two-bedroom, one-bathroom home is ready for all your grand ideas—a large living room with an abundance of natural light. The sizable kitchen is spacious enough for an island and features a charming pantry with ample shelving. The yard is level and manageable. The exterior features vinyl siding, a metal roof, and updated windows. Natural gas is available for a wall and floor heater, but there is no air conditioning. Home is within walking distance of downtown shops and restaurants. The outbuilding in the back could be brought up to speed to be used for tons of storage, woodworking, or extra hangout space
Key facts
- Sizable kitchen
- Level yard
- Metal roof
Tags
Property features AI
Finance
- Other: Zoned R-43 (specification R6)
- HOA & community: No HOA
Exterior
- Parking: Driveway (no main-level garage)
- Utilities: Public water; Public sewer
- Home design: Single-family residence; Site-built construction; One story; Crawl space foundation
- Construction: Vinyl exterior; Metal roof
- Exterior features: Outbuilding on the property; Roads are gravel and paved; publicly maintained
Interior
- Kitchen: No appliances listed for the kitchen
- Bedrooms: Two bedrooms on the main level
- Bathrooms: One full bathroom on the main level
- Heating & cooling: Natural gas heating; Additional heating noted as 'other' (see remarks); Window cooling units
- Interior features: One-room main living area; No built-in appliances listed
- Laundry & utility: No laundry facilities (none listed)
Neighborhood map
What this means for you Summary
Snapshot
- This is a 2-bed/1.0-bath single-family listed at $94k.
Deal economics
- At list price, monthly cash flow is $171 ($2k/yr) — positive.
- The deal already cash-flows at list — no discount required.
- Meets the 1% rule at list price ($1k rent vs $94k).
- Recommended offer: $83k (12.0% below list) — sets the bar for market timing.
Location & tenants
- Location reads 67/100 on livability (#211 in NC) — a middle-class / working-renter tenant base. Strengths: cost of living A+, health & safety A, housing B; Watch: crime C-, amenities F, commute F.
- Rutherford County Schools (rural): math 43% / reading 44% proficiency, ranked #98 of 178 in NC (top 55%) — families likely to look elsewhere, expect single-tenant / working-renter base with shorter leases; 60% free/reduced lunch — lower-income household profile, screen leases tightly.
- Zoned schools: Spindale Elementary School (math 27% / reading 37%, grade F, #908 of 1,410 statewide, top 67%, 341 students, 99% FRL); R-S Central High School (math 62% / reading 42%, grade D+, #292 of 535 statewide, top 56%, 758 students, 100% FRL) — zoned schools average 99% FRL vs 60% district-wide (39 pts higher); higher-poverty schools than district average — tighter screening recommended.
- Market conditions: 55 active listings in the ZIP; 193 units permitted in Rutherford County in 2024 (0 in 5+ unit buildings).
Forward outlook
- In year one you build about $10k of equity ($650 loan paydown + $9k appreciation (10.0% local appreciation)).
- Rutherford County population projected at -17% by 2050 — secular population decline; favor cash flow + early exit over multi-decade hold.
- At projected returns (10.0% appreciation + 3.0% rent growth), your $26k cash investment doubles in ~3 years — after that, you're playing with house money.
- By year 4, paydown + projected appreciation supports a ~$36k cash-out refi (75% LTV) — recoverable capital for the next deal without selling this one.
Negotiation context
- It's been on market 280 days — a 12% lower offer ($83k) is reasonable based on typical stale-listing flexibility.
- 2 sale attempts; this cycle's ask has dropped $36k (28%) from the opening price — seller is motivated, your offer sets the floor, not the list.
Risks & watch-outs
- Watch-outs: built in 1920 — expect roof / HVAC / electrical / plumbing capex.
- Climate carrying-cost: extreme-heat days projected 7→17/yr by 2055 (HVAC capex compounding) — expect insurance premiums to compound above CPI over the hold.
Questions for the listing agent
- It's been on market 280 days. Have you received any prior offers? Is the seller open to a 12% concession, seller financing, or rate buy-down credit?
- Built in 1920 — when were the roof, HVAC, electrical panel, plumbing, and water heater last replaced?
- Why hasn't it sold? Are there any deal-killer items the seller is aware of (foundation, flood, title, zoning, code violations)?
- Is there a deadline driving the sale (1031 exchange, divorce, estate, relocation)? That informs how much negotiation room exists.
- Schools are D-rated, which usually means shorter tenancies and higher turnover. Who's the typical renter profile here, and what's been the actual vacancy rate?
- What's the average days-on-market for RENTAL listings here right now (not sales)? A rising rental-DOM trend means longer vacancies and softer asking-rent achievability than the comps imply.
- What's the recent tenant-quality profile in this submarket — average credit score on applications, eviction rate, late-payment / NSF rate, and stable-employment percentage? A property-management company in the area should have these aggregated.
- How much new for-sale + rental construction is in the pipeline within 1–3 miles? Heavy new supply typically softens prices + rents 12–24 months out; constrained supply supports both.
Investment metrics
- 1% rule
- 1.08% ✓
- Cap rate
- 8.47%
- Cash-on-cash
- 7.79%
- DSCR
- 1.35
- GRM
- 7.7
CMA / ARV
No comps found within radius.
Projected returns pro-forma
10.0% appreciation · 3.0% rent growth · sell at horizon
- IRR
- 30.0%
- Equity multiple
- 3.36×
- Total profit
- $62,081
- Equity at exit
- $84,683
- IRR
- 26.0%
- Equity multiple
- 7.62×
- Total profit
- $174,274
- Equity at exit
- $182,621
Cash invested: $26,320 (down + closing). Projections, not guarantees.
Landlord ↔ Tenant lean methodology
- Overall (STATE)
- 85 Strongly Landlord-Friendly
- State North Carolina
- 85 Strongly Landlord-Friendly · R+3
- County
- — inherits STATE
- City
- — inherits STATE
ZIP-level market 28160
- Home prices YoY
- 3.2%
- Active inventory
- 55
- Price-to-rent
- 7.7×
Monthly cashflow live
- Estimated rent
- $1,020 medium interval (Pro) →
- Mortgage (P&I)
- −$493
- Tax from tax record
- −$103 /mo · $1,231/yr
- Insurance
- −$39
- HOA
- −$0
- Vacancy / Maint / Mgmt
- −$214
- Net cashflow
- $171
Break-even live
UW: 25.0% down · 7.5% · 30yr · 1.5% tax · 5.0% vac · 8.0% maint · 8.0% mgmt
Financing live
Cash to close
- Down payment
- $23,500
- Closing costs
- $2,820
- Reserves months
- —
- Total cash needed
- —
Loan-product check · same deal, 3 products live
Conventional
25% down · 7.5% · 30yr
- Down + closing
- —
- Monthly P&I
- —
- Monthly cashflow
- —
- DSCR
- —
- Eligible?
- —
Personal DTI + credit; lowest rate.
DSCR
20% down · 8.5% · 30yr
- Down + closing
- —
- Monthly P&I
- —
- Monthly cashflow
- —
- DSCR
- —
- Eligible?
- —
No personal income docs; deal must DSCR.
Hard money
10% down · 12.0% · 12mo
- Down + closing
- —
- Monthly P&I
- —
- Monthly cashflow
- —
- DSCR
- —
- Eligible?
- —
Short-term bridge; refi at stabilization.
Listing history 22 events
-
2026-06-19days on market $94,000 Active 280 DOM
-
2026-06-18days on market $94,000 Active 279 DOM
-
2026-06-17days on market $94,000 Active 278 DOM
-
2026-06-16days on market $94,000 Active 277 DOM
-
2026-06-15days on market $94,000 Active 276 DOM
-
2026-06-14days on market $94,000 Active 274 DOM
-
2026-06-13days on market $94,000 Active 273 DOM
-
2026-06-10days on market $94,000 Active 271 DOM
-
2026-06-09days on market $94,000 Active 270 DOM
-
2026-06-08days on market $94,000 Active 269 DOM
-
2026-06-07days on market $94,000 Active 268 DOM
-
2026-06-02days on market $94,000 Active 263 DOM
-
2026-06-01days on market $94,000 Active 262 DOM
-
2026-05-31days on market $94,000 Active 261 DOM
-
2026-05-30days on market $94,000 Active 260 DOM
-
2026-03-30price $94,000
-
2026-02-25status Active
-
2025-12-12historical Active Under Contract
-
2025-12-03price $99,000
-
2025-11-23price $109,000
-
2025-10-22price $119,000
-
2025-09-12$130,000 Active
ⓘ Source: listings_history table (triggers on properties + properties_extension) + one-shot
backfill from property_details.listing_events for pre-trigger history.
Tax reassessment forecast NC · Resets to sale price
- Current annual tax
- $1,231 · $103/mo
- Projected year-2 tax
- $1,231 · $103/mo
- Expected delta
- $0/yr ($0/mo · 0.0%)
ⓘ Screening estimate from a state-policy table — verify with the county assessor before closing.
Climate risk First Street
- Flood 1/10 Low FEMA zone X (unshaded) · 0% chance over 30 yrs
- Wildfire 4/10 Moderate
- Heat 6/10 Major 7 d/yr ≥105°F today · 17 d/yr by 30 yrs out
- Wind 2/10 Low 100% chance of damaging wind over 30 yrs
- Air quality 3/10 Moderate 3 unhealthy d/yr today · 3 by 30 yrs out
Nearby sold comps map
Loading sold comps map…
Walkable amenities ~0.75 mi
Loading nearby amenities…
Taxation est. · year 1
- Rental income
- $12,235
- − Mortgage interest
- −$5,265
- − Property taxes
- −$1,231
- − Insurance
- −$470
- − Repairs & maintenance
- −$979
- − Management
- −$979
- − Depreciation
- −$2,735
- Taxable income
- $577
- Est. tax owed @ 24.0%
- −$138
- After-tax cash flow
- $1,911/yr
For passive investors: Depreciation is non-cash, so a rental often shows a tax loss while cash-flowing — sheltering income. Rental losses are passive: they offset passive income freely, and up to $25,000/yr can offset ordinary (W-2) income if you actively participate and your MAGI is under $100k (phasing out to $0 by $150k); unused losses carry forward. On sale, claimed depreciation is recaptured at up to 25%, and gains may owe capital-gains tax (a 1031 exchange can defer both). Figures are a year-1 estimate at your 24.0% rate — not tax advice; consult a CPA.
Schools (NCES district)
- District
- Rutherford County Schools
- NCES district ID
- 3704080
- Math proficiency
- 43% ▼ -1.00%
- Reading proficiency
- 44% ▼ -2.00%
- Median HH income
- $36,490
- Composite
- 36.11/100
- National rank
- #4753
- State rank
- #98 of 178 in NC
Livability — Spindale
- Score
- 67/100
- State rank
- #211
- US rank
- #10189
Category grades
Schools grade is shown separately in the Schools card above.
Census & demographics
- Census place
- Spindale, NC
- City population
- 3,825
- Population (ZIP)
- 3,825
Population outlook (Rutherford County) Hauer SSP2
- Today (2025)
- 63,695 people
- By 2030
- 61,670 · -3.2%
- By 2040
- 57,212 · -10.2%
- By 2050
- 52,763 · -17.2%
- By 2075
- 44,493 · -30.1%
- By 2100
- 38,127 · -40.1%
Race, ethnicity, and origin ACS 2023
- Neighborhood character
- Predominantly White (77%)
- Race & ethnicity
- White 77% Black 16% Two or more races 4% Hispanic / Latino 2%
- Common ancestry
- Serbian 5% Slovak 3% Subsaharan African 2%
- Foreign-born
- 2% · Canada
- Languages at home
- 95% English-only · Spanish 2% Russian/Polish/Slavic 2% Other Asian/Pacific 1%
Political lean MEDSL · Rutherford
- 2024 margin
- Solid R (+47.8) · D 25.8% · R 73.6%
- 2008→2024 swing
- -16.0pp toward R · 2008: -31.8pp · 2024: -47.8pp
- All cycles
- 2024: R+47.8 2020: R+45.8 2016: R+47.9 2012: R+33.5 2008: R+31.8
Not yet ingested
- Civics
- —
Market trends
- HPI YoY
- ▲ 10.11%
- Current HPI
- 328.8325
- Rent YoY
- —
- Metro
- —
- State GDP YoY
- ▲ 3.28%
- F500 in state
- 26
Industry mix (Fortune 500 HQ in NC)
| Industry | F500 HQs | Revenue |
|---|---|---|
| Financial Services | 2 | $213B |
|
||
| Retail | 2 | $95B |
|
||
| Industrial Conglomerate | 1 | $38B |
|
||
| Metals / Steel | 1 | $35B |
|
||
| Utilities | 1 | $30B |
|
||
| Industrial Machinery | 1 | $19B |
|
||
Price history
-27.7% since first listed7 events — show timeline
- 2026-03-30 Price Changed $94,000 CANOPYMLS as Distributed by MLS Grid
- 2026-02-25 Relisted — CANOPYMLS as Distributed by MLS Grid
- 2025-12-12 Contingent — CANOPYMLS as Distributed by MLS Grid
- 2025-12-03 Price Changed $99,000 CANOPYMLS as Distributed by MLS Grid
- 2025-11-23 Price Changed $109,000 CANOPYMLS as Distributed by MLS Grid
- 2025-10-22 Price Changed $119,000 CANOPYMLS as Distributed by MLS Grid
- 2025-09-12 Listed $130,000 CANOPYMLS as Distributed by MLS Grid
Property tax history
+11.4%/yrLatest (2025): $1,231 · +3.8% YoY. Source: county tax records.
Cash-flow waterfall
monthlySold comps — $/sqft
last 12 mo · ≤1 miLoading sold comps…