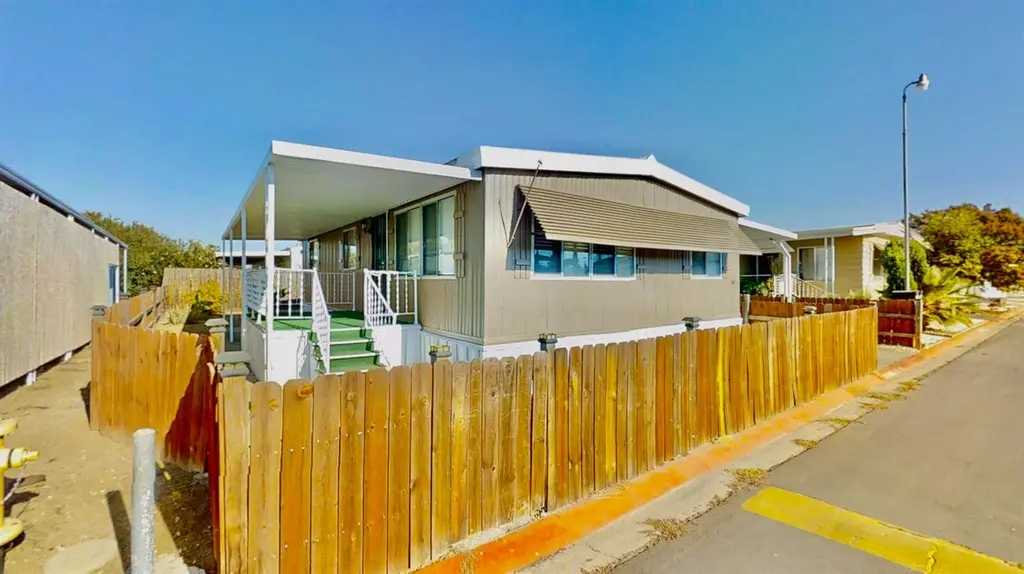
6915 Sundown Dr · Sacramento, CA
Flood risk 1/10 · Minimal
- FEMA flood zone
- X
- Chance of flooding over 30 yrs
- 0.0%
- Est. flood insurance / yr
- $507 – $1,088
Fire risk 1/10 · Minimal
- Est. fire insurance / yr
- $659 – $1,223
Heat risk 7/10 · Major
- Hot days now (above 102°F)
- 6 days/yr
- Hot days in 30 yrs
- 13 days/yr
Wind risk 1/10 · Minimal
- Chance of severe wind over 30 yrs
- —
Air-quality risk 10/10 · Severe
- Unhealthy air days now
- 25 days/yr
- Unhealthy air days in 30 yrs
- 26 days/yr
Risk factors via First Street. Map © Google.
Why this score? — see what drove the B- grade
The composite is a weighted blend of 9 inputs, each scored 0–100. Each bar is that input's sub-score; the figure is the points it added to the 100-point composite (weight × sub-score).
- Cash flow +30.0/30.0
- 1% rule +10.0/10.0
- DSCR +10.0/10.0
- ARV discount +6.6/15.0
- Livability +3.6/5.0
- Schools +3.5/10.0
- Rent growth +2.5/5.0
- Condition / age +2.5/5.0
- Appreciation +0.0/10.0
$113,999
🖨 Deal sheet 📄 Offer letter ✓ Due diligence
Listing remarks
Located in an All-Age Community, it's conveniently close to shopping and HWY 99. Check out this beautifully updated 2 bed / 2 bath 1973 Champion home offering approx. 920 sq. ft. of living space! If you love spending time outdoors and barbecuing, you'll enjoy the large, fully fenced backyardperfect for gatherings with family and friends. 🛠 Recent upgrades include: Fresh paint & flooring New appliances Granite countertops Updated bathrooms New HVAC system New awning & deck This home has it allmove-in ready and waiting for you. Don't miss out. .. schedule a showing today before it's gone!
Key facts
- 2 parking spots
- Built 1973
- Listed 246 days
Neighborhood map
What this means for you Summary
Snapshot
- This is a 2-bed/2.0-bath manufactured listed at $114k.
Deal economics
- At list price, monthly cash flow is $685 ($8k/yr) — positive.
- The deal already cash-flows at list — no discount required.
- Meets the 1% rule at list price ($2k rent vs $114k).
- Recommended offer: $100k (12.0% below list) — sets the bar for market timing.
- Cap rate 13.5% vs local median 3.0% in Sacramento — top-decile yield for the area; either an underpriced asset or a hidden risk that comps aren't pricing in. Stress-test before assuming the spread holds.
Location & tenants
- Location reads 71/100 on livability (#218 in CA) — a middle-class / working-renter tenant base. Strengths: amenities A+, commute A+, housing A; Watch: schools D+, crime F, cost of living F.
- Sacramento City Unified (urban): math 32% / reading 43% proficiency, ranked #804 of 1,400 in CA (top 57%) — families likely to look elsewhere, expect single-tenant / working-renter base with shorter leases; 63% free/reduced lunch — lower-income household profile, screen leases tightly.
- Market conditions: Rents flat; 181 active listings in the ZIP; 31 comparable units currently listed for rent nearby; rentals at typical pace (median 24d on market — plan ~3-4 weeks tenant-placement turnaround); 45% of comp listings sitting > 30 days — soft ceiling on asking rent; 6,825 units permitted in Sacramento County in 2024 (1,752 in 5+ unit buildings).
- This rent runs 33% of the median local income ($67k/yr) — at the standard rent-burdened threshold; future hikes will face affordability resistance.
Forward outlook
- Local home prices are declining (-3.0%/yr); year-one equity from $788 of loan paydown is wiped out by about $3k of value loss. Plan a longer hold.
- Sacramento County population projected at +17% by 2050 — long-run rental-demand tailwind backs the buy-and-hold thesis.
- At projected returns (-3.0% appreciation + 0.0% rent growth), your $32k cash investment doubles in ~6 years — after that, you're playing with house money.
Negotiation context
- It's been on market 247 days — a 12% lower offer ($100k) is reasonable based on typical stale-listing flexibility.
Risks & watch-outs
- Climate carrying-cost: extreme-heat days projected 6→13/yr by 2055 (HVAC capex compounding) — expect insurance premiums to compound above CPI over the hold.
Questions for the listing agent
- It's been on market 247 days. Have you received any prior offers? Is the seller open to a 12% concession, seller financing, or rate buy-down credit?
- Built in 1973 — when were the roof, HVAC, electrical panel, plumbing, and water heater last replaced?
- Why hasn't it sold? Are there any deal-killer items the seller is aware of (foundation, flood, title, zoning, code violations)?
- Is there a deadline driving the sale (1031 exchange, divorce, estate, relocation)? That informs how much negotiation room exists.
- Schools are D-rated, which usually means shorter tenancies and higher turnover. Who's the typical renter profile here, and what's been the actual vacancy rate?
- Crime grade is F in this area — have there been break-ins, vandalism, or insurance claims at this property in the last 3 years? What carrier currently insures it and at what premium?
- What's the average days-on-market for RENTAL listings here right now (not sales)? A rising rental-DOM trend means longer vacancies and softer asking-rent achievability than the comps imply.
- What's the recent tenant-quality profile in this submarket — average credit score on applications, eviction rate, late-payment / NSF rate, and stable-employment percentage? A property-management company in the area should have these aggregated.
- How much new for-sale + rental construction is in the pipeline within 1–3 miles? Heavy new supply typically softens prices + rents 12–24 months out; constrained supply supports both.
Investment metrics
- 1% rule
- 1.63% ✓
- Cap rate
- 13.50%
- Cash-on-cash
- 25.74%
- DSCR
- 2.15
- GRM
- 5.1
CMA / ARV
- ARV (median comp)
- $111,671
- List price
- $113,999
- Delta
- 2.08%
- Verdict
- FAIR
- Comps
- 8 within 1.0 mi
Show comp detail 1 sale within ~0.75 mi
| Address | Dist | Beds/Ba | Sqft | Sold | Price | $/sf | Match |
|---|---|---|---|---|---|---|---|
| 95 Bentley Ave | 0.54mi | 3/2.0 (+1) | 960 (+4%) | 3mo | $85,000 | $89 | 60 |
Match score weights: distance 35% · size 25% · config 20% · recency 20%. Top-matched comps best support the ARV.
Projected returns pro-forma
-3.0% appreciation · 0.02% rent growth · sell at horizon
- IRR
- 16.0%
- Equity multiple
- 1.62×
- Total profit
- $19,733
- Equity at exit
- $16,998
- IRR
- 22.3%
- Equity multiple
- 2.64×
- Total profit
- $52,465
- Equity at exit
- $9,857
Cash invested: $31,920 (down + closing). Projections, not guarantees.
Landlord ↔ Tenant lean methodology
- Overall (STATE)
- 18 Strongly Tenant-Friendly
- State California
- 18 Strongly Tenant-Friendly · D+13
- County
- — inherits STATE
- City
- — inherits STATE
ZIP-level market 95823
- Rents YoY
- 0.0%
- Active inventory
- 181
- Price-to-rent
- 5.1×
Monthly cashflow live
- Estimated rent
- $1,864 high interval (Pro) →
- Mortgage (P&I)
- −$598
- Tax est. 1.5%
- −$142 /mo · $1,710/yr
- Insurance
- −$47
- HOA
- −$0
- Vacancy / Maint / Mgmt
- −$391
- Net cashflow
- $685
Break-even live
UW: 25.0% down · 7.5% · 30yr · 1.5% tax · 5.0% vac · 8.0% maint · 8.0% mgmt
Financing live
Cash to close
- Down payment
- $28,500
- Closing costs
- $3,420
- Reserves months
- —
- Total cash needed
- —
Loan-product check · same deal, 3 products live
Conventional
25% down · 7.5% · 30yr
- Down + closing
- —
- Monthly P&I
- —
- Monthly cashflow
- —
- DSCR
- —
- Eligible?
- —
Personal DTI + credit; lowest rate.
DSCR
20% down · 8.5% · 30yr
- Down + closing
- —
- Monthly P&I
- —
- Monthly cashflow
- —
- DSCR
- —
- Eligible?
- —
No personal income docs; deal must DSCR.
Hard money
10% down · 12.0% · 12mo
- Down + closing
- —
- Monthly P&I
- —
- Monthly cashflow
- —
- DSCR
- —
- Eligible?
- —
Short-term bridge; refi at stabilization.
Rent comps 31 comps
| Address | Beds | Baths | Sqft | Rent | $/sqft | DOM | Units | Dist |
|---|---|---|---|---|---|---|---|---|
| 6855 Carnation Ave Unit 6855 Sacramento, CA | 2.0 | 2.0 | 1100 | $2,025 | $1.84 | 3d | 1 | 0.35mi |
| 7400 Loma Verde Way Unit 1 Sacramento, CA | 2.0 | 1.0 | 860 | $2,100 | $2.44 | 3d | 1 | 0.63mi |
| 6815 24th St Sacramento, CA | 1.0 | 1.0 | 650 | $1,350 | $2.08 | 4d | 1 | 0.66mi |
| 3912 49th Ave Unit 16 Sacramento, CA | 1.0 | 1.0 | 700 | $1,700 | $2.43 | 44d | 1 | 0.70mi |
| 3912 49th Ave Unit 15 Sacramento, CA | 1.0 | 1.0 | 700 | $1,495 | $2.14 | 24d | 1 | 0.70mi |
| 3912 49th Ave Unit 17 Sacramento, CA | 1.0 | 1.0 | 700 | $1,600 | $2.29 | 44d | 1 | 0.71mi |
| 3912 49th Ave Apt 10 Sacramento, CA | 2.0 | 1.0 | 811 | $1,895 | $2.34 | 44d | 1 | 0.72mi |
| 3912 49th Ave Unit 9 Sacramento, CA | 2.0 | 1.0 | 811 | $1,795 | $2.21 | 44d | 1 | 0.72mi |
| 6808 24th St Unit 1 Sacramento, CA | 1.0 | 1.0 | 650 | $1,600 | $2.46 | 44d | 1 | 0.73mi |
| 3903 49th Ave Sacramento, CA | 1.0 | 1.0 | 585 | $1,445 | $2.47 | 7d | 1 | 0.75mi |
| 4197 Cuny Ave Unit 3 Sacramento, CA | 2.0 | 1.0 | 1051 | $2,000 | $1.90 | 18d | 1 | 0.84mi |
| 7051 Bowling Dr Sacramento, CA | 1.0–2.0 | 1.0–1.5 | 716 | $1,445 | $2.02 | 3d | 5 | 0.94mi |
| 74 La Fresa Ct #3 Sacramento, CA | 2.0 | 1.0 | 840 | $1,950 | $2.32 | 44d | 1 | 0.98mi |
| 6739 Ferrier Ct Sacramento, CA | 3.0 | 2.0 | 1106 | $2,325 | $2.10 | 24d | 1 | 1.00mi |
| 4407 Bouts Pkwy Sacramento, CA | 3.0 | 1.0 | 1024 | $1,950 | $1.90 | 44d | 1 | 1.01mi |
| 6315 Ventura St Sacramento, CA | 2.0 | 1.0 | 1000 | $2,000 | $2.00 | 44d | 1 | 1.01mi |
| 7408 Franklin Blvd #2 Sacramento, CA | 2.0 | 1.0 | 840 | $1,300 | $1.55 | 22d | 1 | 1.03mi |
| 6310 Ventura St Sacramento, CA | 2.0 | 1.0 | 1000 | $2,000 | $2.00 | 44d | 1 | 1.04mi |
| 4400 Shining Star Dr Sacramento, CA | 1.0–4.0 | 1.0–2.0 | 1225 | $2,254 | $1.84 | 44d | 1 | 1.13mi |
| 7238 East Pkwy Apt B5 Sacramento, CA | 2.0 | 1.5 | 1020 | $1,645 | $1.61 | 7d | 1 | 1.14mi |
| 6201 Martin Luther King Junior Blvd Apt 12 Sacramento, CA | 2.0 | 1.0 | 673 | $1,400 | $2.08 | 44d | 1 | 1.15mi |
| 7236 East Pkwy Sacramento, CA | 2.0 | 1.0–1.5 | 776 | $1,645 | $2.12 | 3d | 1 | 1.15mi |
| 2777 Meadowview Rd Unit 2781 Sacramento, CA | 2.0 | 2.0 | 800 | $1,295 | $1.62 | 22d | 1 | 1.15mi |
| 26 Nedra Ct Unit A1 Sacramento, CA | 2.0 | 1.0 | 980 | $1,650 | $1.68 | 20d | 1 | 1.22mi |
| 26 Nedra Ct Sacramento, CA | 2.0 | 1.0 | 980 | $1,650 | $1.68 | 44d | 1 | 1.22mi |
| 6500 47th St Sacramento, CA | 1.0–2.0 | 1.0–2.0 | 715 | $1,650 | $2.31 | 44d | 7 | 1.29mi |
| 7638 24th St Sacramento, CA | 2.0 | 1.0 | 976 | $1,900 | $1.95 | 44d | 1 | 1.36mi |
| 7462 21st St Sacramento, CA | 2.0 | 1.0 | 900 | $1,775 | $1.97 | 2d | 1 | 1.43mi |
| 7726 Laurie Way Sacramento, CA | 3.0 | 1.0 | 1069 | $2,075 | $1.94 | 7d | 1 | 1.48mi |
| 4911 50th Ave Unit 11 Sacramento, CA | 2.0 | 2.0 | 875 | $1,660 | $1.90 | 24d | 1 | 1.48mi |
| 6611 50th St Sacramento, CA | 2.0 | 1.0 | 873 | $1,950 | $2.23 | 7d | 1 | 1.49mi |
Listing history 15 events
-
2026-06-18days on market $113,999 Active 247 DOM
-
2026-06-17days on market $113,999 Active 246 DOM
-
2026-06-16days on market $113,999 Active 245 DOM
-
2026-06-16price $113,999 Active 244 DOM
-
2026-06-15days on market $114,999 Active 244 DOM
-
2026-06-13days on market $114,999 Active 242 DOM
-
2026-06-13days on market $114,999 Active 241 DOM
-
2026-06-09days on market $114,999 Active 238 DOM
-
2026-06-08days on market $114,999 Active 237 DOM
-
2026-06-07days on market $114,999 Active 236 DOM
-
2026-06-05days on market $114,999 Active 233 DOM
-
2026-06-03days on market $114,999 Active 232 DOM
-
2026-06-02days on market $114,999 Active 231 DOM
-
2026-06-01days on market $114,999 Active 230 DOM
-
2026-05-31days on market $114,999 Active 229 DOM
ⓘ Source: listings_history table (triggers on properties + properties_extension) + one-shot
backfill from property_details.listing_events for pre-trigger history.
Climate risk First Street
- Flood 1/10 Low FEMA zone X · 0% chance over 30 yrs
- Wildfire 1/10 Low
- Heat 7/10 Severe 6 d/yr ≥102°F today · 13 d/yr by 30 yrs out
- Wind 1/10 Low
- Air quality 10/10 Extreme 25 unhealthy d/yr today · 26 by 30 yrs out
Nearby sold comps map
Loading sold comps map…
Walkable amenities ~0.75 mi
Loading nearby amenities…
Taxation est. · year 1
- Rental income
- $22,366
- − Mortgage interest
- −$6,386
- − Property taxes
- −$1,710
- − Insurance
- −$570
- − Repairs & maintenance
- −$1,789
- − Management
- −$1,789
- − Depreciation
- −$3,316
- Taxable income
- $6,806
- Est. tax owed @ 24.0%
- −$1,633
- After-tax cash flow
- $6,582/yr
For passive investors: Depreciation is non-cash, so a rental often shows a tax loss while cash-flowing — sheltering income. Rental losses are passive: they offset passive income freely, and up to $25,000/yr can offset ordinary (W-2) income if you actively participate and your MAGI is under $100k (phasing out to $0 by $150k); unused losses carry forward. On sale, claimed depreciation is recaptured at up to 25%, and gains may owe capital-gains tax (a 1031 exchange can defer both). Figures are a year-1 estimate at your 24.0% rate — not tax advice; consult a CPA.
Schools (NCES district)
- District
- Sacramento City Unified
- NCES district ID
- 0633840
- Math proficiency
- 32% ▬ 0.00%
- Reading proficiency
- 43% ▲ 3.00%
- Median HH income
- $49,280
- Composite
- 34.86/100
- National rank
- #10000
- State rank
- #804 of 1400 in CA
Livability — Sacramento
- Score
- 71/100
- State rank
- #218
- US rank
- #6957
Category grades
Schools grade is shown separately in the Schools card above.
Census & demographics
- Census place
- Sacramento, CA
- County
- Sacramento County · 1,539,646 people
- City population
- 761,410
- Metro
- Sacramento-Roseville-Folsom, CA
- Population (ZIP)
- 83,607
- Household income
- $66,895
- Rent vs Own
- Severe rent burden
- 4034.0
Population outlook (Sacramento County) Hauer SSP2
- Today (2025)
- 1,660,763 people
- By 2030
- 1,732,990 · +4.3%
- By 2040
- 1,855,755 · +11.7%
- By 2050
- 1,941,335 · +16.9%
- By 2075
- 2,046,162 · +23.2%
- By 2100
- 1,961,444 · +18.1%
Race, ethnicity, and origin ACS 2023
- Neighborhood character
- Highly diverse neighborhood (Simpson 0.77)
- Race & ethnicity
- Hispanic / Latino 35% Asian 25% Black 17% Two or more races 16% White 11% Pacific Islander 4% Native American 1%
- Hispanic origin (detail)
- Mexican 29% Puerto Rican 1%
- Common ancestry
- Lithuanian 1% Italian 1% Scotch-Irish 1%
- Foreign-born
- 30% · Canada, Vietnam, China
- Languages at home
- 47% English-only · Spanish 25% Other Asian/Pacific 9% Other Indo-European 8%
Political lean MEDSL · Sacramento
- 2024 margin
- D (+19.7) · D 58.1% · R 38.4% · Other 3.5%
- 2008→2024 swing
- +0.7pp no change · 2008: 19.0pp · 2024: 19.7pp
- All cycles
- 2024: D+19.7 2020: D+25.3 2016: D+23.7 2012: D+16.3 2008: D+19.0
Not yet ingested
- Civics
- —
Market trends
- HPI YoY
- ▼ -331.02%
- Current HPI
- 377.4278
- Rent YoY
- ▬ 0.02%
- Metro
- Sacramento-Roseville-Folsom, CA
- State GDP YoY
- ▲ 3.21%
- F500 in state
- 116
Industry mix (Fortune 500 HQ in CA)
| Industry | F500 HQs | Revenue |
|---|---|---|
| Technology | 27 | $1,492B |
|
||
| Financial Services | 3 | $174B |
|
||
| Retail | 3 | $44B |
|
||
| Insurance | 3 | $26B |
|
||
| Media / Entertainment | 2 | $115B |
|
||
| Pharmaceuticals / Biotech | 2 | $62B |
|
||
Cash-flow waterfall
monthlySold comps — $/sqft
last 12 mo · ≤1 miLoading sold comps…