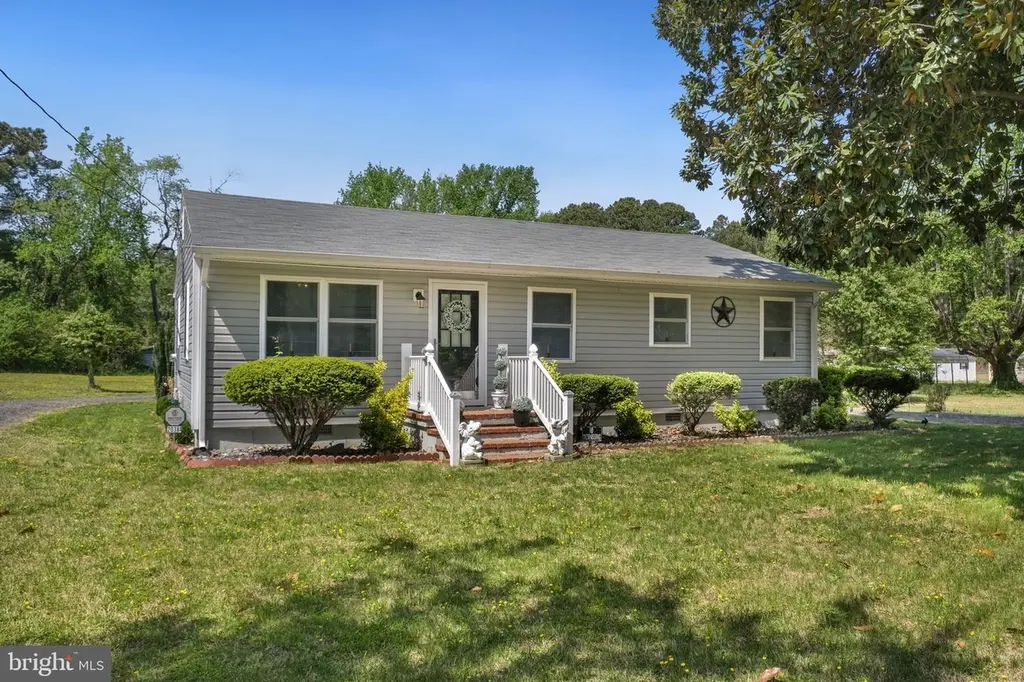
20384 Mary Ball Rd · White Stone, VA
Flood risk 1/10 · Minimal
- FEMA flood zone
- X (unshaded)
- Chance of flooding over 30 yrs
- 0.0%
- Est. flood insurance / yr
- $507 – $1,088
Fire risk 3/10 · Minor
- Est. fire insurance / yr
- $666 – $1,236
Heat risk 9/10 · Severe
- Hot days now (above 105°F)
- 7 days/yr
- Hot days in 30 yrs
- 17 days/yr
Wind risk 8/10 · Major
- Chance of severe wind over 30 yrs
- 80.0%
Air-quality risk 1/10 · Minimal
- Unhealthy air days now
- 0 days/yr
- Unhealthy air days in 30 yrs
- 0 days/yr
Risk factors via First Street. Map © Google.
Why this score? — see what drove the C grade
The composite is a weighted blend of 9 inputs, each scored 0–100. Each bar is that input's sub-score; the figure is the points it added to the 100-point composite (weight × sub-score).
- Cash flow +25.9/30.0
- DSCR +8.7/10.0
- ARV discount +7.5/15.0
- 1% rule +5.6/10.0
- Schools +3.3/10.0
- Livability +3.2/5.0
- Rent growth +2.5/5.0
- Condition / age +2.5/5.0
- Appreciation +0.5/10.0
$235,000
🖨 Deal sheet (PDF) 📄 Offer letter ✓ Due diligence
Listing remarks
Charming and well-maintained 3-bedroom home featuring 1 full bath and 1 half bath, situated on a little over . 50 acres in White Stone. With 1,008 square feet of comfortable living space, this home offers a functional layout and a cozy, inviting feel throughout. Renovations were completed approximately 8 years ago, including the HVAC system, roof, hot water heater, and new flooring. The property is serviced by town water and private septic, and the driveway was redone just 2 years ago. High-speed internet access is available, making it ideal for both everyday living and remote work. Enjoy the outdoor setting with a gazebo, carport, and attached storage shed, along with plenty of space to re
Key facts
- 0.6 acre lot
- 2 parking spots
- Built 1958
Neighborhood map
What this means for you Summary
Snapshot
- This is a 2-bed/1.0-bath single-family listed at $235k.
Deal economics
- At list price, monthly cash flow is $576 ($7k/yr) — positive.
- The deal already cash-flows at list — no discount required.
- Meets the 1% rule at list price ($2k rent vs $235k).
- Cap rate 9.2% vs local median 0.9% in White Stone — top-decile yield for the area; either an underpriced asset or a hidden risk that comps aren't pricing in. Stress-test before assuming the spread holds.
Location & tenants
- Location reads 64/100 on livability (#358 in VA) — a middle-class / working-renter tenant base. Strengths: cost of living A+, health & safety A+; Watch: housing C-, amenities F, commute F.
- Lancaster County Public School District (rural): math 27% / reading 49% proficiency, ranked #125 of 131 in VA (top 95%) — families likely to look elsewhere, expect single-tenant / working-renter base with shorter leases; 64% free/reduced lunch — lower-income household profile, screen leases tightly.
- Zoned schools: Lancaster Primary (math 27% / reading 37%, grade F, #992 of 1,108 statewide, top 90%, 316 students, 127% FRL); Lancaster Middle (math 22% / reading 47%, grade F, #328 of 342 statewide, top 96%, 237 students, 99% FRL); Lancaster High (math 37% / reading 57%, grade D-, #305 of 319 statewide, top 97%, 403 students, 100% FRL) — zoned schools average 109% FRL vs 64% district-wide (45 pts higher); higher-poverty schools than district average — tighter screening recommended.
- Market conditions: 48 active listings in the ZIP; 1 comparable units currently listed for rent nearby; 127 units permitted in Lancaster County in 2024 (0 in 5+ unit buildings).
Forward outlook
- Local home prices are declining (-3.0%/yr); year-one equity from $2k of loan paydown is wiped out by about $7k of value loss. Plan a longer hold.
- Lancaster County population projected at -34% by 2050 — secular population decline; favor cash flow + early exit over multi-decade hold.
Negotiation context
- Only 3 days on market — expect competitive offers; lowballing is unlikely to land.
- Current owner paid $20k; list at $235k implies a 1075% gain — meaningful room to come down on a strong offer.
Risks & watch-outs
- Watch-outs: built in 1958 — expect roof / HVAC / electrical / plumbing capex.
- Climate carrying-cost: severe wind risk, 80% chance of damaging wind over 30y; extreme-heat days projected 7→17/yr by 2055 (HVAC capex compounding) — expect insurance premiums to compound above CPI over the hold.
Questions for the listing agent
- Built in 1958 — when were the roof, HVAC, electrical panel, plumbing, and water heater last replaced?
- Is there a deadline driving the sale (1031 exchange, divorce, estate, relocation)? That informs how much negotiation room exists.
- Schools are F-rated, which usually means shorter tenancies and higher turnover. Who's the typical renter profile here, and what's been the actual vacancy rate?
- What's the average days-on-market for RENTAL listings here right now (not sales)? A rising rental-DOM trend means longer vacancies and softer asking-rent achievability than the comps imply.
- What's the recent tenant-quality profile in this submarket — average credit score on applications, eviction rate, late-payment / NSF rate, and stable-employment percentage? A property-management company in the area should have these aggregated.
- How much new for-sale + rental construction is in the pipeline within 1–3 miles? Heavy new supply typically softens prices + rents 12–24 months out; constrained supply supports both.
Investment metrics
- 1% rule
- 1.06% ✓
- Cap rate
- 9.24%
- Cash-on-cash
- 10.51%
- DSCR
- 1.47
- GRM
- 7.8
CMA / ARV
- ARV (on-the-fly)
- $234,864
- Comps found
- 1
Show comp detail 1 sale within ~0.75 mi
| Address | Dist | Beds/Ba | Sqft | Sold | Price | $/sf | Match |
|---|---|---|---|---|---|---|---|
| 20384 Mary Ball Rd | 0.00mi | 3/1.5 (+1) | 1,008 (0%) | 1mo | $235,000 | $233 | 92 |
Match score weights: distance 35% · size 25% · config 20% · recency 20%. Top-matched comps best support the ARV.
Projected returns pro-forma
-3.0% appreciation · 3.0% rent growth · sell at horizon
- IRR
- -0.6%
- Equity multiple
- 0.98×
- Total profit
- $-1,468
- Equity at exit
- $35,039
- IRR
- 9.0%
- Equity multiple
- 1.69×
- Total profit
- $45,586
- Equity at exit
- $20,319
Cash invested: $65,800 (down + closing). Projections, not guarantees.
Landlord ↔ Tenant lean methodology
- Overall (STATE)
- 55 Moderately Landlord-Leaning
- State Virginia
- 55 Moderately Landlord-Leaning · D+2
- County
- — inherits STATE
- City
- — inherits STATE
ZIP-level market 22578
- Home prices YoY
- -3.3%
- Active inventory
- 48
- Price-to-rent
- 7.8×
Monthly cashflow live
- Estimated rent
- $2,500 medium interval (Pro) →
- Mortgage (P&I)
- −$1,232
- Tax from tax record
- −$68 /mo · $820/yr
- Insurance
- −$98
- HOA
- −$0
- Vacancy / Maint / Mgmt
- −$525
- Net cashflow
- $576
Break-even live
Sensitivity live
| Price | -10% $709 | -5% $643 | +0% $576 | +5% $510 | +10% $443 |
|---|---|---|---|---|---|
| Rent | -10% $379 | -5% $478 | +0% $576 | +5% $675 | +10% $774 |
| Rate | -1.0pp $695 | -0.5pp $636 | base $576 | +0.5pp $516 | +1.0pp $454 |
UW: 25.0% down · 7.5% · 30yr · 1.5% tax · 5.0% vac · 8.0% maint · 8.0% mgmt
Financing live
Cash to close
- Down payment
- $58,750
- Closing costs
- $7,050
- Reserves months
- —
- Total cash needed
- —
Loan-product check · same deal, 3 products live
Conventional
25% down · 7.5% · 30yr
- Down + closing
- —
- Monthly P&I
- —
- Monthly cashflow
- —
- DSCR
- —
- Eligible?
- —
Personal DTI + credit; lowest rate.
DSCR
20% down · 8.5% · 30yr
- Down + closing
- —
- Monthly P&I
- —
- Monthly cashflow
- —
- DSCR
- —
- Eligible?
- —
No personal income docs; deal must DSCR.
Hard money
10% down · 12.0% · 12mo
- Down + closing
- —
- Monthly P&I
- —
- Monthly cashflow
- —
- DSCR
- —
- Eligible?
- —
Short-term bridge; refi at stabilization.
Rent comps 1 comps
| Address | Beds | Baths | Sqft | Rent | $/sqft | DOM | Units | Dist |
|---|---|---|---|---|---|---|---|---|
| 645 Rappahannock Dr White Stone, VA | 3.0 | 1.0 | 1104 | $2,500 | $2.26 | 45d | 1 | 0.49mi |
Listing history 3 events
-
2026-04-22status Pending
-
2026-04-18$235,000 Active
-
2012-12-17soldstatus $20,000
ⓘ Source: listings_history table (triggers on properties + properties_extension) + one-shot
backfill from property_details.listing_events for pre-trigger history.
Tax reassessment forecast VA · Resets to sale price
- Current annual tax
- $820 · $68/mo
- Projected year-2 tax
- $1,927 · $161/mo
- Expected delta
- +$1,108/yr (+$92/mo · 135.1%)
ⓘ Screening estimate from a state-policy table — verify with the county assessor before closing.
Climate risk First Street
- Flood 1/10 Low FEMA zone X (unshaded) · 0% chance over 30 yrs
- Wildfire 3/10 Moderate
- Heat 9/10 Extreme 7 d/yr ≥105°F today · 17 d/yr by 30 yrs out
- Wind 8/10 Severe 80% chance of damaging wind over 30 yrs
- Air quality 1/10 Low 0 unhealthy d/yr today · 0 by 30 yrs out
Nearby sold comps map
Loading sold comps map…
Walkable amenities ~0.75 mi
Loading nearby amenities…
Taxation est. · year 1
- Rental income
- $30,000
- − Mortgage interest
- −$13,164
- − Property taxes
- −$820
- − Insurance
- −$1,175
- − Repairs & maintenance
- −$2,400
- − Management
- −$2,400
- − Depreciation
- −$6,836
- Taxable income
- $3,205
- Est. tax owed @ 24.0%
- −$769
- After-tax cash flow
- $6,148/yr
For passive investors: Depreciation is non-cash, so a rental often shows a tax loss while cash-flowing — sheltering income. Rental losses are passive: they offset passive income freely, and up to $25,000/yr can offset ordinary (W-2) income if you actively participate and your MAGI is under $100k (phasing out to $0 by $150k); unused losses carry forward. On sale, claimed depreciation is recaptured at up to 25%, and gains may owe capital-gains tax (a 1031 exchange can defer both). Figures are a year-1 estimate at your 24.0% rate — not tax advice; consult a CPA.
Schools (NCES district)
- District
- Lancaster County Public School District
- NCES district ID
- 5102160
- Math proficiency
- 27% ▼ -44.00%
- Reading proficiency
- 49% ▼ -20.00%
- Median HH income
- $48,210
- Composite
- 32.58/100
- National rank
- #5680
- State rank
- #125 of 131 in VA
Livability — White Stone
- Score
- 64/100
- State rank
- #358
- US rank
- #14401
Category grades
Schools grade is shown separately in the Schools card above.
Census & demographics
- Population (ZIP)
- 2,346
Population outlook (Lancaster County) Hauer SSP2
- Today (2025)
- 9,870 people
- By 2030
- 9,172 · -7.1%
- By 2040
- 7,719 · -21.8%
- By 2050
- 6,551 · -33.6%
- By 2075
- 5,110 · -48.2%
- By 2100
- 3,884 · -60.6%
Race, ethnicity, and origin ACS 2023
- Neighborhood character
- Predominantly White (74%)
- Race & ethnicity
- White 74% Black 18% Two or more races 4% Hispanic / Latino 3%
- Common ancestry
- Serbian 3% Slovak 2% Lithuanian 2%
- Foreign-born
- 5% · Canada
- Languages at home
- 96% English-only · Spanish 4%
Political lean MEDSL · Lancaster
- 2024 margin
- Lean R (+7.0) · D 46.1% · R 53.1%
- 2008→2024 swing
- -1.1pp toward R · 2008: -5.9pp · 2024: -7.0pp
- All cycles
- 2024: R+7.0 2020: R+4.6 2016: R+10.0 2012: R+8.6 2008: R+5.9
Not yet ingested
- Civics
- —
Market trends
- HPI YoY
- ▼ -9.07%
- Current HPI
- 266.525
- Rent YoY
- —
- Metro
- —
- State GDP YoY
- ▲ 2.40%
- F500 in state
- 50
Industry mix (Fortune 500 HQ in VA)
| Industry | F500 HQs | Revenue |
|---|---|---|
| Aerospace / Defense | 4 | $236B |
|
||
| Technology / Defense | 3 | $32B |
|
||
| Financial Services | 2 | $176B |
|
||
| Utilities | 2 | $27B |
|
||
| Insurance | 2 | $25B |
|
||
| Technology | 2 | $15B |
|
||
Price history
+1075.0% since first listed3 events — show timeline
- 2026-04-22 Pending — BRIGHT MLS
- 2026-04-18 Listed $235,000 BRIGHT MLS
- 2012-12-17 Sold (Public Records) $20,000 Public Records
Property tax history
+7.0%/yrLatest (2025): $820 · +0.0% YoY. Source: county tax records.
Cash-flow waterfall
monthlySold comps — $/sqft
last 12 mo · ≤1 miLoading sold comps…