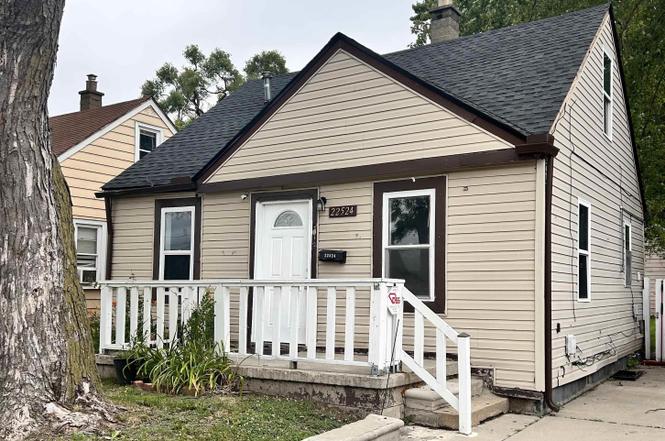
22524 Mac Arthur Blvd · Warren, MI
Flood risk 3/10 · Minor
- FEMA flood zone
- X (unshaded)
- Chance of flooding over 30 yrs
- 0.2%
- Est. flood insurance / yr
- $507 – $1,088
Fire risk 1/10 · Minimal
- Est. fire insurance / yr
- $784 – $1,456
Heat risk 3/10 · Minor
- Hot days now (above 97°F)
- 7 days/yr
- Hot days in 30 yrs
- 14 days/yr
Wind risk 1/10 · Minimal
- Chance of severe wind over 30 yrs
- —
Air-quality risk 3/10 · Minor
- Unhealthy air days now
- 3 days/yr
- Unhealthy air days in 30 yrs
- 4 days/yr
Risk factors via First Street. Map © Google.
Why this score? — see what drove the C- grade
The composite is a weighted blend of 9 inputs, each scored 0–100. Each bar is that input's sub-score; the figure is the points it added to the 100-point composite (weight × sub-score).
- Cash flow +22.7/30.0
- ARV discount +7.5/15.0
- DSCR +7.3/10.0
- 1% rule +6.5/10.0
- Livability +3.7/5.0
- Rent growth +3.2/5.0
- Condition / age +2.5/5.0
- Schools +1.0/10.0
- Appreciation +0.0/10.0
$115,000
🖨 Deal sheet (PDF) 📄 Offer letter ✓ Due diligence
Listing remarks MLS
Turnkey investment opportunity with tenant in place. Property is currently leased through April 2027, providing immediate rental income. Buyer to assume the existing lease. Showings are by appointment only and require advance notice. Please do not disturb the tenant. Well-maintained home in Warren. Property Highlights: 3 comfortable bedrooms. 1 updated full bathroom. Bright living room with plenty of natural light. Functional kitchen with ample cabinet space. New roof installed in 2024. New hot water tank and new A/C installed in 2024. Newly installed private fenced backyard.
Key facts
- Close to schools
- Recent upgrades
- New hot water tank
Tags
Property features AI
Finance
- Other: Lot frontage approximately 36 feet; Acreage approximately 0.09 acres
Exterior
- Utilities: Public water; Public sanitary sewer
- Home design: Residential 1 1/2-story home; Built in 1947; Crawlspace foundation; Facing direction not specified; Entry level: main/entry
- Construction: Aluminum construction; Crawl foundation; 1 1/2-story structure; Year built: 1947
- Exterior features: Aluminum exterior; Road frontage
Interior
- Bedrooms: Two bedrooms on the entry level; One bedroom on the second floor; Bedroom dimensions include a 10 x 10 room and another approximately 10-foot-wide room
- Bathrooms: One full bathroom on the main level
- Heating & cooling: Forced air heating; Natural gas fuel
- Interior features: Main-level full bathroom; Living room present
Neighborhood map
What this means for you Summary
Snapshot
- This is a 3-bed/1.0-bath single-family listed at $115k.
Deal economics
- At list price, monthly cash flow is $197 ($2k/yr) — positive.
- The deal already cash-flows at list — no discount required.
- Meets the 1% rule at list price ($1k rent vs $115k).
- Recommended offer: $101k (12.0% below list) — sets the bar for market timing.
- Cap rate 8.4% vs local median 5.2% in Warren — top-decile yield for the area; either an underpriced asset or a hidden risk that comps aren't pricing in. Stress-test before assuming the spread holds.
Location & tenants
- Location reads 74/100 on livability (#171 in MI, #4,491 nationally) — a middle-class / working-renter tenant base. Strengths: commute A+, cost of living A+, housing A+; Watch: amenities D, employment D, crime D-.
- Van Dyke Public Schools (urban): math 7% / reading 19% proficiency, ranked #512 of 540 in MI (top 95%) — low school quality limits family demand, transient renter base, plan for 1-2y turnover; 80% free/reduced lunch — lower-income household profile, screen leases tightly.
- Zoned schools: Lincoln Elementary School (math 8% / reading 12%, grade F, #1,277 of 1,397 statewide, top 93%, 355 students, 97% FRL); Lincoln Middle School (math 7% / reading 22%, grade F, #460 of 493 statewide, top 93%, 401 students, 96% FRL); Lincoln High School (math 2% / reading 17%, grade F, #692 of 713 statewide, top 98%, 440 students, 91% FRL).
- Market conditions: Rents rising (+2.9%/yr); 168 active listings in the ZIP; 8 comparable units currently listed for rent nearby; rentals lingering (median 45d on market — plan ~5-8 weeks vacancy on turnover, expect pricing pressure); 50% of comp listings sitting > 30 days — soft ceiling on asking rent; 1,321 units permitted in Macomb County in 2024 (86 in 5+ unit buildings).
- This rent runs 30% of the median local income ($52k/yr) — at the standard rent-burdened threshold; future hikes will face affordability resistance.
Forward outlook
- Local home prices are declining (-3.0%/yr); year-one equity from $795 of loan paydown is wiped out by about $3k of value loss. Plan a longer hold.
- Macomb County population projected at +9% by 2050 — modest demand growth; plan on rents tracking national, not racing it.
Negotiation context
- It's been on market 130 days — a 12% lower offer ($101k) is reasonable based on typical stale-listing flexibility.
- 11 sale attempts since 29y ago with the ask held roughly flat each time — persistent listings suggest the price (not the market) is what's stuck; bring a comps-based counter.
- Current owner paid $50k; list at $115k implies a 130% gain — meaningful room to come down on a strong offer.
Risks & watch-outs
- Watch-outs: built in 1947 — expect roof / HVAC / electrical / plumbing capex.
Questions for the listing agent
- It's been on market 130 days. Have you received any prior offers? Is the seller open to a 12% concession, seller financing, or rate buy-down credit?
- Built in 1947 — when were the roof, HVAC, electrical panel, plumbing, and water heater last replaced?
- Why hasn't it sold? Are there any deal-killer items the seller is aware of (foundation, flood, title, zoning, code violations)?
- Is there a deadline driving the sale (1031 exchange, divorce, estate, relocation)? That informs how much negotiation room exists.
- Schools are D-rated, which usually means shorter tenancies and higher turnover. Who's the typical renter profile here, and what's been the actual vacancy rate?
- Crime grade is D in this area — have there been break-ins, vandalism, or insurance claims at this property in the last 3 years? What carrier currently insures it and at what premium?
- What's the average days-on-market for RENTAL listings here right now (not sales)? A rising rental-DOM trend means longer vacancies and softer asking-rent achievability than the comps imply.
- What's the recent tenant-quality profile in this submarket — average credit score on applications, eviction rate, late-payment / NSF rate, and stable-employment percentage? A property-management company in the area should have these aggregated.
- How much new for-sale + rental construction is in the pipeline within 1–3 miles? Heavy new supply typically softens prices + rents 12–24 months out; constrained supply supports both.
Investment metrics
- 1% rule
- 1.15% ✓
- Cap rate
- 8.35%
- Cash-on-cash
- 7.35%
- DSCR
- 1.33
- GRM
- 7.2
CMA / ARV
- ARV (on-the-fly)
- $73,000
- Comps found
- 11
Show comp detail 11 sales within ~0.75 mi
| Address | Dist | Beds/Ba | Sqft | Sold | Price | $/sf | Match |
|---|---|---|---|---|---|---|---|
| 11012 Paige Ave | 0.32mi | 2/1.0 (-1) | 584 (0%) | 9mo | $52,100 | $89 | 72 |
| 8094 Chalmers Ave | 0.41mi | 2/1.0 (-1) | 630 (+8%) | 6mo | $64,000 | $102 | 58 |
| 7540 Prospect Ave | 0.71mi | 2/1.0 (-1) | 576 (-1%) | 5mo | $38,000 | $66 | 56 |
| 8635 Lozier Ave | 0.46mi | 2/1.0 (-1) | 620 (+6%) | 14mo | $84,000 | $135 | 51 |
| 8278 Jackson Ave | 0.70mi | 2/1.0 (-1) | 592 (+1%) | 12mo | $82,000 | $139 | 50 |
| 23736 Mac Arthur Blvd | 0.64mi | 2/1.0 (-1) | 624 (+7%) | 7mo | $115,000 | $184 | 48 |
| 7559 Lozier Ave | 0.68mi | 2/1.0 (-1) | 600 (+3%) | 20mo | $75,000 | $125 | 42 |
| 7259 Republic Ave | 0.71mi | 3/1.0 | 640 (+10%) | 12mo | $82,500 | $129 | 41 |
| 11035 Essex Ave | 0.59mi | 2/1.0 (-1) | 667 (+14%) | 12mo | $108,000 | $162 | 33 |
| 11561 Hupp Ave | 0.61mi | 2/1.0 (-1) | 500 (-14%) | 17mo | $60,000 | $120 | 28 |
| 7211 Continental Ave | 0.73mi | 2/1.0 (-1) | 510 (-13%) | 22mo | $50,000 | $98 | 22 |
Match score weights: distance 35% · size 25% · config 20% · recency 20%. Top-matched comps best support the ARV.
Projected returns pro-forma
-3.0% appreciation · 2.94% rent growth · sell at horizon
- IRR
- -5.1%
- Equity multiple
- 0.81×
- Total profit
- $-6,091
- Equity at exit
- $17,147
- IRR
- 4.6%
- Equity multiple
- 1.33×
- Total profit
- $10,774
- Equity at exit
- $9,943
Cash invested: $32,200 (down + closing). Projections, not guarantees.
Landlord ↔ Tenant lean methodology
- Overall (STATE)
- 62 Landlord-Friendly
- State Michigan
- 62 Landlord-Friendly · EVEN
- County
- — inherits STATE
- City
- — inherits STATE
ZIP-level market 48089
- Rents YoY
- 2.9%
- Active inventory
- 168
- Price-to-rent
- 7.2×
Monthly cashflow live
- Estimated rent
- $1,327 high interval (Pro) →
- Mortgage (P&I)
- −$603
- Tax from tax record
- −$200 /mo · $2,398/yr
- Insurance
- −$48
- HOA
- −$0
- Vacancy / Maint / Mgmt
- −$279
- Net cashflow
- $197
Break-even live
Sensitivity live
| Price | -10% $262 | -5% $230 | +0% $197 | +5% $165 | +10% $132 |
|---|---|---|---|---|---|
| Rent | -10% $93 | -5% $145 | +0% $197 | +5% $250 | +10% $302 |
| Rate | -1.0pp $255 | -0.5pp $227 | base $197 | +0.5pp $168 | +1.0pp $137 |
UW: 25.0% down · 7.5% · 30yr · 1.5% tax · 5.0% vac · 8.0% maint · 8.0% mgmt
Financing live
Cash to close
- Down payment
- $28,750
- Closing costs
- $3,450
- Reserves months
- —
- Total cash needed
- —
Loan-product check · same deal, 3 products live
Conventional
25% down · 7.5% · 30yr
- Down + closing
- —
- Monthly P&I
- —
- Monthly cashflow
- —
- DSCR
- —
- Eligible?
- —
Personal DTI + credit; lowest rate.
DSCR
20% down · 8.5% · 30yr
- Down + closing
- —
- Monthly P&I
- —
- Monthly cashflow
- —
- DSCR
- —
- Eligible?
- —
No personal income docs; deal must DSCR.
Hard money
10% down · 12.0% · 12mo
- Down + closing
- —
- Monthly P&I
- —
- Monthly cashflow
- —
- DSCR
- —
- Eligible?
- —
Short-term bridge; refi at stabilization.
Rent comps 8 comps
| Address | Beds | Baths | Sqft | Rent | $/sqft | DOM | Units | Dist |
|---|---|---|---|---|---|---|---|---|
| 11236 Studebaker Ave Warren, MI | 2.0 | 1.0 | 672 | $1,175 | $1.75 | 45d | 1 | 0.35mi |
| 8036 Hupp Ave Warren, MI | 2.0 | 1.0 | 680 | $1,150 | $1.69 | 45d | 1 | 0.39mi |
| 7275 Chalmers Ave Warren, MI | 2.0 | 1.0 | 703 | $1,200 | $1.71 | 25d | 1 | 0.62mi |
| 11130 Stephens Rd Warren, MI | 2.0 | 1.0 | 750 | $1,275 | $1.70 | 0d | 1 | 0.75mi |
| 7605 Jackson Ave Warren, MI | 2.0 | 1.0 | 600 | $1,165 | $1.94 | 25d | 1 | 0.80mi |
| 7033 Westminster Ave Warren, MI | 2.0 | 1.0 | 561 | $1,050 | $1.87 | 45d | 1 | 0.86mi |
| 21412 Waltham Rd Warren, MI | 2.0 | 1.0 | 696 | $1,225 | $1.76 | 45d | 1 | 1.23mi |
| 25108 Hoover Rd Warren, MI | 1.0–2.0 | 1.0 | 702 | $1,324 | $1.88 | 0d | 61 | 1.46mi |
Listing history 8 events
-
2026-06-21days on market $115,000 Active 130 DOM
-
2026-06-18days on market $115,000 Active 127 DOM
-
2026-06-17days on market $115,000 Active 126 DOM
-
2026-06-16days on market $115,000 Active 125 DOM
-
2026-06-15$115,000 Active 124 DOM
-
2026-06-13days on market $115,000 Active 124 DOM
-
2026-06-13remarks 582-char remark
-
2026-06-13$115,000 Active 123 DOM
ⓘ Source: listings_history table (triggers on properties + properties_extension) + one-shot
backfill from property_details.listing_events for pre-trigger history.
Tax reassessment forecast MI · Partial reset (capped growth)
- Current annual tax
- $2,398 · $200/mo
- Projected year-2 tax
- $2,398 · $200/mo
- Expected delta
- $0/yr ($0/mo · 0.0%)
ⓘ Screening estimate from a state-policy table — verify with the county assessor before closing.
Climate risk First Street
- Flood 3/10 Moderate FEMA zone X (unshaded) · 20% chance over 30 yrs
- Wildfire 1/10 Low
- Heat 3/10 Moderate 7 d/yr ≥97°F today · 14 d/yr by 30 yrs out
- Wind 1/10 Low
- Air quality 3/10 Moderate 3 unhealthy d/yr today · 4 by 30 yrs out
Nearby sold comps map
Loading sold comps map…
Walkable amenities ~0.75 mi
Loading nearby amenities…
Taxation est. · year 1
- Rental income
- $15,921
- − Mortgage interest
- −$6,442
- − Property taxes
- −$2,398
- − Insurance
- −$575
- − Repairs & maintenance
- −$1,274
- − Management
- −$1,274
- − Depreciation
- −$3,345
- Taxable income
- $614
- Est. tax owed @ 24.0%
- −$147
- After-tax cash flow
- $2,221/yr
For passive investors: Depreciation is non-cash, so a rental often shows a tax loss while cash-flowing — sheltering income. Rental losses are passive: they offset passive income freely, and up to $25,000/yr can offset ordinary (W-2) income if you actively participate and your MAGI is under $100k (phasing out to $0 by $150k); unused losses carry forward. On sale, claimed depreciation is recaptured at up to 25%, and gains may owe capital-gains tax (a 1031 exchange can defer both). Figures are a year-1 estimate at your 24.0% rate — not tax advice; consult a CPA.
Schools (NCES district)
- District
- Van Dyke Public Schools
- NCES district ID
- 2634680
- Math proficiency
- 7% ▼ -11.00%
- Reading proficiency
- 19% ▼ -5.00%
- Median HH income
- $33,231
- Composite
- 10.46/100
- National rank
- #9784
- State rank
- #512 of 540 in MI
Livability — Warren
- Score
- 74/100
- State rank
- #171
- US rank
- #4491
Category grades
Schools grade is shown separately in the Schools card above.
Census & demographics
- Census place
- Warren, MI
- County
- Macomb County · 638,552 people
- City population
- 114,937
- Metro
- Detroit-Warren-Dearborn, MI
- Population (ZIP)
- 31,853
- Household income
- $52,366
- Rent vs Own
- Severe rent burden
- 1754.0
Population outlook (Macomb County) Hauer SSP2
- Today (2025)
- 925,296 people
- By 2030
- 948,226 · +2.5%
- By 2040
- 983,961 · +6.3%
- By 2050
- 1,010,200 · +9.2%
- By 2075
- 1,076,222 · +16.3%
- By 2100
- 1,077,065 · +16.4%
Race, ethnicity, and origin ACS 2023
- Neighborhood character
- Diverse neighborhood (Simpson 0.61)
- Race & ethnicity
- White 53% Black 31% Asian 7% Two or more races 6% Hispanic / Latino 3%
- Common ancestry
- Romanian 11% Lithuanian 3% Slovak 2%
- Foreign-born
- 5% · Canada
- Languages at home
- 92% English-only · Other Asian/Pacific 3% Other Indo-European 2% Arabic 1%
Political lean MEDSL · Macomb
- 2024 margin
- R (+13.7) · D 42.2% · R 55.9% · Other 1.9%
- 2008→2024 swing
- -22.3pp toward R · 2008: 8.6pp · 2024: -13.7pp
- All cycles
- 2024: R+13.7 2020: R+8.1 2016: R+11.6 2012: D+4.0 2008: D+8.6
Not yet ingested
- Civics
- —
Market trends
- HPI YoY
- ▼ -211.46%
- Current HPI
- 154.8325
- Rent YoY
- ▲ 2.94%
- Metro
- Detroit-Warren-Dearborn, MI
- State GDP YoY
- ▲ 1.37%
- F500 in state
- 28
Industry mix (Fortune 500 HQ in MI)
| Industry | F500 HQs | Revenue |
|---|---|---|
| Automotive Parts | 3 | $48B |
|
||
| Automotive | 2 | $372B |
|
||
| Chemicals | 1 | $45B |
|
||
| Automotive Retail | 1 | $29B |
|
||
| Healthcare / Medical Devices | 1 | $23B |
|
||
| Automotive Technology | 1 | $20B |
|
||
Price history
+369.4% since first listed35 events — show timeline
- 2026-06-14 Relisted — REALCOMP
- 2026-06-14 Price Changed $115,000 REALCOMP
- 2026-06-13 Price Changed $115,000 MiRealSource-MiMLS
- 2026-06-12 Relisted — MiRealSource-MiMLS
- 2026-05-28 Sold (Public Records) $50,000 Public Records
- 2025-11-18 Pending — REALCOMP
- 2025-11-18 Pending — MiRealSource-MiMLS
- 2025-11-18 Listing Removed — MiRealSource-MiMLS
- 2025-10-17 Price Changed $99,000 MiRealSource-MiMLS
- 2025-10-16 Price Changed $99,000 REALCOMP
- 2025-08-08 Price Changed $109,900 MiRealSource-MiMLS
- 2025-08-07 Price Changed $109,900 REALCOMP
- 2025-07-18 Listed $120,000 REALCOMP
- 2025-07-18 Listed $120,000 MiRealSource-MiMLS
- 2024-04-05 Sold (MLS) $62,500 MiRealSource-MiMLS
- 2024-04-05 Sold (MLS) $62,500 REALCOMP
- 2024-03-22 Pending — MiRealSource-MiMLS
- 2024-03-22 Pending — REALCOMP
- 2024-01-06 Listed $68,900 MiRealSource-MiMLS
- 2024-01-06 Listed $68,900 REALCOMP
- 2023-09-04 Listing Removed — MiRealSource-MiMLS
- 2023-09-04 Listing Removed — REALCOMP
- 2023-08-30 Listed $65,900 MiRealSource-MiMLS
- 2023-08-30 Listed $65,900 REALCOMP
- 2007-05-14 Sold (MLS) $19,500 REALCOMP
- 2007-05-14 Sold (MLS) $19,500 MiRealSource-MiMLS
- 2007-04-04 Listing Removed — MiRealSource-MiMLS
- 2006-10-05 Listed $33,900 REALCOMP
- 2006-10-05 Listed $33,900 MiRealSource-MiMLS
- 1998-05-28 Sold (Public Records) $38,000 Public Records
- 1998-04-08 Sold (MLS) $38,000 MiRealSource-MiMLS
- 1998-01-02 Listing Removed — MiRealSource-MiMLS
- 1997-12-04 Listed $38,000 MiRealSource-MiMLS
- 1990-03-13 Sold (Public Records) $16,000 Public Records
- 1990-03-13 Sold (Public Records) $24,500 Public Records
Property tax history
+13.4%/yrLatest (2025): $2,398 · +28.4% YoY. Source: county tax records.
Cash-flow waterfall
monthlySold comps — $/sqft
last 12 mo · ≤1 miLoading sold comps…