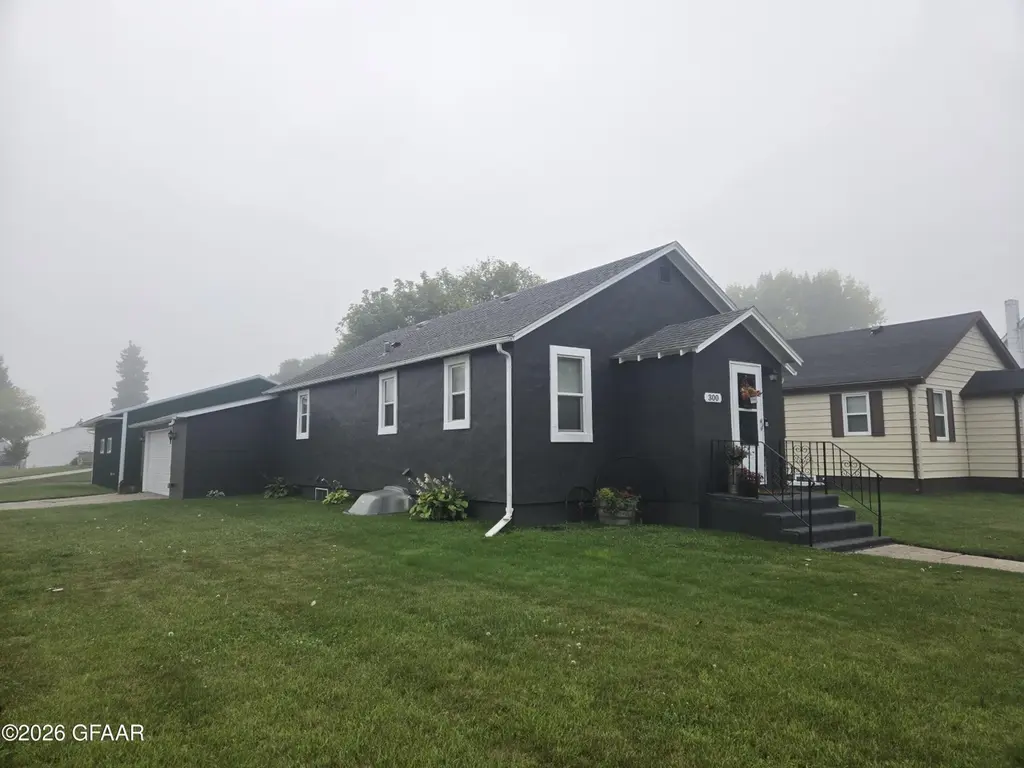
300 E 2nd Ave S · Cavalier, ND
Flood risk 1/10 · Minimal
- FEMA flood zone
- X (unshaded)
- Chance of flooding over 30 yrs
- 0.0%
- Est. flood insurance / yr
- $473 – $860
Fire risk 5/10 · Moderate
- Est. fire insurance / yr
- $1,289 – $2,393
Heat risk 2/10 · Minimal
- Hot days now (above 94°F)
- 7 days/yr
- Hot days in 30 yrs
- 12 days/yr
Wind risk 1/10 · Minimal
- Chance of severe wind over 30 yrs
- —
Air-quality risk 4/10 · Minor
- Unhealthy air days now
- 5 days/yr
- Unhealthy air days in 30 yrs
- 5 days/yr
Risk factors via First Street. Map © Google.
Why this score? — see what drove the D grade
The composite is a weighted blend of 9 inputs, each scored 0–100. Each bar is that input's sub-score; the figure is the points it added to the 100-point composite (weight × sub-score).
- Cash flow +10.3/30.0
- Appreciation +7.9/10.0
- ARV discount +7.5/15.0
- Schools +4.2/10.0
- Livability +3.5/5.0
- DSCR +2.9/10.0
- Rent growth +2.5/5.0
- Condition / age +2.5/5.0
- 1% rule +1.8/10.0
$205,000
🖨 Deal sheet (PDF) 📄 Offer letter ✓ Due diligence
Key facts
- Main floor laundry
- 6,969 sq ft lot
- 4 garage spots
Tags
Neighborhood map
What this means for you Summary
Snapshot
- This is a 4-bed/2.0-bath other listed at $205k.
Deal economics
- At list price, monthly cash flow is $-113 ($-1k/yr) — negative.
- To cash-flow at today's rent, offer at most $185k (9.8% below list).
- To meet the 1% rule (rent ≥ 1% of price), the offer needs to be $140k (31.5% below list).
- Recommended offer: $140k (31.5% below list) — sets the bar for 1% rule.
Location & tenants
- Location reads 70/100 on livability (#83 in ND) — a middle-class / working-renter tenant base. Strengths: crime A+, cost of living A+, housing A+; Watch: health & safety D+, amenities F, commute F.
- Cavalier 6 (rural): math 47% / reading 51% proficiency, ranked #12 of 53 in ND (top 23%) — families likely to look elsewhere, expect single-tenant / working-renter base with shorter leases; only 18% free/reduced lunch — higher-income household profile.
- Zoned schools: Cavalier Elementary School (math 47% / reading 37%, grade F, #118 of 236 statewide, top 54%, 220 students, 26% FRL); Cavalier High School (math 47% / reading 62%, grade C-, #9 of 144 statewide, top 8%, 192 students, 26% FRL).
- Market conditions: 18 active listings in the ZIP; 2 units permitted in Pembina County in 2024 (0 in 5+ unit buildings).
Forward outlook
- In year one you build about $13k of equity ($1k loan paydown + $12k appreciation (5.9% local appreciation)).
- Pembina County population projected at -23% by 2050 — secular population decline; favor cash flow + early exit over multi-decade hold.
- By year 3, paydown + projected appreciation supports a ~$33k cash-out refi (75% LTV) — recoverable capital for the next deal without selling this one.
Negotiation context
- Only 5 days on market — expect competitive offers; lowballing is unlikely to land.
- Current owner paid $90k; list at $205k implies a 128% gain — meaningful room to come down on a strong offer.
Risks & watch-outs
- Watch-outs: built in 1939 — expect roof / HVAC / electrical / plumbing capex.
- Climate carrying-cost: moderate wildfire risk — expect insurance premiums to compound above CPI over the hold.
Questions for the listing agent
- What do current leases actually rent for vs. the listed asking? Can we see a recent rent roll and the last 12 months of T-12 income?
- Built in 1939 — when were the roof, HVAC, electrical panel, plumbing, and water heater last replaced?
- Is there a deadline driving the sale (1031 exchange, divorce, estate, relocation)? That informs how much negotiation room exists.
- The area grade is low — what's the realistic commute time and amenity access for the typical tenant pool here? Any planned neighborhood developments (good or bad) we should know about?
- What's the average days-on-market for RENTAL listings here right now (not sales)? A rising rental-DOM trend means longer vacancies and softer asking-rent achievability than the comps imply.
- What's the recent tenant-quality profile in this submarket — average credit score on applications, eviction rate, late-payment / NSF rate, and stable-employment percentage? A property-management company in the area should have these aggregated.
- How much new for-sale + rental construction is in the pipeline within 1–3 miles? Heavy new supply typically softens prices + rents 12–24 months out; constrained supply supports both.
Investment metrics
- 1% rule
- 0.68% ✗
- Cap rate
- 5.63%
- Cash-on-cash
- -2.37%
- DSCR
- 0.89
- GRM
- 12.2
CMA / ARV
No comps found within radius.
Projected returns pro-forma
5.87% appreciation · 3.0% rent growth · sell at horizon
- IRR
- 13.1%
- Equity multiple
- 1.88×
- Total profit
- $50,237
- Equity at exit
- $127,136
- IRR
- 13.7%
- Equity multiple
- 3.68×
- Total profit
- $153,667
- Equity at exit
- $229,072
Cash invested: $57,400 (down + closing). Projections, not guarantees.
Landlord ↔ Tenant lean methodology
- Overall (STATE)
- 82 Strongly Landlord-Friendly
- State North Dakota
- 82 Strongly Landlord-Friendly · R+20
- County
- — inherits STATE
- City
- — inherits STATE
ZIP-level market 58220
- Home prices YoY
- 4.5%
- Active inventory
- 18
- Price-to-rent
- 12.2×
Monthly cashflow live
- Estimated rent
- $1,404 medium interval (Pro) →
- Mortgage (P&I)
- −$1,075
- Tax from tax record
- −$62 /mo · $742/yr
- Insurance
- −$85
- HOA
- −$0
- Vacancy / Maint / Mgmt
- −$295
- Net cashflow
- $-113
Break-even live
Sensitivity live
| Price | -10% $3 | -5% $-55 | +0% $-113 | +5% $-171 | +10% $-229 |
|---|---|---|---|---|---|
| Rent | -10% $-224 | -5% $-169 | +0% $-113 | +5% $-58 | +10% $-2 |
| Rate | -1.0pp $-10 | -0.5pp $-61 | base $-113 | +0.5pp $-167 | +1.0pp $-221 |
UW: 25.0% down · 7.5% · 30yr · 1.5% tax · 5.0% vac · 8.0% maint · 8.0% mgmt
Financing live
Cash to close
- Down payment
- $51,250
- Closing costs
- $6,150
- Reserves months
- —
- Total cash needed
- —
Loan-product check · same deal, 3 products live
Conventional
25% down · 7.5% · 30yr
- Down + closing
- —
- Monthly P&I
- —
- Monthly cashflow
- —
- DSCR
- —
- Eligible?
- —
Personal DTI + credit; lowest rate.
DSCR
20% down · 8.5% · 30yr
- Down + closing
- —
- Monthly P&I
- —
- Monthly cashflow
- —
- DSCR
- —
- Eligible?
- —
No personal income docs; deal must DSCR.
Hard money
10% down · 12.0% · 12mo
- Down + closing
- —
- Monthly P&I
- —
- Monthly cashflow
- —
- DSCR
- —
- Eligible?
- —
Short-term bridge; refi at stabilization.
Listing history 5 events
-
2026-04-02status Pending
-
2026-03-30historical Contingent - Inspection
-
2026-03-28$205,000 Active
-
2018-09-12soldstatus $90,000
-
2005-12-07soldstatus $38,000
ⓘ Source: listings_history table (triggers on properties + properties_extension) + one-shot
backfill from property_details.listing_events for pre-trigger history.
Tax reassessment forecast ND · Resets to sale price
- Current annual tax
- $742 · $62/mo
- Projected year-2 tax
- $2,009 · $167/mo
- Expected delta
- +$1,267/yr (+$106/mo · 170.6%)
ⓘ Screening estimate from a state-policy table — verify with the county assessor before closing.
Climate risk First Street
- Flood 1/10 Low FEMA zone X (unshaded) · 0% chance over 30 yrs
- Wildfire 5/10 Major
- Heat 2/10 Low 7 d/yr ≥94°F today · 12 d/yr by 30 yrs out
- Wind 1/10 Low
- Air quality 4/10 Moderate 5 unhealthy d/yr today · 5 by 30 yrs out
Nearby sold comps map
Loading sold comps map…
Walkable amenities ~0.75 mi
Loading nearby amenities…
Taxation est. · year 1
- Rental income
- $16,845
- − Mortgage interest
- −$11,483
- − Property taxes
- −$742
- − Insurance
- −$1,025
- − Repairs & maintenance
- −$1,348
- − Management
- −$1,348
- − Depreciation
- −$5,964
- Taxable loss
- −$5,065
- Est. tax savings @ 24.0%
- +$1,216
- After-tax cash flow
- $-145/yr
For passive investors: Depreciation is non-cash, so a rental often shows a tax loss while cash-flowing — sheltering income. Rental losses are passive: they offset passive income freely, and up to $25,000/yr can offset ordinary (W-2) income if you actively participate and your MAGI is under $100k (phasing out to $0 by $150k); unused losses carry forward. On sale, claimed depreciation is recaptured at up to 25%, and gains may owe capital-gains tax (a 1031 exchange can defer both). Figures are a year-1 estimate at your 24.0% rate — not tax advice; consult a CPA.
Schools (NCES district)
- District
- Cavalier 6
- NCES district ID
- 3800018
- Math proficiency
- 47% ▲ 2.00%
- Reading proficiency
- 51% ▲ 4.00%
- Median HH income
- $53,577
- Composite
- 42.29/100
- National rank
- #3264
- State rank
- #12 of 53 in ND
Livability — Cavalier
- Score
- 70/100
- State rank
- #83
- US rank
- #7850
Category grades
Schools grade is shown separately in the Schools card above.
Census & demographics
- Census place
- Cavalier, ND
- Population (ZIP)
- 2,215
Population outlook (Pembina County) Hauer SSP2
- Today (2025)
- 6,414 people
- By 2030
- 6,060 · -5.5%
- By 2040
- 5,383 · -16.1%
- By 2050
- 4,925 · -23.2%
- By 2075
- 5,025 · -21.7%
- By 2100
- 6,293 · -1.9%
Race, ethnicity, and origin ACS 2023
- Neighborhood character
- Predominantly White (92%)
- Race & ethnicity
- White 92% Two or more races 4% Black 2% Hispanic / Latino 2%
- Common ancestry
- Portuguese 24% Lithuanian 8% Serbian 4%
- Foreign-born
- 5% · Canada
- Languages at home
- 95% English-only · Spanish 2% German/W. Germanic 1% Other Indo-European 1%
Political lean MEDSL · Pembina
- 2024 margin
- Solid R (+53.3) · D 22.8% · R 76.1% · Other 1.1%
- 2008→2024 swing
- -46.4pp toward R · 2008: -6.9pp · 2024: -53.3pp
- All cycles
- 2024: R+53.3 2020: R+50.2 2016: R+49.2 2012: R+20.1 2008: R+6.9
Not yet ingested
- Civics
- —
Market trends
- HPI YoY
- ▲ 5.87%
- Current HPI
- 137.4829
- Rent YoY
- —
- Metro
- —
- State GDP YoY
- ▲ 2.09%
- F500 in state
- 2
Industry mix (Fortune 500 HQ in ND)
| Industry | F500 HQs | Revenue |
|---|---|---|
| Utilities / Construction | 1 | $6B |
|
||
Price history
+439.5% since first listed5 events — show timeline
- 2026-04-02 Pending — NORTHSTARMLS as Distributed by MLS Grid
- 2026-03-30 Contingent — NORTHSTARMLS as Distributed by MLS Grid
- 2026-03-28 Listed $205,000 NORTHSTARMLS as Distributed by MLS Grid
- 2018-09-12 Sold (Public Records) $90,000 Public Records
- 2005-12-07 Sold (Public Records) $38,000 Public Records
Property tax history
-5.4%/yrLatest (2025): $742 · -43.2% YoY. Source: county tax records.
Cash-flow waterfall
monthlySold comps — $/sqft
last 12 mo · ≤1 miLoading sold comps…