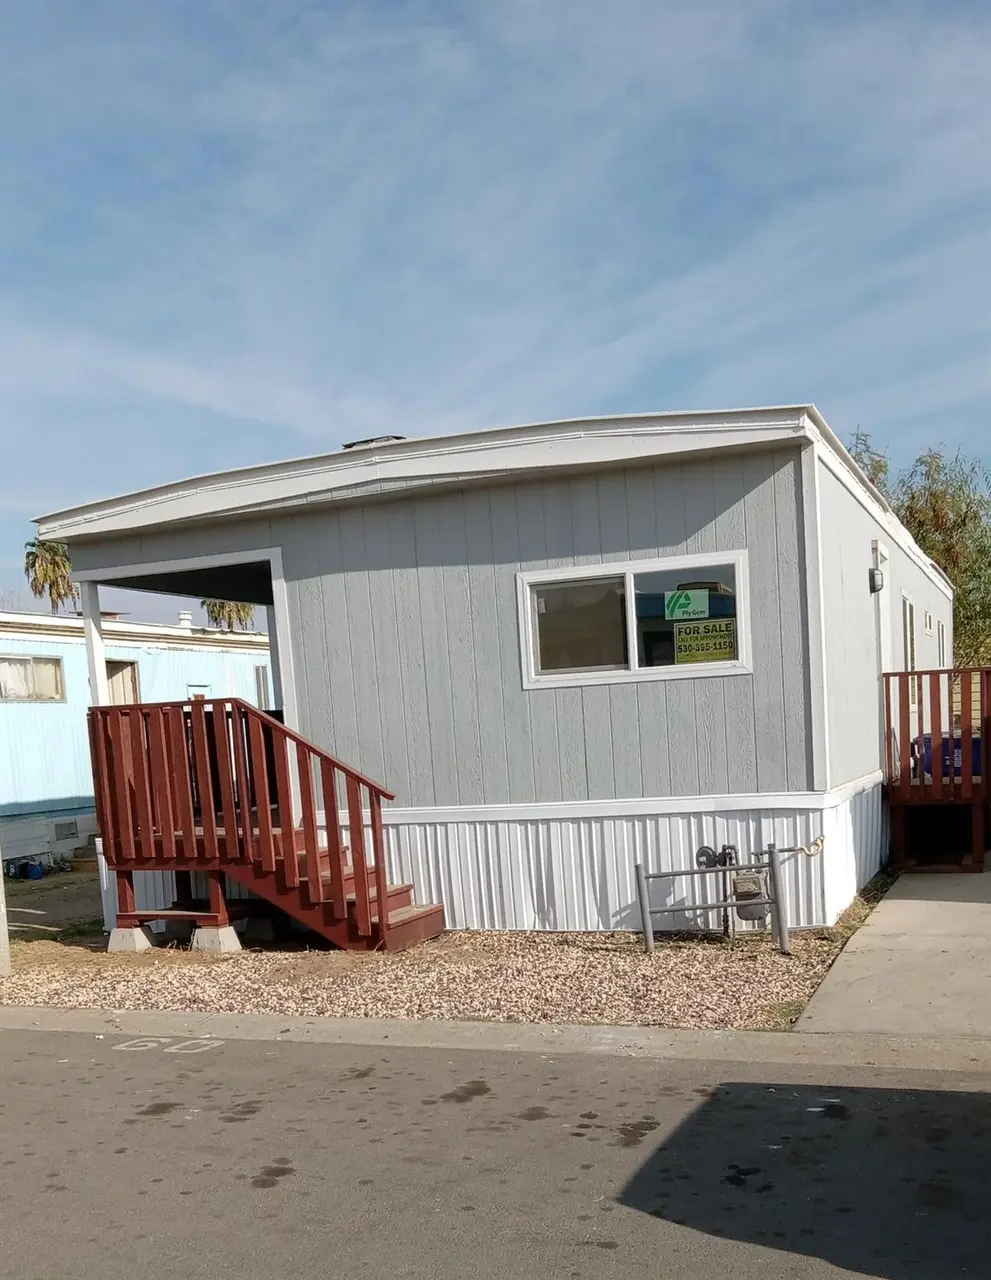
801 Schipper St #60 · Arvin, CA
Flood risk 1/10 · Minimal
- FEMA flood zone
- AO
- Chance of flooding over 30 yrs
- 0.0%
- Est. flood insurance / yr
- $848 – $2,087
Fire risk 5/10 · Moderate
- Est. fire insurance / yr
- $659 – $1,223
Heat risk 8/10 · Major
- Hot days now (above 104°F)
- 7 days/yr
- Hot days in 30 yrs
- 19 days/yr
Wind risk 1/10 · Minimal
- Chance of severe wind over 30 yrs
- —
Air-quality risk 9/10 · Severe
- Unhealthy air days now
- 19 days/yr
- Unhealthy air days in 30 yrs
- 25 days/yr
Risk factors via First Street. Map © Google.
Why this score? — see what drove the B- grade
The composite is a weighted blend of 9 inputs, each scored 0–100. Each bar is that input's sub-score; the figure is the points it added to the 100-point composite (weight × sub-score).
- Cash flow +30.0/30.0
- 1% rule +10.0/10.0
- DSCR +10.0/10.0
- ARV discount +7.5/15.0
- Schools +3.4/10.0
- Rent growth +2.5/5.0
- Livability +2.1/5.0
- Condition / age +1.0/5.0
- Appreciation +0.0/10.0
$39,995
🖨 Deal sheet 📄 Offer letter ✓ Due diligence
Listing remarks
Welcome home to Casa Estate Arvin - the best up and coming community in Arvin!! This 2 bedroom, 1 bath home with a LARGE footprint is available for sale! Home does need interior work - so bring your handyman and your imagination and get started on your dream home! The Park already made VAST improvements to the exterior, with new siding and skirting. New windows and sealed roof coat. All offers must be non-financed
Key facts
- Sealed roof coat
- New siding
- Large footprint
Tags
Neighborhood map
What this means for you Summary
Snapshot
- This is a 2-bed/1.0-bath manufactured listed at $40k. Condition is rated poor.
Deal economics
- At list price, monthly cash flow is $506 ($6k/yr) — positive.
- The deal already cash-flows at list — no discount required.
- Meets the 1% rule at list price ($1k rent vs $40k).
- Recommended offer: $35k (12.0% below list) — sets the bar for market timing.
Location & tenants
- Location reads 42/100 on livability (#1,368 in CA) — a working-class tenant base; expect higher turnover. Strengths: housing A+; Watch: cost of living D+, health & safety D+, schools F.
- Kern High (urban): math 21% / reading 51% proficiency, ranked #860 of 1,400 in CA (top 61%) — families likely to look elsewhere, expect single-tenant / working-renter base with shorter leases.
- Market conditions: 27 active listings in the ZIP; 3 comparable units currently listed for rent nearby; rentals leasing fast (median 3d on market — plan ~1-2 weeks tenant-placement turnaround); 3,244 units permitted in Kern County in 2024 (73 in 5+ unit buildings).
Forward outlook
- Local home prices are declining (-3.0%/yr); year-one equity from $276 of loan paydown is wiped out by about $1k of value loss. Plan a longer hold.
- Kern County population projected at +17% by 2050 — long-run rental-demand tailwind backs the buy-and-hold thesis.
- At projected returns (-3.0% appreciation + 3.0% rent growth), your $11k cash investment doubles in ~3 years — after that, you're playing with house money.
Negotiation context
- It's been on market 147 days — a 12% lower offer ($35k) is reasonable based on typical stale-listing flexibility.
Risks & watch-outs
- Watch-outs: flood insurance adds $122/mo.
- Climate carrying-cost: in FEMA flood zone AO (mandatory federal flood insurance); moderate wildfire risk; extreme-heat days projected 7→19/yr by 2055 (HVAC capex compounding) — expect insurance premiums to compound above CPI over the hold.
Questions for the listing agent
- It's been on market 147 days. Have you received any prior offers? Is the seller open to a 12% concession, seller financing, or rate buy-down credit?
- Have any recent inspections been done? Can we get a copy of the seller's disclosures and any deferred-maintenance estimates?
- Built in 1964 — when were the roof, HVAC, electrical panel, plumbing, and water heater last replaced?
- What's the actual annual flood-insurance premium (NFIP or private), and is the property in a SFHA with mandatory coverage?
- Why hasn't it sold? Are there any deal-killer items the seller is aware of (foundation, flood, title, zoning, code violations)?
- Is there a deadline driving the sale (1031 exchange, divorce, estate, relocation)? That informs how much negotiation room exists.
- Schools are F-rated, which usually means shorter tenancies and higher turnover. Who's the typical renter profile here, and what's been the actual vacancy rate?
- Crime grade is F in this area — have there been break-ins, vandalism, or insurance claims at this property in the last 3 years? What carrier currently insures it and at what premium?
- What's the average days-on-market for RENTAL listings here right now (not sales)? A rising rental-DOM trend means longer vacancies and softer asking-rent achievability than the comps imply.
- What's the recent tenant-quality profile in this submarket — average credit score on applications, eviction rate, late-payment / NSF rate, and stable-employment percentage? A property-management company in the area should have these aggregated.
- How much new for-sale + rental construction is in the pipeline within 1–3 miles? Heavy new supply typically softens prices + rents 12–24 months out; constrained supply supports both.
Investment metrics
- 1% rule
- 2.86% ✓
- Cap rate
- 25.14%
- Cash-on-cash
- 67.32%
- DSCR
- 4.00
- GRM
- 2.9
CMA / ARV
- ARV (median comp)
- $19,500
- List price
- $39,995
- Delta
- 105.10%
- Verdict
- OVERPRICED
- Comps
- 10 within 1.0 mi
Show comp detail 10 sales within ~0.75 mi
| Address | Dist | Beds/Ba | Sqft | Sold | Price | $/sf | Match |
|---|---|---|---|---|---|---|---|
| 801 Schipper St #89 | 0.00mi | 2/1.0 | 940 (-2%) | 15mo | $15,000 | $16 | 84 |
| 801 Schipper St #86 | 0.00mi | 2/1.5 | 1,040 (+8%) | 1mo | $10,000 | $10 | 84 |
| 801 Schipper St #63 | 0.00mi | 3/2.0 (+1) | 960 (0%) | 9mo | $75,000 | $78 | 84 |
| 801 Schipper St #46 | 0.07mi | 2/2.0 | 1,040 (+8%) | 3mo | $9,500 | $9 | 77 |
| 801 Schipper St #36 | 0.07mi | 2/2.0 | 920 (-4%) | 12mo | $26,000 | $28 | 76 |
| 801 Schipper St #48 | 0.07mi | 3/2.0 (+1) | 1,040 (+8%) | 2mo | $77,500 | $75 | 72 |
| 801 Schipper St #23 | 0.07mi | 2/2.0 | 1,040 (+8%) | 9mo | $7,500 | $7 | 71 |
| 801 Schipper St #66 | 0.07mi | 2/2.0 | 1,040 (+8%) | 9mo | $79,990 | $77 | 71 |
| 801 Schipper St #41 | 0.07mi | 2/2.0 | 1,040 (+8%) | 14mo | $75,000 | $72 | 67 |
| 801 Schipper St #47 | 0.07mi | 3/2.0 (+1) | 1,100 (+15%) | 18mo | $85,000 | $77 | 48 |
Match score weights: distance 35% · size 25% · config 20% · recency 20%. Top-matched comps best support the ARV.
Projected returns pro-forma
-3.0% appreciation · 3.0% rent growth · sell at horizon
- IRR
- 52.5%
- Equity multiple
- 3.31×
- Total profit
- $25,834
- Equity at exit
- $5,963
- IRR
- 57.8%
- Equity multiple
- 6.75×
- Total profit
- $64,362
- Equity at exit
- $3,458
Cash invested: $11,199 (down + closing). Projections, not guarantees.
Landlord ↔ Tenant lean methodology
- Overall (STATE)
- 18 Strongly Tenant-Friendly
- State California
- 18 Strongly Tenant-Friendly · D+13
- County
- — inherits STATE
- City
- — inherits STATE
ZIP-level market 93203
- Home prices YoY
- -5.4%
- Active inventory
- 27
- Price-to-rent
- 2.9×
Monthly cashflow live
- Estimated rent
- $1,145 medium interval (Pro) →
- Mortgage (P&I)
- −$210
- Tax est. 1.5%
- −$50 /mo · $600/yr
- Insurance
- −$17
- Flood insurance flood zone
- −$122 /mo · $1,468/yr
- HOA
- −$0
- Vacancy / Maint / Mgmt
- −$240
- Net cashflow
- $506
Break-even live
UW: 25.0% down · 7.5% · 30yr · 1.5% tax · 5.0% vac · 8.0% maint · 8.0% mgmt
Financing live
Cash to close
- Down payment
- $9,999
- Closing costs
- $1,200
- Reserves months
- —
- Total cash needed
- —
Loan-product check · same deal, 3 products live
Conventional
25% down · 7.5% · 30yr
- Down + closing
- —
- Monthly P&I
- —
- Monthly cashflow
- —
- DSCR
- —
- Eligible?
- —
Personal DTI + credit; lowest rate.
DSCR
20% down · 8.5% · 30yr
- Down + closing
- —
- Monthly P&I
- —
- Monthly cashflow
- —
- DSCR
- —
- Eligible?
- —
No personal income docs; deal must DSCR.
Hard money
10% down · 12.0% · 12mo
- Down + closing
- —
- Monthly P&I
- —
- Monthly cashflow
- —
- DSCR
- —
- Eligible?
- —
Short-term bridge; refi at stabilization.
Rent comps 3 comps
| Address | Beds | Baths | Sqft | Rent | $/sqft | DOM | Units | Dist |
|---|---|---|---|---|---|---|---|---|
| 668 Comanche Dr Arvin, CA | 3.0 | 2.0 | 1080 | $1,329 | $1.23 | 2d | 1 | 0.64mi |
| 225 Meyer St Arvin, CA | 2.0 | 1.0 | 788 | $1,036 | $1.31 | 2d | 1 | 0.87mi |
| 200 Haven Dr Apt B Arvin, CA | 2.0 | 1.0 | 850 | $995 | $1.17 | 2d | 1 | 0.88mi |
Listing history 15 events
-
2026-06-18days on market $39,995 Active 147 DOM
-
2026-06-17days on market $39,995 Active 146 DOM
-
2026-06-16days on market $39,995 Active 145 DOM
-
2026-06-15days on market $39,995 Active 144 DOM
-
2026-06-14days on market $39,995 Active 142 DOM
-
2026-06-13days on market $39,995 Active 141 DOM
-
2026-06-10days on market $39,995 Active 139 DOM
-
2026-06-09days on market $39,995 Active 138 DOM
-
2026-06-08days on market $39,995 Active 137 DOM
-
2026-06-07days on market $39,995 Active 136 DOM
-
2026-06-05days on market $39,995 Active 133 DOM
-
2026-06-03days on market $39,995 Active 132 DOM
-
2026-06-03days on market $39,995 Active 131 DOM
-
2026-06-01days on market $39,995 Active 130 DOM
-
2026-05-31days on market $39,995 Active 129 DOM
ⓘ Source: listings_history table (triggers on properties + properties_extension) + one-shot
backfill from property_details.listing_events for pre-trigger history.
Climate risk First Street
- Flood 1/10 Low FEMA zone AO · 0% chance over 30 yrs
- Wildfire 5/10 Major
- Heat 8/10 Severe 7 d/yr ≥104°F today · 19 d/yr by 30 yrs out
- Wind 1/10 Low
- Air quality 9/10 Extreme 19 unhealthy d/yr today · 25 by 30 yrs out
Nearby sold comps map
Loading sold comps map…
Walkable amenities ~0.75 mi
Loading nearby amenities…
Taxation est. · year 1
- Rental income
- $13,741
- − Mortgage interest
- −$2,240
- − Property taxes
- −$600
- − Insurance
- −$1,667
- − Repairs & maintenance
- −$1,099
- − Management
- −$1,099
- − Depreciation
- −$1,163
- Taxable income
- $5,871
- Est. tax owed @ 24.0%
- −$1,409
- After-tax cash flow
- $4,662/yr
For passive investors: Depreciation is non-cash, so a rental often shows a tax loss while cash-flowing — sheltering income. Rental losses are passive: they offset passive income freely, and up to $25,000/yr can offset ordinary (W-2) income if you actively participate and your MAGI is under $100k (phasing out to $0 by $150k); unused losses carry forward. On sale, claimed depreciation is recaptured at up to 25%, and gains may owe capital-gains tax (a 1031 exchange can defer both). Figures are a year-1 estimate at your 24.0% rate — not tax advice; consult a CPA.
Condition & rehab AI · 8 photos
This manufactured home requires extensive renovations to bring it up to modern standards, significantly improving its resale and rental value.
Repairs flagged
- Major countertops — Severe wear and tear
- Major sink — Dirty and outdated
- Major cabinetry — Outdated and worn
- Major flooring — Worn and damaged
- Major paint — Peeling and stained
- Major siding — Worn
- Major windows — Dirty and outdated
Value-add opportunities
- Resale New countertops and cabinetry — Modernizes the kitchen
- Resale New sink and fixtures — Enhances bathroom functionality
- Resale New flooring — Improves aesthetics and durability
- Resale Paint job — Freshens up interior walls
- Resale New siding — Enhances curb appeal
- Resale New windows — Improves natural light and energy efficiency
- Both HVAC system upgrade — Enhances comfort and energy efficiency
Renovation cost estimate screening
| Repair item | Severity | Est. cost |
|---|---|---|
| countertops · Severe wear and tear | Major | $15,000–50,000 |
| sink · Dirty and outdated | Major | $15,000–50,000 |
| cabinetry · Outdated and worn | Major | $15,000–50,000 |
| flooring · Worn and damaged | Major | $15,000–50,000 |
| paint · Peeling and stained | Major | $15,000–50,000 |
| siding · Worn | Major | $15,000–50,000 |
| windows · Dirty and outdated | Major | $15,000–50,000 |
| Total estimated repair cost · 7 items | $105,000–350,000 |
Value-add ROI direction
- Resale New countertops and cabinetry — Modernizes the kitchen ↑
- Resale New sink and fixtures — Enhances bathroom functionality ↑
- Resale New flooring — Improves aesthetics and durability ↑
- Resale Paint job — Freshens up interior walls ↑
- Resale New siding — Enhances curb appeal ↑
- Resale New windows — Improves natural light and energy efficiency ↑
- Both HVAC system upgrade — Enhances comfort and energy efficiency ↑
ⓘ Cost ranges are severity-bucket heuristics (US national rule-of-thumb). Get contractor quotes + a written scope before underwriting a rehab budget.
Schools (NCES district)
- District
- Kern High
- NCES district ID
- 0619540
- Math proficiency
- 21% ▬ 0.00%
- Reading proficiency
- 51% ▲ 2.00%
- Median HH income
- $49,686
- Composite
- 33.68/100
- National rank
- #10443
- State rank
- #860 of 1400 in CA
Livability — Arvin
- Score
- 42/100
- State rank
- #1368
- US rank
- #27087
Category grades
Schools grade is shown separately in the Schools card above.
Census & demographics
- Census place
- Arvin, CA
- Population (ZIP)
- 20,571
Population outlook (Kern County) Hauer SSP2
- Today (2025)
- 947,286 people
- By 2030
- 978,984 · +3.3%
- By 2040
- 1,045,018 · +10.3%
- By 2050
- 1,105,232 · +16.7%
- By 2075
- 1,229,538 · +29.8%
- By 2100
- 1,238,059 · +30.7%
Race, ethnicity, and origin ACS 2023
- Neighborhood character
- Predominantly Hispanic (94%)
- Race & ethnicity
- Hispanic / Latino 94% Two or more races 29% White 4%
- Hispanic origin (detail)
- Mexican 91%
- Foreign-born
- 31% · Canada
- Languages at home
- 17% English-only · Spanish 83%
Political lean MEDSL · Kern
- 2024 margin
- Strong R (+21.1) · D 38.2% · R 59.3% · Other 2.5%
- 2008→2024 swing
- -3.3pp toward R · 2008: -17.8pp · 2024: -21.1pp
- All cycles
- 2024: R+21.1 2020: R+10.2 2016: R+15.0 2012: R+20.9 2008: R+17.8
Not yet ingested
- Civics
- —
Market trends
- HPI YoY
- ▼ -19.57%
- Current HPI
- 342.8562
- Rent YoY
- —
- Metro
- —
- State GDP YoY
- ▲ 3.21%
- F500 in state
- 116
Industry mix (Fortune 500 HQ in CA)
| Industry | F500 HQs | Revenue |
|---|---|---|
| Technology | 27 | $1,492B |
|
||
| Financial Services | 3 | $174B |
|
||
| Retail | 3 | $44B |
|
||
| Insurance | 3 | $26B |
|
||
| Media / Entertainment | 2 | $115B |
|
||
| Pharmaceuticals / Biotech | 2 | $62B |
|
||
Cash-flow waterfall
monthlySold comps — $/sqft
last 12 mo · ≤1 miLoading sold comps…