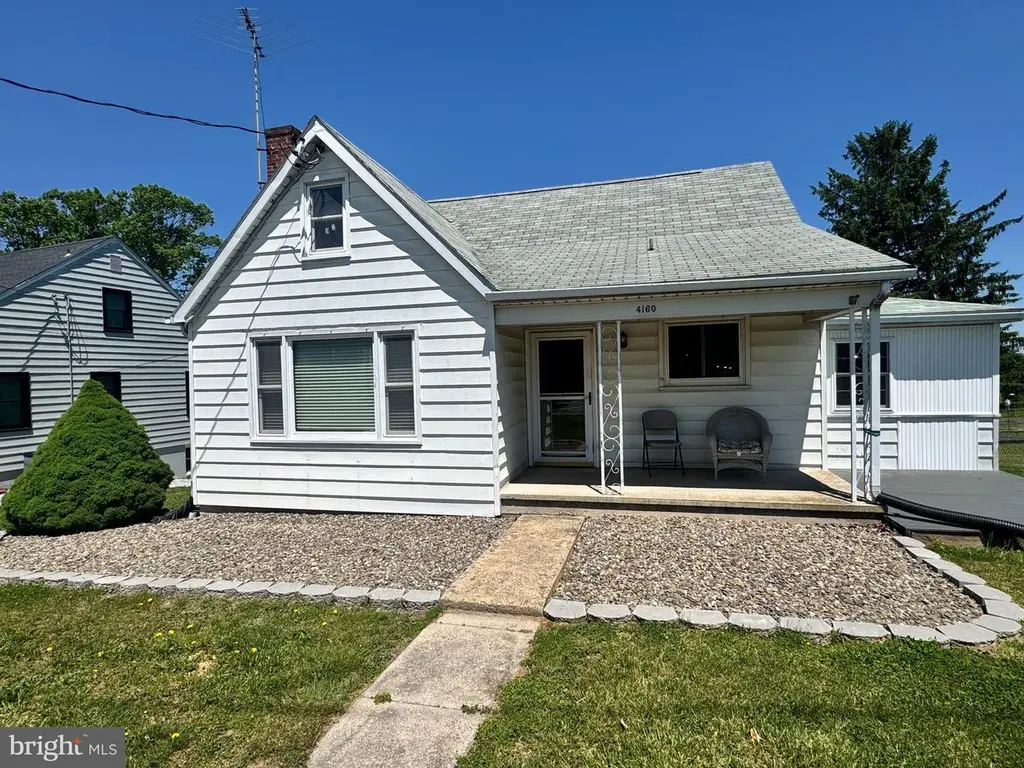
4160 Black Rock Rd · Hampstead, MD
Flood risk 1/10 · Minimal
- FEMA flood zone
- X (unshaded)
- Chance of flooding over 30 yrs
- 0.0%
- Est. flood insurance / yr
- $473 – $860
Fire risk 3/10 · Minor
- Est. fire insurance / yr
- $755 – $1,403
Heat risk 5/10 · Moderate
- Hot days now (above 101°F)
- 7 days/yr
- Hot days in 30 yrs
- 15 days/yr
Wind risk 4/10 · Minor
- Chance of severe wind over 30 yrs
- 13.0%
Air-quality risk 3/10 · Minor
- Unhealthy air days now
- 2 days/yr
- Unhealthy air days in 30 yrs
- 4 days/yr
Risk factors via First Street. Map © Google.
Why this score? — see what drove the D grade
The composite is a weighted blend of 9 inputs, each scored 0–100. Each bar is that input's sub-score; the figure is the points it added to the 100-point composite (weight × sub-score).
- ARV discount +13.6/15.0
- Cash flow +9.8/30.0
- Schools +3.7/10.0
- Livability +3.6/5.0
- DSCR +2.8/10.0
- Rent growth +2.5/5.0
- Condition / age +2.5/5.0
- 1% rule +2.2/10.0
- Appreciation +0.0/10.0
$285,000
🖨 Deal sheet 📄 Offer letter ✓ Due diligence
Listing remarks
This charming Cape Cod built in 1954, offers a perfect blend of classic design and modern comfort. With 2 cozy bedrooms and 2 full bathrooms, the traditional floor plan invites you to unwind. The spacious living area features beautiful wood floors and a wood burning fireplace and pellet stove, perfect for those chilly evenings. The kitchen includes appliances such as a refrigerator, dishwasher, and microwave, along with a convenient pantry for all your culinary needs. Enjoy the ease of laundry with both a washer and dryer included. Step outside to a generous 0.21-acre lot, providing ample space for outdoor activities or gardening. The unfinished basement offers potential for a workshop or a
Key facts
- 9,148 sq ft lot
- Garage
- Built 1954
Property features AI
Exterior
- Parking: Basement attached garage (1-car); Driveway parking for 2 cars; On-street parking; Total of 3 garage/parking spaces
- Utilities: Public sewer; Well water; Electric service (cooling fuel and hot water); Oil heating
- Home design: Detached home; Stick-built construction; Block foundation; Above-grade and below-grade structures
- Construction: Estimated year built; Stick built construction; Block foundation; Detached structure
- Exterior features: Basement with outside entrance and garage access; Unfinished basement with workshop; Detached structure; Not in a federal flood zone
Interior
- Kitchen: Dishwasher; Microwave; Refrigerator; Stove
- Bedrooms: One bedroom on the main level; One bedroom on the upper level
- Flooring: Wood floors
- Bathrooms: Two full bathrooms (one on main level, one on upper level)
- Heating & cooling: Radiator heating (oil-fired); Ceiling fan cooling; Electric hot water
- Interior features: Ceiling fans; Traditional floor plan; Pantry; Stove - pellet; Wood floors; Entry-level bedroom; Living room; Dining room; Den; Mud room
- Laundry & utility: Washer; Dryer; Exhaust fan
Neighborhood map
What this means for you Summary
Snapshot
- This is a 2-bed/1.0-bath single-family listed at $285k.
Deal economics
- At list price, monthly cash flow is $-181 ($-2k/yr) — negative.
- To cash-flow at today's rent, offer at most $253k (11.2% below list).
- To meet the 1% rule (rent ≥ 1% of price), the offer needs to be $205k (28.0% below list).
- Recommended offer: $205k (28.0% below list) — sets the bar for 1% rule.
- Cap rate 5.5% vs local median 3.1% in Hampstead — top-decile yield for the area; either an underpriced asset or a hidden risk that comps aren't pricing in. Stress-test before assuming the spread holds.
Location & tenants
- Location reads 72/100 on livability (#137 in MD) — a middle-class / working-renter tenant base. Strengths: housing A+, crime A, schools B+; Watch: amenities F, commute F.
- Carroll County Public Schools (suburban): math 32% / reading 47% proficiency, ranked #2 of 24 in MD (top 8%) — families likely to look elsewhere, expect single-tenant / working-renter base with shorter leases; only 16% free/reduced lunch — higher-income household profile.
- Market conditions: 82 active listings in the ZIP; 2 comparable units currently listed for rent nearby; 156 units permitted in Carroll County in 2024 (12 in 5+ unit buildings).
Forward outlook
- Local home prices are declining (-3.0%/yr); year-one equity from $2k of loan paydown is wiped out by about $9k of value loss. Plan a longer hold.
- Carroll County population projected to shrink 7% by 2050 — rents likely to lag national; underwrite the cash flow, not the appreciation.
Negotiation context
- Only 5 days on market — expect competitive offers; lowballing is unlikely to land.
- Current owner paid $138k; list at $285k implies a 107% gain — meaningful room to come down on a strong offer.
Risks & watch-outs
- Watch-outs: built in 1954 — expect roof / HVAC / electrical / plumbing capex.
- Climate carrying-cost: extreme-heat days projected 7→15/yr by 2055 (HVAC capex compounding) — expect insurance premiums to compound above CPI over the hold.
Questions for the listing agent
- What do current leases actually rent for vs. the listed asking? Can we see a recent rent roll and the last 12 months of T-12 income?
- Built in 1954 — when were the roof, HVAC, electrical panel, plumbing, and water heater last replaced?
- Is there a deadline driving the sale (1031 exchange, divorce, estate, relocation)? That informs how much negotiation room exists.
- Schools are B-rated — typically a magnet for longer-tenancy family renters. What's the average tenant stay here, and is there a school-zone premium baked into asking?
- The area grade is low — what's the realistic commute time and amenity access for the typical tenant pool here? Any planned neighborhood developments (good or bad) we should know about?
- What's the average days-on-market for RENTAL listings here right now (not sales)? A rising rental-DOM trend means longer vacancies and softer asking-rent achievability than the comps imply.
- What's the recent tenant-quality profile in this submarket — average credit score on applications, eviction rate, late-payment / NSF rate, and stable-employment percentage? A property-management company in the area should have these aggregated.
- How much new for-sale + rental construction is in the pipeline within 1–3 miles? Heavy new supply typically softens prices + rents 12–24 months out; constrained supply supports both.
Investment metrics
- 1% rule
- 0.72% ✗
- Cap rate
- 5.53%
- Cash-on-cash
- -2.73%
- DSCR
- 0.88
- GRM
- 11.6
CMA / ARV
- ARV (median comp)
- $329,886
- List price
- $285,000
- Delta
- -13.61%
- Verdict
- UNDERPRICED
- Comps
- 20 within 1.0 mi
Show comp detail 7 sales within ~0.75 mi
| Address | Dist | Beds/Ba | Sqft | Sold | Price | $/sf | Match |
|---|---|---|---|---|---|---|---|
| 4202 Black Rock Rd | 0.04mi | 2/1.0 | 1,008 (-8%) | 2mo | $280,000 | $278 | 84 |
| 1402 Burnside Dr | 0.53mi | 2/1.0 | 1,076 (-2%) | 1mo | $300,000 | $279 | 72 |
| 913 Clearview Ave | 0.21mi | 2/2.0 | 1,076 (-2%) | 17mo | $339,900 | $316 | 70 |
| 1335 West St | 0.52mi | 2/1.0 | 1,080 (-1%) | 10mo | $188,475 | $175 | 66 |
| 4333 Sycamore Dr | 0.36mi | 3/1.5 (+1) | 1,078 (-1%) | 14mo | $329,000 | $305 | 62 |
| 1315 Hillcrest St | 0.42mi | 3/1.0 (+1) | 1,000 (-8%) | 9mo | $339,000 | $339 | 54 |
| 1003 Terrace Ct | 0.53mi | 3/2.0 (+1) | 1,168 (+7%) | 15mo | $380,000 | $325 | 42 |
Match score weights: distance 35% · size 25% · config 20% · recency 20%. Top-matched comps best support the ARV.
Projected returns pro-forma
-3.0% appreciation · 3.0% rent growth · sell at horizon
- IRR
- -20.9%
- Equity multiple
- 0.28×
- Total profit
- $-57,810
- Equity at exit
- $42,494
- IRR
- -14.3%
- Equity multiple
- 0.18×
- Total profit
- $-65,510
- Equity at exit
- $24,642
Cash invested: $79,800 (down + closing). Projections, not guarantees.
Landlord ↔ Tenant lean methodology
- Overall (STATE)
- 27 Tenant-Leaning
- State Maryland
- 27 Tenant-Leaning · D+14
- County
- — inherits STATE
- City
- — inherits STATE
ZIP-level market 21074
- Active inventory
- 82
- Price-to-rent
- 11.6×
Monthly cashflow live
- Estimated rent
- $2,053 medium interval (Pro) →
- Mortgage (P&I)
- −$1,495
- Tax from tax record
- −$190 /mo · $2,283/yr
- Insurance
- −$119
- HOA
- −$0
- Vacancy / Maint / Mgmt
- −$431
- Net cashflow
- $-181
Break-even live
UW: 25.0% down · 7.5% · 30yr · 1.5% tax · 5.0% vac · 8.0% maint · 8.0% mgmt
Financing live
Cash to close
- Down payment
- $71,250
- Closing costs
- $8,550
- Reserves months
- —
- Total cash needed
- —
Loan-product check · same deal, 3 products live
Conventional
25% down · 7.5% · 30yr
- Down + closing
- —
- Monthly P&I
- —
- Monthly cashflow
- —
- DSCR
- —
- Eligible?
- —
Personal DTI + credit; lowest rate.
DSCR
20% down · 8.5% · 30yr
- Down + closing
- —
- Monthly P&I
- —
- Monthly cashflow
- —
- DSCR
- —
- Eligible?
- —
No personal income docs; deal must DSCR.
Hard money
10% down · 12.0% · 12mo
- Down + closing
- —
- Monthly P&I
- —
- Monthly cashflow
- —
- DSCR
- —
- Eligible?
- —
Short-term bridge; refi at stabilization.
Rent comps 2 comps
| Address | Beds | Baths | Sqft | Rent | $/sqft | DOM | Units | Dist |
|---|---|---|---|---|---|---|---|---|
| 890 Gaming Sq Hampstead, MD | 3.0 | 1.5 | 1232 | $2,100 | $1.70 | 16d | 1 | 0.62mi |
| 3820 Normandy Dr Unit 3A Hampstead, MD | 2.0 | 2.0 | 1000 | $2,000 | $2.00 | 2d | 1 | 0.73mi |
Listing history 5 events
-
2026-05-15$285,000 Active 937-char remark
-
2026-04-27historical $285,000 937-char remark
-
2003-12-29soldstatus $137,500
-
1995-08-01soldstatus $93,000
-
1995-03-03soldstatus $83,300
ⓘ Source: listings_history table (triggers on properties + properties_extension) + one-shot
backfill from property_details.listing_events for pre-trigger history.
Tax reassessment forecast MD · Partial reset (capped growth)
- Current annual tax
- $2,283 · $190/mo
- Projected year-2 tax
- $2,695 · $225/mo
- Expected delta
- +$412/yr (+$34/mo · 18.0%)
ⓘ Screening estimate from a state-policy table — verify with the county assessor before closing.
Climate risk First Street
- Flood 1/10 Low FEMA zone X (unshaded) · 0% chance over 30 yrs
- Wildfire 3/10 Moderate
- Heat 5/10 Major 7 d/yr ≥101°F today · 15 d/yr by 30 yrs out
- Wind 4/10 Moderate 13% chance of damaging wind over 30 yrs
- Air quality 3/10 Moderate 2 unhealthy d/yr today · 4 by 30 yrs out
Nearby sold comps map
Loading sold comps map…
Walkable amenities ~0.75 mi
Loading nearby amenities…
Taxation est. · year 1
- Rental income
- $24,640
- − Mortgage interest
- −$15,964
- − Property taxes
- −$2,283
- − Insurance
- −$1,425
- − Repairs & maintenance
- −$1,971
- − Management
- −$1,971
- − Depreciation
- −$8,291
- Taxable loss
- −$7,266
- Est. tax savings @ 24.0%
- +$1,744
- After-tax cash flow
- $-434/yr
For passive investors: Depreciation is non-cash, so a rental often shows a tax loss while cash-flowing — sheltering income. Rental losses are passive: they offset passive income freely, and up to $25,000/yr can offset ordinary (W-2) income if you actively participate and your MAGI is under $100k (phasing out to $0 by $150k); unused losses carry forward. On sale, claimed depreciation is recaptured at up to 25%, and gains may owe capital-gains tax (a 1031 exchange can defer both). Figures are a year-1 estimate at your 24.0% rate — not tax advice; consult a CPA.
Schools (NCES district)
- District
- Carroll County Public Schools
- NCES district ID
- 2400210
- Math proficiency
- 32% ▼ -25.00%
- Reading proficiency
- 47% ▼ -16.00%
- Median HH income
- $84,594
- Composite
- 37.33/100
- National rank
- #4441
- State rank
- #2 of 24 in MD
Livability — Hampstead
- Score
- 72/100
- State rank
- #137
- US rank
- #5869
Category grades
Schools grade is shown separately in the Schools card above.
Census & demographics
- Population (ZIP)
- 15,070
Population outlook (Carroll County) Hauer SSP2
- Today (2025)
- 169,677 people
- By 2030
- 169,605 · +-0.0%
- By 2040
- 166,205 · -2.0%
- By 2050
- 158,312 · -6.7%
- By 2075
- 143,013 · -15.7%
- By 2100
- 122,431 · -27.8%
Race, ethnicity, and origin ACS 2023
- Neighborhood character
- Predominantly White (87%)
- Race & ethnicity
- White 87% Black 5% Two or more races 3% Hispanic / Latino 2% Asian 2%
- Common ancestry
- Romanian 6% Lithuanian 1% Italian 1%
- Foreign-born
- 2% · Canada, South Korea
- Languages at home
- 97% English-only · Spanish 1%
Political lean MEDSL · Carroll
- 2024 margin
- Strong R (+24.9) · D 36.2% · R 61.2% · Other 2.6%
- 2008→2024 swing
- +6.2pp toward D · 2008: -31.2pp · 2024: -24.9pp
- All cycles
- 2024: R+24.9 2020: R+23.7 2016: R+36.9 2012: R+34.0 2008: R+31.2
Not yet ingested
- Civics
- —
Market trends
- HPI YoY
- ▼ -226.99%
- Current HPI
- 274.0553
- Rent YoY
- —
- Metro
- —
- State GDP YoY
- ▲ 2.97%
- F500 in state
- 12
Industry mix (Fortune 500 HQ in MD)
| Industry | F500 HQs | Revenue |
|---|---|---|
| Aerospace / Defense | 1 | $71B |
|
||
| Utilities | 1 | $25B |
|
||
| Hotels | 1 | $24B |
|
||
| Consumer Goods | 1 | $7B |
|
||
| Real Estate | 1 | $6B |
|
||
| Chemicals | 1 | $2B |
|
||
Price history
+242.1% since first listed6 events — show timeline
- 2026-05-20 Pending — BRIGHT MLS
- 2026-05-15 Listed $285,000 BRIGHT MLS
- 2026-04-27 Coming Soon $285,000 BRIGHT MLS
- 2003-12-29 Sold (Public Records) $137,500 Public Records
- 1995-08-01 Sold (Public Records) $93,000 Public Records
- 1995-03-03 Sold (Public Records) $83,300 Public Records
Property tax history
+1.9%/yrLatest (2025): $2,283 · +5.2% YoY. Source: county tax records.
Cash-flow waterfall
monthlySold comps — $/sqft
last 12 mo · ≤1 miLoading sold comps…