 Multi-family
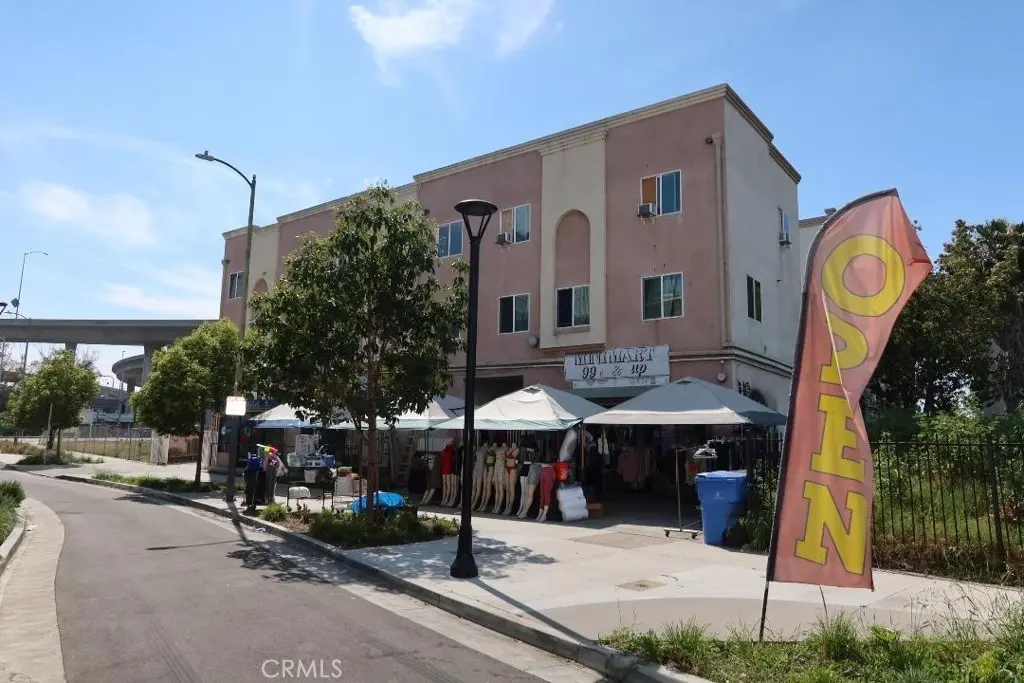
11310 S Olive · Los Angeles, CA
Flood risk No data
- FEMA flood zone
- —
- Chance of flooding over 30 yrs
- —
- Est. flood insurance / yr
- —
Fire risk No data
- Est. fire insurance / yr
- —
Heat risk No data
- Hot days now (above threshold)
- —
- Hot days in 30 yrs
- —
Wind risk No data
- Chance of severe wind over 30 yrs
- —
Air-quality risk No data
- Unhealthy air days now
- —
- Unhealthy air days in 30 yrs
- —
Risk factors via First Street. Map © Google.
Why this score? — see what drove the C grade
The composite is a weighted blend of 9 inputs, each scored 0–100. Each bar is that input's sub-score; the figure is the points it added to the 100-point composite (weight × sub-score).
- Cash flow +22.6/30.0
- ARV discount +7.5/15.0
- DSCR +7.3/10.0
- 1% rule +5.9/10.0
- Schools +3.6/10.0
- Livability +3.4/5.0
- Rent growth +2.5/5.0
- Condition / age +2.2/5.0
- Appreciation +0.0/10.0
$3,200,000
🖨 Deal sheet 📄 Offer letter ✓ Due diligence
Multi-family units
County records classify this as Multi-Family (5+ Unit). Listing-text estimate: 1 unit. estimate disagrees with records
5+ unit building — per-unit beds/baths from public records are typically unavailable; the breakdown below (if shown) is an estimate from the listing text.
Listing remarks
11310 S Olive St built in 2016 with a total of 14 units, described as follows, Three retail spaces, One unit of one bedroom/one bathroom, three units of three bedrooms/two bathrooms, five units of four bedrooms/two bathrooms and two units of 2 bedrooms/one bathroom (New ADU's ready for new owner to be rented) Excellent operating income and great opportunity to add units to current portfolio or to start investing. Please call Agent for more specific details. Please don't disturb tenants. (property includes two brand new ADU's)
Key facts
- Three retail spaces
- Two brand new adus
- 0.27 acre lot
Tags
Property features AI
Finance
- Other: 0–1 unit per acre lot characteristic
- Financial info: 14 total units; Total building area 11,732; Gross scheduled income $388,800; Gross income $388,800; Net operating income $315,600; Operating expenses $73,200 (includes maintenance $4,800, insurance $6,400, water/sewer $14,400, new taxes $47,600); Actual/total rent reported $32,400; Rent control applies
- HOA & community: Street lighting; Suburban community
Exterior
- Utilities: Public sewer; District/public water; One separate water meter; Fourteen separate gas meters; Fourteen separate electric meters
- Home design: Attached property; 3-story building; Includes 2 accessory dwelling units (ADUs)
- Construction: Built year source: Assessor
- Exterior features: No pool
Interior
- Interior features: Ground-level entry
- Laundry & utility: No on-site laundry
Neighborhood map
What this means for you Summary
Snapshot
- This is a multifamily listed at $3.20M. Condition is rated fair.
Deal economics
- At list price, monthly cash flow is $5k ($66k/yr) — positive.
- The deal already cash-flows at list — no discount required.
- Meets the 1% rule at list price ($35k rent vs $3.20M).
- Recommended offer: $3.15M (1.5% below list) — sets the bar for market timing.
- Cap rate 8.3% vs local median 2.1% in Los Angeles — top-decile yield for the area; either an underpriced asset or a hidden risk that comps aren't pricing in. Stress-test before assuming the spread holds.
Location & tenants
- Location reads 68/100 on livability (#273 in CA) — a middle-class / working-renter tenant base. Strengths: amenities A+, commute A+, employment B; Watch: health & safety C-, schools D+, crime F.
- Los Angeles Unified (urban): math 29% / reading 54% proficiency, ranked #223 of 517 in CA (top 43%) — families likely to look elsewhere, expect single-tenant / working-renter base with shorter leases; 67% free/reduced lunch — lower-income household profile, screen leases tightly.
- Market conditions: 36 active listings in the ZIP; 19,697 units permitted in Los Angeles County in 2024 (9,426 in 5+ unit buildings).
- At $34,921/mo this rent would consume 686% of the median local household income ($61k/yr) (locally 1975% of renters already pay >50% of income on rent) — very limited rent-growth headroom before tenants either downsize or default.
Forward outlook
- Local home prices are declining (-3.0%/yr); year-one equity from $22k of loan paydown is wiped out by about $96k of value loss. Plan a longer hold.
- Los Angeles County population projected at +9% by 2050 — modest demand growth; plan on rents tracking national, not racing it.
Negotiation context
- It's been on market 23 days — a 2% lower offer ($3.15M) is reasonable based on typical stale-listing flexibility.
Questions for the listing agent
- Have any recent inspections been done? Can we get a copy of the seller's disclosures and any deferred-maintenance estimates?
- Is there a deadline driving the sale (1031 exchange, divorce, estate, relocation)? That informs how much negotiation room exists.
- Schools are D-rated, which usually means shorter tenancies and higher turnover. Who's the typical renter profile here, and what's been the actual vacancy rate?
- Crime grade is F in this area — have there been break-ins, vandalism, or insurance claims at this property in the last 3 years? What carrier currently insures it and at what premium?
- What's the average days-on-market for RENTAL listings here right now (not sales)? A rising rental-DOM trend means longer vacancies and softer asking-rent achievability than the comps imply.
- What's the recent tenant-quality profile in this submarket — average credit score on applications, eviction rate, late-payment / NSF rate, and stable-employment percentage? A property-management company in the area should have these aggregated.
- How much new apartment / multifamily construction is in the pipeline within 1–3 miles? Heavy new supply (>2% of stock underway) typically softens rents 12–24 months out; light construction supports rent growth.
Investment metrics
- 1% rule
- 1.09% ✓
- Cap rate
- 8.35%
- Cash-on-cash
- 7.33%
- DSCR
- 1.33
- GRM
- 7.6
CMA / ARV
No comps found within radius.
Projected returns pro-forma
-3.0% appreciation · 3.0% rent growth · sell at horizon
- IRR
- -5.1%
- Equity multiple
- 0.81×
- Total profit
- $-169,425
- Equity at exit
- $477,130
- IRR
- 4.6%
- Equity multiple
- 1.34×
- Total profit
- $303,467
- Equity at exit
- $276,678
Cash invested: $896,000 (down + closing). Projections, not guarantees.
Landlord ↔ Tenant lean methodology
- Overall (CITY)
- 0 Strongly Tenant-Friendly
- State California
- 18 Strongly Tenant-Friendly · D+13
- County
- — inherits STATE
- City Los Angeles
- 0 Strongly Tenant-Friendly · D+22
ZIP-level market 90061
- Active inventory
- 36
- Price-to-rent
- 114.5×
Monthly cashflow live
- Estimated rent
- $34,921 high interval (Pro) →
- Mortgage (P&I)
- −$16,781
- Tax est. 1.5%
- −$4,000 /mo · $48,000/yr
- Insurance
- −$1,333
- HOA
- −$0
- Vacancy / Maint / Mgmt
- −$7,333
- Net cashflow
- $5,473
Break-even live
11-unit breakdown (identical units grouped — click to expand)
| Units | Beds | Baths | Est. rent |
|---|---|---|---|
| 1× unit | 1 | 1 | $2,328 |
| 3× units | 3 | 2 | $9,381 |
| #2 | 3 | 2 | $3,127 |
| #3 | 3 | 2 | $3,127 |
| #4 | 3 | 2 | $3,127 |
| 5× units | 4 | 2 | $17,555 |
| #5 | 4 | 2 | $3,511 |
| #6 | 4 | 2 | $3,511 |
| #7 | 4 | 2 | $3,511 |
| #8 | 4 | 2 | $3,511 |
| #9 | 4 | 2 | $3,511 |
| 2× units | 2 | 1 | $5,658 |
| #10 | 2 | 1 | $2,829 |
| #11 | 2 | 1 | $2,829 |
| Total (11 units) | $34,921 | ||
UW: 25.0% down · 7.5% · 30yr · 1.5% tax · 5.0% vac · 8.0% maint · 8.0% mgmt
Financing live
Cash to close
- Down payment
- $800,000
- Closing costs
- $96,000
- Reserves months
- —
- Total cash needed
- —
Loan-product check · same deal, 3 products live
Conventional
25% down · 7.5% · 30yr
- Down + closing
- —
- Monthly P&I
- —
- Monthly cashflow
- —
- DSCR
- —
- Eligible?
- —
Personal DTI + credit; lowest rate.
DSCR
20% down · 8.5% · 30yr
- Down + closing
- —
- Monthly P&I
- —
- Monthly cashflow
- —
- DSCR
- —
- Eligible?
- —
No personal income docs; deal must DSCR.
Hard money
10% down · 12.0% · 12mo
- Down + closing
- —
- Monthly P&I
- —
- Monthly cashflow
- —
- DSCR
- —
- Eligible?
- —
Short-term bridge; refi at stabilization.
Listing history 14 events
-
2026-06-18days on market $3,200,000 Active 23 DOM
-
2026-06-17days on market $3,200,000 Active 22 DOM
-
2026-06-16days on market $3,200,000 Active 21 DOM
-
2026-06-15days on market $3,200,000 Active 20 DOM
-
2026-06-13days on market $3,200,000 Active 18 DOM
-
2026-06-09days on market $3,200,000 Active 14 DOM
-
2026-06-08days on market $3,200,000 Active 13 DOM
-
2026-06-07days on market $3,200,000 Active 12 DOM
-
2026-06-04days on market $3,200,000 Active 9 DOM
-
2026-06-03days on market $3,200,000 Active 8 DOM
-
2026-06-02days on market $3,200,000 Active 7 DOM
-
2026-06-01days on market $3,200,000 Active 6 DOM
-
2026-05-31days on market $3,200,000 Active 5 DOM
-
2026-05-26$3,200,000 Active
ⓘ Source: listings_history table (triggers on properties + properties_extension) + one-shot
backfill from property_details.listing_events for pre-trigger history.
Nearby sold comps map
Loading sold comps map…
Walkable amenities ~0.75 mi
Loading nearby amenities…
Taxation est. · year 1
- Rental income
- $419,052
- − Mortgage interest
- −$179,250
- − Property taxes
- −$48,000
- − Insurance
- −$16,000
- − Repairs & maintenance
- −$33,524
- − Management
- −$33,524
- − Depreciation
- −$93,091
- Taxable income
- $15,663
- Est. tax owed @ 24.0%
- −$3,759
- After-tax cash flow
- $61,918/yr
For passive investors: Depreciation is non-cash, so a rental often shows a tax loss while cash-flowing — sheltering income. Rental losses are passive: they offset passive income freely, and up to $25,000/yr can offset ordinary (W-2) income if you actively participate and your MAGI is under $100k (phasing out to $0 by $150k); unused losses carry forward. On sale, claimed depreciation is recaptured at up to 25%, and gains may owe capital-gains tax (a 1031 exchange can defer both). Figures are a year-1 estimate at your 24.0% rate — not tax advice; consult a CPA.
Condition & rehab AI · 2 photos
This multi-family property requires moderate renovations, including exterior siding repair, flooring replacement, and painting, to improve its condition and value.
Repairs flagged
- Major exterior siding — Significant wear and tear
- Major flooring — Worn-out carpet
- Major interior walls — Peeling paint
Value-add opportunities
- Both Painting and repainting — Enhances curb appeal and interior aesthetics
- Both Landscaping — Improves curb appeal and enhances property value
- Both Flooring replacement — Enhances interior aesthetics and usability
- Both Exterior siding repair — Restores property's exterior appearance and value
Renovation cost estimate screening
| Repair item | Severity | Est. cost |
|---|---|---|
| exterior siding · Significant wear and tear | Major | $15,000–50,000 |
| flooring · Worn-out carpet | Major | $15,000–50,000 |
| interior walls · Peeling paint | Major | $15,000–50,000 |
| Total estimated repair cost · 3 items | $45,000–150,000 |
Value-add ROI direction
- Both Painting and repainting — Enhances curb appeal and interior aesthetics ↑
- Both Landscaping — Improves curb appeal and enhances property value ↑
- Both Flooring replacement — Enhances interior aesthetics and usability ↑
- Both Exterior siding repair — Restores property's exterior appearance and value ↑
ⓘ Cost ranges are severity-bucket heuristics (US national rule-of-thumb). Get contractor quotes + a written scope before underwriting a rehab budget.
Schools (NCES district)
- District
- Los Angeles Unified
- NCES district ID
- 0622710
- Math proficiency
- 29% ▼ -4.00%
- Reading proficiency
- 54% ▲ 10.00%
- Median HH income
- $50,403
- Composite
- 35.67/100
- National rank
- #4875
- State rank
- #223 of 517 in CA
Livability — Los Angeles
- Score
- 68/100
- State rank
- #273
- US rank
- #9237
Category grades
Schools grade is shown separately in the Schools card above.
Census & demographics
- Census place
- Los Angeles, CA
- County
- Los Angeles County · 9,444,647 people
- City population
- 3,838,149
- Metro
- Los Angeles-Long Beach-Anaheim, CA
- Population (ZIP)
- 30,051
- Household income
- $61,046
- Rent vs Own
- Severe rent burden
- 1975.0
Population outlook (Los Angeles County) Hauer SSP2
- Today (2025)
- 10,940,515 people
- By 2030
- 11,256,481 · +2.9%
- By 2040
- 11,729,929 · +7.2%
- By 2050
- 11,948,407 · +9.2%
- By 2075
- 11,818,114 · +8.0%
- By 2100
- 10,842,928 · -0.9%
Race, ethnicity, and origin ACS 2023
- Neighborhood character
- Predominantly Hispanic (70%)
- Race & ethnicity
- Hispanic / Latino 70% Black 26% Two or more races 22% Native American 3% White 2%
- Hispanic origin (detail)
- Mexican 51%
- Common ancestry
- British 1%
- Foreign-born
- 32% · Canada, Jamaica
- Languages at home
- 38% English-only · Spanish 61%
Political lean MEDSL · Los Angeles
- 2024 margin
- Solid D (+32.9) · D 64.8% · R 31.9% · Other 3.3%
- 2008→2024 swing
- -7.4pp toward R · 2008: 40.4pp · 2024: 32.9pp
- All cycles
- 2024: D+32.9 2020: D+44.2 2016: D+48.0 2012: D+40.0 2008: D+40.4
Not yet ingested
- Civics
- —
Market trends
- HPI YoY
- ▼ -528.07%
- Current HPI
- 502.9923
- Rent YoY
- —
- Metro
- Los Angeles-Long Beach-Anaheim, CA
- State GDP YoY
- ▲ 3.21%
- F500 in state
- 116
Industry mix (Fortune 500 HQ in CA)
| Industry | F500 HQs | Revenue |
|---|---|---|
| Technology | 27 | $1,492B |
|
||
| Financial Services | 3 | $174B |
|
||
| Retail | 3 | $44B |
|
||
| Insurance | 3 | $26B |
|
||
| Media / Entertainment | 2 | $115B |
|
||
| Pharmaceuticals / Biotech | 2 | $62B |
|
||
Price history
1 event — show timeline
- 2026-05-26 Listed $3,200,000 CRMLS
Cash-flow waterfall
monthlySold comps — $/sqft
last 12 mo · ≤1 miLoading sold comps…