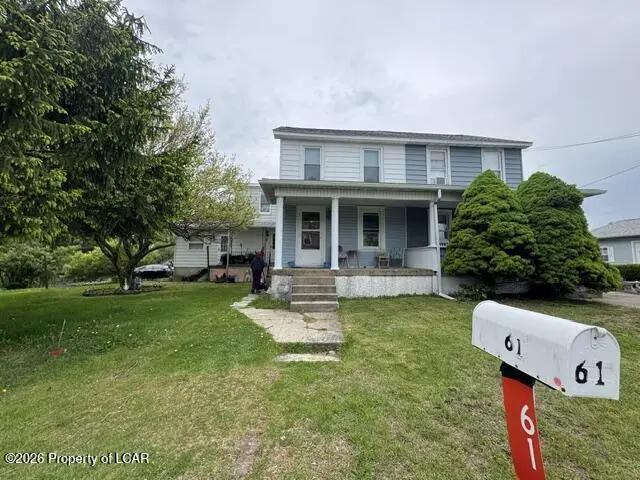
61 Front St · West Hazleton, PA
Flood risk 1/10 · Minimal
- FEMA flood zone
- X (unshaded)
- Chance of flooding over 30 yrs
- 0.0%
- Est. flood insurance / yr
- $507 – $1,088
Fire risk 2/10 · Minimal
- Est. fire insurance / yr
- $511 – $949
Heat risk 2/10 · Minimal
- Hot days now (above 91°F)
- 7 days/yr
- Hot days in 30 yrs
- 15 days/yr
Wind risk 3/10 · Minor
- Chance of severe wind over 30 yrs
- 6.0%
Air-quality risk 2/10 · Minimal
- Unhealthy air days now
- 0 days/yr
- Unhealthy air days in 30 yrs
- 1 days/yr
Risk factors via First Street. Map © Google.
Why this score? — see what drove the B+ grade
The composite is a weighted blend of 9 inputs, each scored 0–100. Each bar is that input's sub-score; the figure is the points it added to the 100-point composite (weight × sub-score).
- Cash flow +30.0/30.0
- 1% rule +10.0/10.0
- DSCR +10.0/10.0
- Appreciation +10.0/10.0
- ARV discount +7.5/15.0
- Livability +3.3/5.0
- Rent growth +2.5/5.0
- Condition / age +2.5/5.0
- Schools +2.0/10.0
$80,000
🖨 Deal sheet 📄 Offer letter ✓ Due diligence
Listing remarks
Located in the heart of Hazle Township, 61 Front St offers incredible potential for homeowners and investors alike. This well-maintained property features spacious living areas, 2-3 generously sized bedrooms, and a functi-onal layout designed for comfortable everyday living.
Key facts
- 0.51 acre lot
- Garage
- Listed 35 days
Property features AI
Exterior
- Parking: Detached 1-car garage
- Utilities: Public water; Public sewer
- Home design: Single-family residence; Two levels
- Construction: Vinyl siding
- Exterior features: Public water; Public sewer; Lot zoned residential; 0.51-acre lot
Interior
- Kitchen: Eat-in kitchen
- Bathrooms: 1 full bathroom
- Heating & cooling: Oil heating; Radiant heat
- Interior features: Eat-in kitchen; Full unfinished basement
Neighborhood map
What this means for you Summary
Snapshot
- This is a 2-bed/1.0-bath single-family listed at $80k.
Deal economics
- At list price, monthly cash flow is $743 ($9k/yr) — positive.
- The deal already cash-flows at list — no discount required.
- Meets the 1% rule at list price ($2k rent vs $80k).
- Recommended offer: $78k (3.0% below list) — sets the bar for market timing.
- Cap rate 17.4% vs local median 5.6% in West Hazleton — top-decile yield for the area; either an underpriced asset or a hidden risk that comps aren't pricing in. Stress-test before assuming the spread holds.
Location & tenants
- Location reads 66/100 on livability (#1,036 in PA) — a middle-class / working-renter tenant base. Strengths: cost of living A+, housing A+, health & safety A-; Watch: schools F, amenities F, commute F.
- Hazleton Area SD (suburban): math 18% / reading 30% proficiency, ranked #476 of 539 in PA (top 88%) — low school quality limits family demand, transient renter base, plan for 1-2y turnover.
- Market conditions: 270 active listings in the ZIP; 349 units permitted in Luzerne County in 2024 (16 in 5+ unit buildings).
- This rent runs 36% of the median local income ($55k/yr) — at the standard rent-burdened threshold; future hikes will face affordability resistance.
Forward outlook
- In year one you build about $9k of equity ($553 loan paydown + $8k appreciation (10.0% local appreciation)).
- Luzerne County population projected at +4% by 2050 — modest demand growth; plan on rents tracking national, not racing it.
- At projected returns (10.0% appreciation + 3.0% rent growth), your $22k cash investment doubles in ~2 years — after that, you're playing with house money.
- By year 4, paydown + projected appreciation supports a ~$30k cash-out refi (75% LTV) — recoverable capital for the next deal without selling this one.
Negotiation context
- It's been on market 36 days — a 3% lower offer ($78k) is reasonable based on typical stale-listing flexibility.
Risks & watch-outs
- Watch-outs: built in 1890 — expect roof / HVAC / electrical / plumbing capex.
Questions for the listing agent
- It's been on market 36 days. Have you received any prior offers? Is the seller open to a 3% concession, seller financing, or rate buy-down credit?
- Built in 1890 — when were the roof, HVAC, electrical panel, plumbing, and water heater last replaced?
- Is there a deadline driving the sale (1031 exchange, divorce, estate, relocation)? That informs how much negotiation room exists.
- Schools are F-rated, which usually means shorter tenancies and higher turnover. Who's the typical renter profile here, and what's been the actual vacancy rate?
- What's the average days-on-market for RENTAL listings here right now (not sales)? A rising rental-DOM trend means longer vacancies and softer asking-rent achievability than the comps imply.
- What's the recent tenant-quality profile in this submarket — average credit score on applications, eviction rate, late-payment / NSF rate, and stable-employment percentage? A property-management company in the area should have these aggregated.
- How much new for-sale + rental construction is in the pipeline within 1–3 miles? Heavy new supply typically softens prices + rents 12–24 months out; constrained supply supports both.
Investment metrics
- 1% rule
- 2.06% ✓
- Cap rate
- 17.44%
- Cash-on-cash
- 39.80%
- DSCR
- 2.77
- GRM
- 4.0
CMA / ARV
- ARV (median comp)
- $210,163
- List price
- $80,000
- Delta
- -61.93%
- Verdict
- UNDERPRICED
- Comps
- 2 within 1.0 mi
Show comp detail 1 sale within ~0.75 mi
| Address | Dist | Beds/Ba | Sqft | Sold | Price | $/sf | Match |
|---|---|---|---|---|---|---|---|
| 30 Front St | 0.19mi | 3/1.5 (+1) | 1,320 (-8%) | 23mo | $172,000 | $130 | 51 |
Match score weights: distance 35% · size 25% · config 20% · recency 20%. Top-matched comps best support the ARV.
Projected returns pro-forma
10.0% appreciation · 3.0% rent growth · sell at horizon
- IRR
- 55.1%
- Equity multiple
- 5.06×
- Total profit
- $90,917
- Equity at exit
- $72,070
- IRR
- 48.6%
- Equity multiple
- 11.29×
- Total profit
- $230,584
- Equity at exit
- $155,422
Cash invested: $22,400 (down + closing). Projections, not guarantees.
Landlord ↔ Tenant lean methodology
- Overall (STATE)
- 62 Landlord-Friendly
- State Pennsylvania
- 62 Landlord-Friendly · EVEN
- County
- — inherits STATE
- City
- — inherits STATE
ZIP-level market 18202
- Home prices YoY
- 7.1%
- Active inventory
- 270
- Price-to-rent
- 4.0×
Monthly cashflow live
- Estimated rent
- $1,649 medium interval (Pro) →
- Mortgage (P&I)
- −$420
- Tax from tax record
- −$107 /mo · $1,282/yr
- Insurance
- −$33
- HOA
- −$0
- Vacancy / Maint / Mgmt
- −$346
- Net cashflow
- $743
Break-even live
UW: 25.0% down · 7.5% · 30yr · 1.5% tax · 5.0% vac · 8.0% maint · 8.0% mgmt
Financing live
Cash to close
- Down payment
- $20,000
- Closing costs
- $2,400
- Reserves months
- —
- Total cash needed
- —
Loan-product check · same deal, 3 products live
Conventional
25% down · 7.5% · 30yr
- Down + closing
- —
- Monthly P&I
- —
- Monthly cashflow
- —
- DSCR
- —
- Eligible?
- —
Personal DTI + credit; lowest rate.
DSCR
20% down · 8.5% · 30yr
- Down + closing
- —
- Monthly P&I
- —
- Monthly cashflow
- —
- DSCR
- —
- Eligible?
- —
No personal income docs; deal must DSCR.
Hard money
10% down · 12.0% · 12mo
- Down + closing
- —
- Monthly P&I
- —
- Monthly cashflow
- —
- DSCR
- —
- Eligible?
- —
Short-term bridge; refi at stabilization.
Listing history 15 events
-
2026-06-19days on market $80,000 Active 36 DOM
-
2026-06-18days on market $80,000 Active 35 DOM
-
2026-06-17days on market $80,000 Active 34 DOM
-
2026-06-16days on market $80,000 Active 33 DOM
-
2026-06-15days on market $80,000 Active 32 DOM
-
2026-06-14days on market $80,000 Active 30 DOM
-
2026-06-12days on market $80,000 Active 29 DOM
-
2026-06-09days on market $80,000 Active 26 DOM
-
2026-06-08days on market $80,000 Active 25 DOM
-
2026-06-07days on market $80,000 Active 24 DOM
-
2026-06-02days on market $80,000 Active 19 DOM
-
2026-06-01days on market $80,000 Active 18 DOM
-
2026-05-31days on market $80,000 Active 17 DOM
-
2026-05-30days on market $80,000 Active 16 DOM
-
2026-05-12$80,000 Active 275-char remark
ⓘ Source: listings_history table (triggers on properties + properties_extension) + one-shot
backfill from property_details.listing_events for pre-trigger history.
Tax reassessment forecast PA · Partial reset (capped growth)
- Current annual tax
- $1,282 · $107/mo
- Projected year-2 tax
- $1,282 · $107/mo
- Expected delta
- $0/yr ($0/mo · 0.0%)
ⓘ Screening estimate from a state-policy table — verify with the county assessor before closing.
Climate risk First Street
- Flood 1/10 Low FEMA zone X (unshaded) · 0% chance over 30 yrs
- Wildfire 2/10 Low
- Heat 2/10 Low 7 d/yr ≥91°F today · 15 d/yr by 30 yrs out
- Wind 3/10 Moderate 6% chance of damaging wind over 30 yrs
- Air quality 2/10 Low 0 unhealthy d/yr today · 1 by 30 yrs out
Nearby sold comps map
Loading sold comps map…
Walkable amenities ~0.75 mi
Loading nearby amenities…
Taxation est. · year 1
- Rental income
- $19,786
- − Mortgage interest
- −$4,481
- − Property taxes
- −$1,282
- − Insurance
- −$400
- − Repairs & maintenance
- −$1,583
- − Management
- −$1,583
- − Depreciation
- −$2,327
- Taxable income
- $8,130
- Est. tax owed @ 24.0%
- −$1,951
- After-tax cash flow
- $6,964/yr
For passive investors: Depreciation is non-cash, so a rental often shows a tax loss while cash-flowing — sheltering income. Rental losses are passive: they offset passive income freely, and up to $25,000/yr can offset ordinary (W-2) income if you actively participate and your MAGI is under $100k (phasing out to $0 by $150k); unused losses carry forward. On sale, claimed depreciation is recaptured at up to 25%, and gains may owe capital-gains tax (a 1031 exchange can defer both). Figures are a year-1 estimate at your 24.0% rate — not tax advice; consult a CPA.
Schools (NCES district)
- District
- Hazleton Area SD
- NCES district ID
- 4211700
- Math proficiency
- 18% ▼ -3.00%
- Reading proficiency
- 30% ▼ -15.00%
- Median HH income
- $42,247
- Composite
- 20.44/100
- National rank
- #8582
- State rank
- #476 of 539 in PA
Livability — West Hazleton
- Score
- 66/100
- State rank
- #1036
- US rank
- #11561
Category grades
Schools grade is shown separately in the Schools card above.
Census & demographics
- County
- Luzerne County · 118,885 people
- Metro
- Scranton--Wilkes-Barre, PA
- Population (ZIP)
- 13,755
- Household income
- $55,153
- Rent vs Own
- Severe rent burden
- 369.0
Population outlook (Luzerne County) Hauer SSP2
- Today (2025)
- 319,505 people
- By 2030
- 319,943 · +0.1%
- By 2040
- 322,643 · +1.0%
- By 2050
- 330,817 · +3.5%
- By 2075
- 379,145 · +18.7%
- By 2100
- 431,908 · +35.2%
Race, ethnicity, and origin ACS 2023
- Neighborhood character
- Majority White (61%)
- Race & ethnicity
- White 61% Hispanic / Latino 33% Two or more races 9% Black 1% Pacific Islander 1%
- Hispanic origin (detail)
- Mexican 2% Puerto Rican 3% Dominican 22%
- Common ancestry
- Romanian 13% Iranian 1% Lithuanian 1%
- Foreign-born
- 18% · Canada, Jamaica
- Languages at home
- 71% English-only · Spanish 26% Russian/Polish/Slavic 1% Other Indo-European 1%
Political lean MEDSL · Luzerne
- 2024 margin
- R (+19.2) · D 40.0% · R 59.2%
- 2008→2024 swing
- -27.6pp toward R · 2008: 8.4pp · 2024: -19.2pp
- All cycles
- 2024: R+19.2 2020: R+14.4 2016: R+19.6 2012: D+4.8 2008: D+8.4
Not yet ingested
- Civics
- —
Market trends
- HPI YoY
- ▲ 20.19%
- Current HPI
- 306.1029
- Rent YoY
- —
- Metro
- Scranton--Wilkes-Barre, PA
- State GDP YoY
- ▲ 1.68%
- F500 in state
- 34
Industry mix (Fortune 500 HQ in PA)
| Industry | F500 HQs | Revenue |
|---|---|---|
| Healthcare | 2 | $309B |
|
||
| Insurance | 2 | $27B |
|
||
| Telecommunications / Media | 1 | $124B |
|
||
| Industrial Distribution | 1 | $22B |
|
||
| Financial Services | 1 | $20B |
|
||
| Chemicals / Materials | 1 | $18B |
|
||
Price history
1 event — show timeline
- 2026-05-12 Listed $80,000 LCAR
Property tax history
+2.6%/yrLatest (2026): $1,282 · +4.6% YoY. Source: county tax records.
Cash-flow waterfall
monthlySold comps — $/sqft
last 12 mo · ≤1 miLoading sold comps…