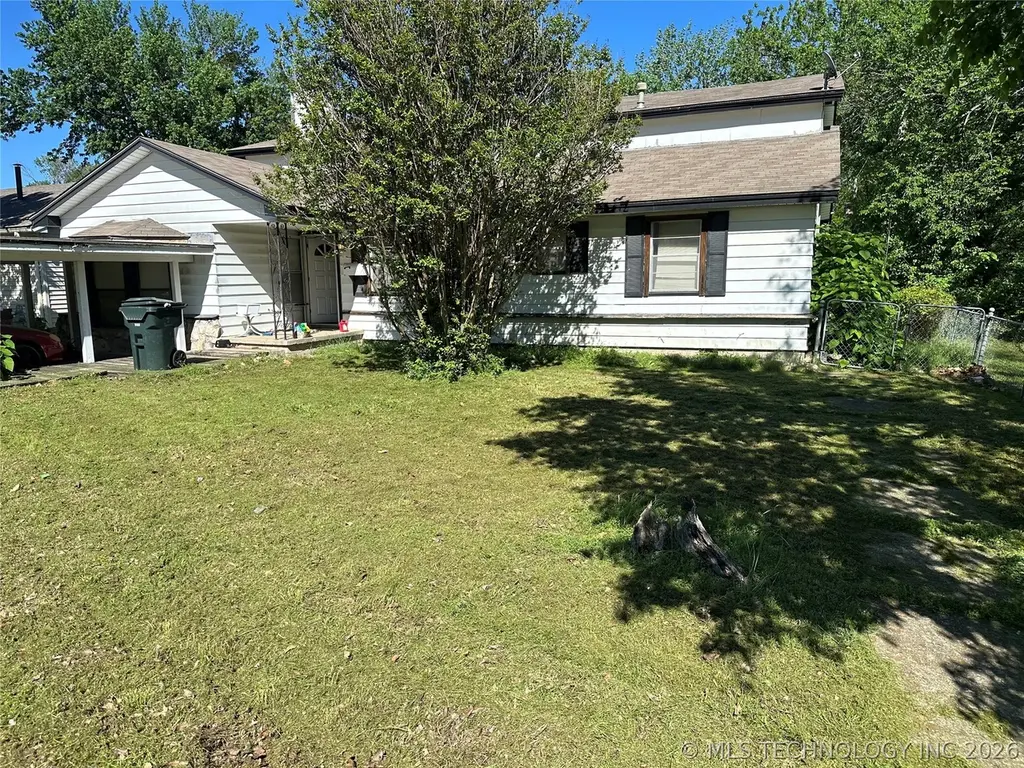
202 N Moore St · Claremore, OK
Flood risk 1/10 · Minimal
- FEMA flood zone
- X (unshaded)
- Chance of flooding over 30 yrs
- 0.0%
- Est. flood insurance / yr
- $507 – $1,088
Fire risk 4/10 · Minor
- Est. fire insurance / yr
- $2,463 – $4,575
Heat risk 7/10 · Major
- Hot days now (above 110°F)
- 7 days/yr
- Hot days in 30 yrs
- 19 days/yr
Wind risk 2/10 · Minimal
- Chance of severe wind over 30 yrs
- 2.0%
Air-quality risk 2/10 · Minimal
- Unhealthy air days now
- 1 days/yr
- Unhealthy air days in 30 yrs
- 1 days/yr
Risk factors via First Street. Map © Google.
Why this score? — see what drove the B- grade
The composite is a weighted blend of 9 inputs, each scored 0–100. Each bar is that input's sub-score; the figure is the points it added to the 100-point composite (weight × sub-score).
- Cash flow +30.0/30.0
- 1% rule +10.0/10.0
- DSCR +10.0/10.0
- ARV discount +7.5/15.0
- Livability +3.7/5.0
- Rent growth +3.2/5.0
- Condition / age +2.5/5.0
- Schools +2.1/10.0
- Appreciation +0.0/10.0
$70,000
🖨 Deal sheet (PDF) 📄 Offer letter ✓ Due diligence
Listing remarks MLS
Tons of square footage for the price! Convenient location to everything in town. In-law plan, extra kitchen and living area! Plus A 1 bd, 1 bath apartment separate from house.
Key facts
- Investment property
- Prime location
- 0.26 acre lot
Tags
Property features AI
Finance
- Other: Tax information available (not included per instructions)
Exterior
- Parking: 1-car garage; Carport
- Security: No safety shelter
- Utilities: Electricity available; Natural gas available; Phone available; Public water; Public sewer
- Home design: 2-story; Faces west; Crawlspace foundation
- Construction: Wood siding; Wood frame construction; Asphalt/fiberglass roof
- Exterior features: Storage structure on property; Chain link fencing; Mature trees on lot; No additional exterior features listed
Interior
- Kitchen: Oven; Range; No hot water (reported)
- Flooring: Carpet; Wood
- Bathrooms: 2 full bathrooms
- Heating & cooling: Gas heating
- Interior features: Laminate counters; Aluminum window frames; No additional interior features listed
- Laundry & utility: Electric dryer hookup
Neighborhood map
What this means for you Summary
Snapshot
- This is a 3-bed/2.0-bath single-family listed at $70k.
Deal economics
- At list price, monthly cash flow is $877 ($11k/yr) — positive.
- The deal already cash-flows at list — no discount required.
- Meets the 1% rule at list price ($2k rent vs $70k).
- Cap rate 21.3% vs local median 4.1% in Claremore — top-decile yield for the area; either an underpriced asset or a hidden risk that comps aren't pricing in. Stress-test before assuming the spread holds.
Location & tenants
- Location reads 73/100 on livability (#20 in OK) — a middle-class / working-renter tenant base. Strengths: cost of living A+, housing A+, health & safety A; Watch: amenities F, commute F, employment D-.
- Claremore (town): math 24% / reading 25% proficiency, ranked #111 of 270 in OK (top 41%) — low school quality limits family demand, transient renter base, plan for 1-2y turnover.
- Zoned schools: Westside Es (math 22% / reading 22%, grade F, #413 of 845 statewide, top 54%, 557 students, 0% FRL); Will Rogers Jhs (math 20% / reading 23%, grade F, #146 of 345 statewide, top 43%, 807 students, 0% FRL); Claremore Hs (math 22% / reading 35%, grade F, #121 of 447 statewide, top 27%, 1,285 students, 0% FRL) — zoned schools average 0% FRL vs 48% district-wide (48 pts lower); this property's tenant base skews higher-income than the district average.
- Market conditions: Rents rising (+2.6%/yr); 184 active listings in the ZIP; 608 units permitted in Rogers County in 2024 (7 in 5+ unit buildings).
- This rent runs 31% of the median local income ($65k/yr) — at the standard rent-burdened threshold; future hikes will face affordability resistance.
Forward outlook
- Local home prices are declining (-3.0%/yr); year-one equity from $484 of loan paydown is wiped out by about $2k of value loss. Plan a longer hold.
- Rogers County population projected at +16% by 2050 — long-run rental-demand tailwind backs the buy-and-hold thesis.
- At projected returns (-3.0% appreciation + 2.6% rent growth), your $20k cash investment doubles in ~3 years — after that, you're playing with house money.
Negotiation context
- Only 5 days on market — expect competitive offers; lowballing is unlikely to land.
- 4 sale attempts since 28y ago with the ask held roughly flat each time — persistent listings suggest the price (not the market) is what's stuck; bring a comps-based counter.
Risks & watch-outs
- Watch-outs: built in 1956 — expect roof / HVAC / electrical / plumbing capex.
- Climate carrying-cost: extreme-heat days projected 7→19/yr by 2055 (HVAC capex compounding) — expect insurance premiums to compound above CPI over the hold.
Questions for the listing agent
- Built in 1956 — when were the roof, HVAC, electrical panel, plumbing, and water heater last replaced?
- Is there a deadline driving the sale (1031 exchange, divorce, estate, relocation)? That informs how much negotiation room exists.
- Schools are D-rated, which usually means shorter tenancies and higher turnover. Who's the typical renter profile here, and what's been the actual vacancy rate?
- What's the average days-on-market for RENTAL listings here right now (not sales)? A rising rental-DOM trend means longer vacancies and softer asking-rent achievability than the comps imply.
- What's the recent tenant-quality profile in this submarket — average credit score on applications, eviction rate, late-payment / NSF rate, and stable-employment percentage? A property-management company in the area should have these aggregated.
- How much new for-sale + rental construction is in the pipeline within 1–3 miles? Heavy new supply typically softens prices + rents 12–24 months out; constrained supply supports both.
Investment metrics
- 1% rule
- 2.40% ✓
- Cap rate
- 21.32%
- Cash-on-cash
- 53.68%
- DSCR
- 3.39
- GRM
- 3.5
CMA / ARV
No comps found within radius.
Projected returns pro-forma
-3.0% appreciation · 2.62% rent growth · sell at horizon
- IRR
- 51.4%
- Equity multiple
- 3.24×
- Total profit
- $43,865
- Equity at exit
- $10,437
- IRR
- 56.6%
- Equity multiple
- 6.49×
- Total profit
- $107,519
- Equity at exit
- $6,052
Cash invested: $19,600 (down + closing). Projections, not guarantees.
Landlord ↔ Tenant lean methodology
- Overall (STATE)
- 83 Strongly Landlord-Friendly
- State Oklahoma
- 83 Strongly Landlord-Friendly · R+20
- County
- — inherits STATE
- City
- — inherits STATE
ZIP-level market 74017
- Home prices YoY
- -20.1%
- Rents YoY
- 2.6%
- Active inventory
- 184
- Price-to-rent
- 3.5×
Monthly cashflow live
- Estimated rent
- $1,682 medium interval (Pro) →
- Mortgage (P&I)
- −$367
- Tax from tax record
- −$56 /mo · $668/yr
- Insurance
- −$29
- HOA
- −$0
- Vacancy / Maint / Mgmt
- −$353
- Net cashflow
- $877
Break-even live
Sensitivity live
| Price | -10% $916 | -5% $897 | +0% $877 | +5% $857 | +10% $837 |
|---|---|---|---|---|---|
| Rent | -10% $744 | -5% $810 | +0% $877 | +5% $943 | +10% $1,010 |
| Rate | -1.0pp $912 | -0.5pp $895 | base $877 | +0.5pp $859 | +1.0pp $840 |
UW: 25.0% down · 7.5% · 30yr · 1.5% tax · 5.0% vac · 8.0% maint · 8.0% mgmt
Financing live
Cash to close
- Down payment
- $17,500
- Closing costs
- $2,100
- Reserves months
- —
- Total cash needed
- —
Loan-product check · same deal, 3 products live
Conventional
25% down · 7.5% · 30yr
- Down + closing
- —
- Monthly P&I
- —
- Monthly cashflow
- —
- DSCR
- —
- Eligible?
- —
Personal DTI + credit; lowest rate.
DSCR
20% down · 8.5% · 30yr
- Down + closing
- —
- Monthly P&I
- —
- Monthly cashflow
- —
- DSCR
- —
- Eligible?
- —
No personal income docs; deal must DSCR.
Hard money
10% down · 12.0% · 12mo
- Down + closing
- —
- Monthly P&I
- —
- Monthly cashflow
- —
- DSCR
- —
- Eligible?
- —
Short-term bridge; refi at stabilization.
Listing history 9 events
-
2026-05-16status Pending
-
2026-05-11$70,000 Active
-
2014-03-06soldstatus $75,000
-
2014-03-05soldstatus 175-char remark
Show marketing remark (175 chars)
Tons of square footage for the price! Convenient location to everything in town. In-law plan, extra kitchen and living area! Plus A 1 bd, 1 bath apartment separate from house.
-
2013-10-17$94,900 175-char remark
Show marketing remark (175 chars)
Tons of square footage for the price! Convenient location to everything in town. In-law plan, extra kitchen and living area! Plus A 1 bd, 1 bath apartment separate from house.
-
2013-10-17historical
Show marketing remark (175 chars)
Tons of square footage for the price! Convenient location to everything in town. In-law plan, extra kitchen and living area! Plus A 1 bd, 1 bath apartment separate from house.
-
2013-04-16$99,900
-
1998-11-06historical
-
1998-06-23$92,500
ⓘ Source: listings_history table (triggers on properties + properties_extension) + one-shot
backfill from property_details.listing_events for pre-trigger history.
Tax reassessment forecast OK · Resets to sale price
- Current annual tax
- $668 · $56/mo
- Projected year-2 tax
- $668 · $56/mo
- Expected delta
- $0/yr ($0/mo · 0.0%)
ⓘ Screening estimate from a state-policy table — verify with the county assessor before closing.
Climate risk First Street
- Flood 1/10 Low FEMA zone X (unshaded) · 0% chance over 30 yrs
- Wildfire 4/10 Moderate
- Heat 7/10 Severe 7 d/yr ≥110°F today · 19 d/yr by 30 yrs out
- Wind 2/10 Low 2% chance of damaging wind over 30 yrs
- Air quality 2/10 Low 1 unhealthy d/yr today · 1 by 30 yrs out
Nearby sold comps map
Loading sold comps map…
Walkable amenities ~0.75 mi
Loading nearby amenities…
Taxation est. · year 1
- Rental income
- $20,183
- − Mortgage interest
- −$3,921
- − Property taxes
- −$668
- − Insurance
- −$350
- − Repairs & maintenance
- −$1,615
- − Management
- −$1,615
- − Depreciation
- −$2,036
- Taxable income
- $9,978
- Est. tax owed @ 24.0%
- −$2,395
- After-tax cash flow
- $8,127/yr
For passive investors: Depreciation is non-cash, so a rental often shows a tax loss while cash-flowing — sheltering income. Rental losses are passive: they offset passive income freely, and up to $25,000/yr can offset ordinary (W-2) income if you actively participate and your MAGI is under $100k (phasing out to $0 by $150k); unused losses carry forward. On sale, claimed depreciation is recaptured at up to 25%, and gains may owe capital-gains tax (a 1031 exchange can defer both). Figures are a year-1 estimate at your 24.0% rate — not tax advice; consult a CPA.
Schools (NCES district)
- District
- Claremore
- NCES district ID
- 4007740
- Math proficiency
- 24% ▼ -12.00%
- Reading proficiency
- 25% ▼ -11.00%
- Median HH income
- $44,946
- Composite
- 21.16/100
- National rank
- #8426
- State rank
- #111 of 270 in OK
Livability — Claremore
- Score
- 73/100
- State rank
- #20
- US rank
- #5616
Category grades
Schools grade is shown separately in the Schools card above.
Census & demographics
- Census place
- Claremore, OK
- County
- Rogers County · 50,229 people
- City population
- 50,229
- Metro
- Tulsa, OK
- Population (ZIP)
- 29,206
- Household income
- $65,368
- Rent vs Own
- Severe rent burden
- 603.0
Population outlook (Rogers County) Hauer SSP2
- Today (2025)
- 100,211 people
- By 2030
- 104,381 · +4.2%
- By 2040
- 111,567 · +11.3%
- By 2050
- 116,791 · +16.5%
- By 2075
- 129,134 · +28.9%
- By 2100
- 132,326 · +32.0%
Race, ethnicity, and origin ACS 2023
- Neighborhood character
- Diverse neighborhood (Simpson 0.55)
- Race & ethnicity
- White 67% Native American 15% Two or more races 12% Hispanic / Latino 7% Black 1%
- Hispanic origin (detail)
- Mexican 5%
- Common ancestry
- Slovak 2% Lithuanian 1% Portuguese 1%
- Foreign-born
- 3% · Canada
- Languages at home
- 94% English-only · Spanish 4%
Political lean MEDSL · Rogers
- 2024 margin
- Solid R (+55.0) · D 21.6% · R 76.6% · Other 1.7%
- 2008→2024 swing
- -10.9pp toward R · 2008: -44.1pp · 2024: -55.0pp
- All cycles
- 2024: R+55.0 2020: R+54.9 2016: R+56.3 2012: R+50.1 2008: R+44.1
Not yet ingested
- Civics
- —
Market trends
- HPI YoY
- ▼ -57.22%
- Current HPI
- 227.0657
- Rent YoY
- ▲ 2.62%
- Metro
- Tulsa, OK
- State GDP YoY
- ▲ 1.55%
- F500 in state
- 6
Industry mix (Fortune 500 HQ in OK)
| Industry | F500 HQs | Revenue |
|---|---|---|
| Energy | 3 | $48B |
|
||
Price history
-24.3% since first listed9 events — show timeline
- 2026-05-16 Pending — MLS Technology, Inc.
- 2026-05-11 Listed $70,000 MLS Technology, Inc.
- 2014-03-06 Sold (Public Records) $75,000 Public Records
- 2014-03-05 Sold (MLS) — MLS Technology, Inc.
- 2013-10-17 Listing Removed — MLS Technology, Inc.
- 2013-10-17 Listed $94,900 MLS Technology, Inc.
- 2013-04-16 Listed $99,900 MLS Technology, Inc.
- 1998-11-06 Listing Removed — MLS Technology, Inc.
- 1998-06-23 Listed $92,500 MLS Technology, Inc.
Property tax history
-3.4%/yrLatest (2025): $668 · +5.0% YoY. Source: county tax records.
Cash-flow waterfall
monthlySold comps — $/sqft
last 12 mo · ≤1 miLoading sold comps…