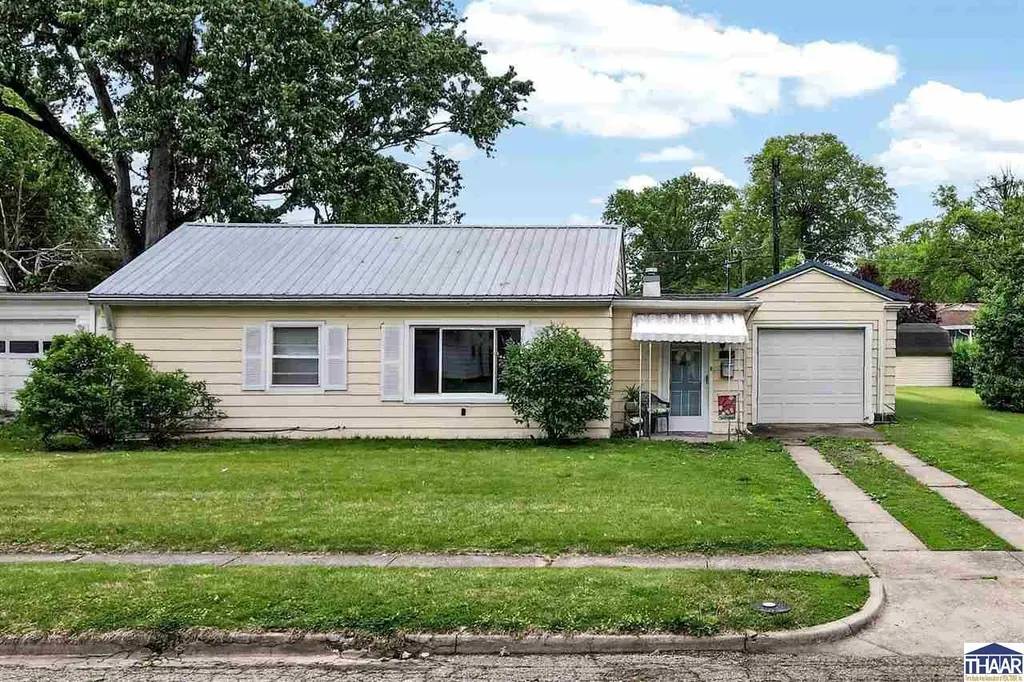
2611 Mariposa Dr · Terre Haute, IN
Flood risk 1/10 · Minimal
- FEMA flood zone
- X (unshaded)
- Chance of flooding over 30 yrs
- 0.0%
- Est. flood insurance / yr
- $507 – $1,088
Fire risk 1/10 · Minimal
- Est. fire insurance / yr
- $717 – $1,331
Heat risk 4/10 · Minor
- Hot days now (above 104°F)
- 7 days/yr
- Hot days in 30 yrs
- 19 days/yr
Wind risk 2/10 · Minimal
- Chance of severe wind over 30 yrs
- 1.0%
Air-quality risk 3/10 · Minor
- Unhealthy air days now
- 3 days/yr
- Unhealthy air days in 30 yrs
- 4 days/yr
Risk factors via First Street. Map © Google.
Why this score? — see what drove the C+ grade
The composite is a weighted blend of 9 inputs, each scored 0–100. Each bar is that input's sub-score; the figure is the points it added to the 100-point composite (weight × sub-score).
- Cash flow +23.8/30.0
- ARV discount +15.0/15.0
- DSCR +7.7/10.0
- 1% rule +5.6/10.0
- Livability +3.8/5.0
- Rent growth +3.5/5.0
- Schools +2.9/10.0
- Condition / age +2.5/5.0
- Appreciation +0.0/10.0
$135,000
🖨 Deal sheet 📄 Offer letter ✓ Due diligence
Listing remarks MLS
Much more space than you think -- with neutral colors and lots of sunlight, this place just needs some new flooring. 1862 sq ft with 3 bedrooms, 2 full baths and a family room. Family Room is approximately 19 x 12 and the Master Bedroom is 19 x 9 with a walk-in closet. Nice closet space throughout this home. There is space in the kitchen for kitchen office and access to patio - great place for morning coffee. Metal roof and furnace installed approximately 2004. Exterior of home was also painted about the same time. All plumbing has been replaced and is now run thru the ceiling rather than the slab. Very sunny house with a fenced backyard, attached garage and built in storage unit. Convenient location -- close to shops, grocery, retail and parks.
Key facts
- Garage
- Built 1951
- Listed 2 days
Property features AI
Exterior
- Parking: Attached garage (1 car); Concrete driveway/parking
- Security: Smoke detector(s)
- Utilities: Public sewer
- Home design: Single-family residence; 1 story
- Construction: Metal siding; Metal roof
- Exterior features: Covered patio
Interior
- Kitchen: Dishwasher; Electric range; Electric oven; Refrigerator
- Flooring: Vinyl
- Bathrooms: 2 full bathrooms
- Heating & cooling: Natural gas heating; Central air conditioning
- Interior features: Walk-in closet(s)
- Laundry & utility: Washer; Dryer
Neighborhood map
What this means for you Summary
Snapshot
- This is a 3-bed/2.0-bath single-family listed at $135k.
Deal economics
- At list price, monthly cash flow is $260 ($3k/yr) — positive.
- The deal already cash-flows at list — no discount required.
- Meets the 1% rule at list price ($1k rent vs $135k).
- Cap rate 8.6% vs local median 4.7% in Terre Haute — top-decile yield for the area; either an underpriced asset or a hidden risk that comps aren't pricing in. Stress-test before assuming the spread holds.
Location & tenants
- Location reads 75/100 on livability (#63 in IN, #4,186 nationally) — a middle-class / working-renter tenant base. Strengths: cost of living A+, housing A+, health & safety A+; Watch: crime F, employment F.
- Vigo County School Corporation (urban): math 32% / reading 37% proficiency, ranked #202 of 301 in IN (top 67%) — families likely to look elsewhere, expect single-tenant / working-renter base with shorter leases.
- Zoned schools: Davis Park Elementary School (math 32% / reading 27%, grade F, #697 of 994 statewide, top 73%, 335 students, 88% FRL); Woodrow Wilson Middle School (math 21% / reading 31%, grade F, #240 of 330 statewide, top 73%, 701 students, 62% FRL); Terre Haute North Vigo High School (math 25% / reading 62%, grade F, #191 of 369 statewide, top 52%, 1,507 students, 51% FRL) — zoned schools average 67% FRL vs 47% district-wide (20 pts higher); higher-poverty schools than district average — tighter screening recommended.
- Market conditions: Rents rising fast (+4.1%/yr); 177 active listings in the ZIP; 6 comparable units currently listed for rent nearby; rentals lingering (median 44d on market — plan ~5-8 weeks vacancy on turnover, expect pricing pressure); 100% of comp listings sitting > 30 days — soft ceiling on asking rent; 60 units permitted in Vigo County in 2024 (0 in 5+ unit buildings).
Forward outlook
- Local home prices are declining (-3.0%/yr); year-one equity from $933 of loan paydown is wiped out by about $4k of value loss. Plan a longer hold.
- Vigo County population projected to shrink 5% by 2050 — rents likely to lag national; underwrite the cash flow, not the appreciation.
Negotiation context
- Only 2 days on market — expect competitive offers; lowballing is unlikely to land.
- 2 sale attempts since 7y ago with the ask held roughly flat each time — persistent listings suggest the price (not the market) is what's stuck; bring a comps-based counter.
Risks & watch-outs
- Watch-outs: built in 1951 — expect roof / HVAC / electrical / plumbing capex.
Questions for the listing agent
- Built in 1951 — when were the roof, HVAC, electrical panel, plumbing, and water heater last replaced?
- Is there a deadline driving the sale (1031 exchange, divorce, estate, relocation)? That informs how much negotiation room exists.
- Schools are D-rated, which usually means shorter tenancies and higher turnover. Who's the typical renter profile here, and what's been the actual vacancy rate?
- Crime grade is F in this area — have there been break-ins, vandalism, or insurance claims at this property in the last 3 years? What carrier currently insures it and at what premium?
- What's the average days-on-market for RENTAL listings here right now (not sales)? A rising rental-DOM trend means longer vacancies and softer asking-rent achievability than the comps imply.
- What's the recent tenant-quality profile in this submarket — average credit score on applications, eviction rate, late-payment / NSF rate, and stable-employment percentage? A property-management company in the area should have these aggregated.
- How much new for-sale + rental construction is in the pipeline within 1–3 miles? Heavy new supply typically softens prices + rents 12–24 months out; constrained supply supports both.
Investment metrics
- 1% rule
- 1.06% ✓
- Cap rate
- 8.60%
- Cash-on-cash
- 8.26%
- DSCR
- 1.37
- GRM
- 7.9
CMA / ARV
- ARV (median comp)
- $173,651
- List price
- $135,000
- Delta
- -22.26%
- Verdict
- UNDERPRICED
- Comps
- 20 within 1.0 mi
Show comp detail 10 sales within ~0.75 mi
| Address | Dist | Beds/Ba | Sqft | Sold | Price | $/sf | Match |
|---|---|---|---|---|---|---|---|
| 2611 Mariposa Dr | 0.00mi | 3/2.0 | 1,892 (0%) | 1mo | $138,000 | $73 | 100 |
| 3309 Wabash Ave | 0.52mi | 3/1.5 | 1,962 (+4%) | 4mo | $220,000 | $112 | 64 |
| 2400 Ohio Blvd | 0.29mi | 4/2.5 (+1) | 1,760 (-7%) | 8mo | $340,000 | $193 | 61 |
| 2811 Fenwood Ave | 0.38mi | 2/1.0 (-1) | 2,000 (+6%) | 11mo | $92,000 | $46 | 54 |
| 2539 Oak St | 0.60mi | 2/2.0 (-1) | 1,719 (-9%) | 7mo | $173,000 | $101 | 45 |
| 2514 Crawford St | 0.70mi | 3/1.0 | 2,080 (+10%) | 2mo | $200,000 | $96 | 45 |
| 65 S 21st St | 0.50mi | 2/1.5 (-1) | 1,625 (-14%) | 5mo | $192,500 | $118 | 42 |
| 2518 Wilson St | 0.64mi | 2/1.5 (-1) | 2,118 (+12%) | 5mo | $185,000 | $87 | 39 |
| 63 S 20th St | 0.56mi | 3/1.0 | 2,150 (+14%) | 11mo | $155,000 | $72 | 38 |
| 610 Oak Dr | 0.72mi | 4/2.5 (+1) | 2,127 (+12%) | 23mo | $255,000 | $120 | 19 |
Match score weights: distance 35% · size 25% · config 20% · recency 20%. Top-matched comps best support the ARV.
Projected returns pro-forma
-3.0% appreciation · 4.09% rent growth · sell at horizon
- IRR
- -2.6%
- Equity multiple
- 0.90×
- Total profit
- $-3,745
- Equity at exit
- $20,129
- IRR
- 8.2%
- Equity multiple
- 1.65×
- Total profit
- $24,646
- Equity at exit
- $11,672
Cash invested: $37,800 (down + closing). Projections, not guarantees.
Landlord ↔ Tenant lean methodology
- Overall (STATE)
- 90 Strongly Landlord-Friendly
- State Indiana
- 90 Strongly Landlord-Friendly · R+11
- County
- — inherits STATE
- City
- — inherits STATE
ZIP-level market 47803
- Home prices YoY
- -28.6%
- Rents YoY
- 4.1%
- Active inventory
- 177
- Price-to-rent
- 7.9×
Monthly cashflow live
- Estimated rent
- $1,430 high interval (Pro) →
- Mortgage (P&I)
- −$708
- Tax from tax record
- −$105 /mo · $1,262/yr
- Insurance
- −$56
- HOA
- −$0
- Vacancy / Maint / Mgmt
- −$300
- Net cashflow
- $260
Break-even live
UW: 25.0% down · 7.5% · 30yr · 1.5% tax · 5.0% vac · 8.0% maint · 8.0% mgmt
Financing live
Cash to close
- Down payment
- $33,750
- Closing costs
- $4,050
- Reserves months
- —
- Total cash needed
- —
Loan-product check · same deal, 3 products live
Conventional
25% down · 7.5% · 30yr
- Down + closing
- —
- Monthly P&I
- —
- Monthly cashflow
- —
- DSCR
- —
- Eligible?
- —
Personal DTI + credit; lowest rate.
DSCR
20% down · 8.5% · 30yr
- Down + closing
- —
- Monthly P&I
- —
- Monthly cashflow
- —
- DSCR
- —
- Eligible?
- —
No personal income docs; deal must DSCR.
Hard money
10% down · 12.0% · 12mo
- Down + closing
- —
- Monthly P&I
- —
- Monthly cashflow
- —
- DSCR
- —
- Eligible?
- —
Short-term bridge; refi at stabilization.
Rent comps 6 comps
| Address | Beds | Baths | Sqft | Rent | $/sqft | DOM | Units | Dist |
|---|---|---|---|---|---|---|---|---|
| 2116 Poplar St Terre Haute, IN | 4.0 | 1.5 | 1872 | $1,900 | $1.01 | 43d | 1 | 0.65mi |
| 1915 Poplar St Unit A Terre Haute, IN | 3.0 | 1.0 | 1412 | $1,200 | $0.85 | 43d | 1 | 0.77mi |
| 2206 2nd Ave Terre Haute, IN | 2.0 | 1.0 | 1664 | $785 | $0.47 | 44d | 1 | 0.78mi |
| 124 N Fruitridge Ave Terre Haute, IN | 3.0 | 1.0 | 1891 | $950 | $0.50 | 43d | 1 | 0.97mi |
| 1728 N 24th St Terre Haute, IN | 4.0 | 2.0 | 1922 | $1,035 | $0.54 | 43d | 1 | 1.18mi |
| 4201 Locust St Terre Haute, IN | 1.0–3.0 | 1.0–2.0 | 1016 | $1,695 | $1.67 | 43d | 12 | 1.33mi |
Listing history 4 events
-
2026-05-02status Pending 558-char remark
-
2026-04-30$135,000 Active 558-char remark
-
2019-04-05soldstatus $83,500 755-char remark
Show marketing remark (755 chars)
Much more space than you think -- with neutral colors and lots of sunlight, this place just needs some new flooring. 1862 sq ft with 3 bedrooms, 2 full baths and a family room. Family Room is approximately 19 x 12 and the Master Bedroom is 19 x 9 with a walk-in closet. Nice closet space throughout this home. There is space in the kitchen for kitchen office and access to patio - great place for morning coffee. Metal roof and furnace installed approximately 2004. Exterior of home was also painted about the same time. All plumbing has been replaced and is now run thru the ceiling rather than the slab. Very sunny house with a fenced backyard, attached garage and built in storage unit. Convenient location -- close to shops, grocery, retail and parks.
-
2019-02-22$83,500 755-char remark
Show marketing remark (755 chars)
Much more space than you think -- with neutral colors and lots of sunlight, this place just needs some new flooring. 1862 sq ft with 3 bedrooms, 2 full baths and a family room. Family Room is approximately 19 x 12 and the Master Bedroom is 19 x 9 with a walk-in closet. Nice closet space throughout this home. There is space in the kitchen for kitchen office and access to patio - great place for morning coffee. Metal roof and furnace installed approximately 2004. Exterior of home was also painted about the same time. All plumbing has been replaced and is now run thru the ceiling rather than the slab. Very sunny house with a fenced backyard, attached garage and built in storage unit. Convenient location -- close to shops, grocery, retail and parks.
ⓘ Source: listings_history table (triggers on properties + properties_extension) + one-shot
backfill from property_details.listing_events for pre-trigger history.
Tax reassessment forecast IN · Partial reset (capped growth)
- Current annual tax
- $1,262 · $105/mo
- Projected year-2 tax
- $1,262 · $105/mo
- Expected delta
- $0/yr ($0/mo · 0.0%)
ⓘ Screening estimate from a state-policy table — verify with the county assessor before closing.
Climate risk First Street
- Flood 1/10 Low FEMA zone X (unshaded) · 0% chance over 30 yrs
- Wildfire 1/10 Low
- Heat 4/10 Moderate 7 d/yr ≥104°F today · 19 d/yr by 30 yrs out
- Wind 2/10 Low 100% chance of damaging wind over 30 yrs
- Air quality 3/10 Moderate 3 unhealthy d/yr today · 4 by 30 yrs out
Nearby sold comps map
Loading sold comps map…
Walkable amenities ~0.75 mi
Loading nearby amenities…
Taxation est. · year 1
- Rental income
- $17,156
- − Mortgage interest
- −$7,562
- − Property taxes
- −$1,262
- − Insurance
- −$675
- − Repairs & maintenance
- −$1,372
- − Management
- −$1,372
- − Depreciation
- −$3,927
- Taxable income
- $985
- Est. tax owed @ 24.0%
- −$236
- After-tax cash flow
- $2,884/yr
For passive investors: Depreciation is non-cash, so a rental often shows a tax loss while cash-flowing — sheltering income. Rental losses are passive: they offset passive income freely, and up to $25,000/yr can offset ordinary (W-2) income if you actively participate and your MAGI is under $100k (phasing out to $0 by $150k); unused losses carry forward. On sale, claimed depreciation is recaptured at up to 25%, and gains may owe capital-gains tax (a 1031 exchange can defer both). Figures are a year-1 estimate at your 24.0% rate — not tax advice; consult a CPA.
Schools (NCES district)
- District
- Vigo County School Corporation
- NCES district ID
- 1812090
- Math proficiency
- 32% ▼ -10.00%
- Reading proficiency
- 37% ▼ -8.00%
- Median HH income
- $40,100
- Composite
- 28.97/100
- National rank
- #6625
- State rank
- #202 of 301 in IN
Livability — Terre Haute
- Score
- 75/100
- State rank
- #63
- US rank
- #4186
Category grades
Schools grade is shown separately in the Schools card above.
Census & demographics
- Census place
- Terre Haute, IN
- County
- Vigo County · 91,193 people
- City population
- 91,193
- Metro
- Terre Haute, IN
- Population (ZIP)
- 21,746
- Household income
- $60,565
- Rent vs Own
- Severe rent burden
- 571.0
Population outlook (Vigo County) Hauer SSP2
- Today (2025)
- 106,366 people
- By 2030
- 105,674 · -0.7%
- By 2040
- 103,731 · -2.5%
- By 2050
- 101,200 · -4.9%
- By 2075
- 95,674 · -10.1%
- By 2100
- 85,910 · -19.2%
Race, ethnicity, and origin ACS 2023
- Neighborhood character
- Predominantly White (86%)
- Race & ethnicity
- White 86% Asian 5% Two or more races 4% Black 3% Hispanic / Latino 3%
- Common ancestry
- Slovak 2% Lithuanian 2% Italian 1%
- Foreign-born
- 5% · China, Canada
- Languages at home
- 94% English-only · Chinese 2% Spanish 1% Other Asian/Pacific 1%
Political lean MEDSL · Vigo
- 2024 margin
- R (+18.1) · D 40.0% · R 58.1% · Other 2.0%
- 2008→2024 swing
- -33.9pp toward R · 2008: 15.8pp · 2024: -18.1pp
- All cycles
- 2024: R+18.1 2020: R+14.7 2016: R+15.2 2012: D+0.8 2008: D+15.8
Not yet ingested
- Civics
- —
Market trends
- HPI YoY
- ▼ -69.70%
- Current HPI
- 173.6547
- Rent YoY
- ▲ 4.09%
- Metro
- Terre Haute, IN
- State GDP YoY
- ▲ 2.90%
- F500 in state
- 18
Industry mix (Fortune 500 HQ in IN)
| Industry | F500 HQs | Revenue |
|---|---|---|
| Industrial Machinery | 2 | $37B |
|
||
| Healthcare | 1 | $177B |
|
||
| Pharmaceuticals | 1 | $45B |
|
||
| Metals / Steel | 1 | $18B |
|
||
| Agriculture | 1 | $17B |
|
||
| Packaging | 1 | $12B |
|
||
Price history
+65.3% since first listed5 events — show timeline
- 2026-06-01 Sold (MLS) $138,000 THAAR
- 2026-05-02 Pending — THAAR
- 2026-04-30 Listed $135,000 THAAR
- 2019-04-05 Sold (MLS) $83,500 THAAR
- 2019-02-22 Listed $83,500 THAAR
Property tax history
+3.0%/yrLatest (2024): $1,262 · +4.5% YoY. Source: county tax records.
Cash-flow waterfall
monthlySold comps — $/sqft
last 12 mo · ≤1 miLoading sold comps…