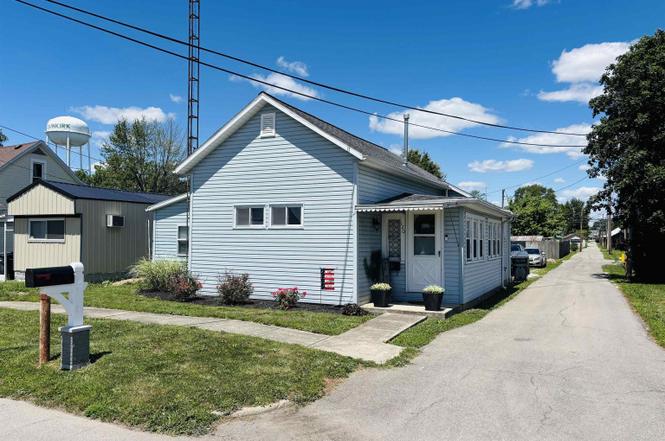
120 W Center St · Dunkirk, IN
Flood risk 1/10 · Minimal
- FEMA flood zone
- X (unshaded)
- Chance of flooding over 30 yrs
- 0.0%
- Est. flood insurance / yr
- $507 – $1,088
Fire risk 1/10 · Minimal
- Est. fire insurance / yr
- $717 – $1,331
Heat risk 3/10 · Minor
- Hot days now (above 99°F)
- 7 days/yr
- Hot days in 30 yrs
- 18 days/yr
Wind risk 2/10 · Minimal
- Chance of severe wind over 30 yrs
- —
Air-quality risk 3/10 · Minor
- Unhealthy air days now
- 2 days/yr
- Unhealthy air days in 30 yrs
- 4 days/yr
Risk factors via First Street. Map © Google.
Why this score? — see what drove the D+ grade
The composite is a weighted blend of 9 inputs, each scored 0–100. Each bar is that input's sub-score; the figure is the points it added to the 100-point composite (weight × sub-score).
- Cash flow +20.5/30.0
- Appreciation +6.8/10.0
- DSCR +6.5/10.0
- 1% rule +4.1/10.0
- Schools +3.2/10.0
- Livability +3.2/5.0
- Rent growth +2.5/5.0
- Condition / age +2.5/5.0
- ARV discount +0.0/15.0
$97,000
🖨 Deal sheet 📄 Offer letter ✓ Due diligence
Listing remarks
Come check out this cozy 2 bedroom, 1 bath home! There have been several updates made to the home. It features a beautiful and spacious living room area with newly stained hardwood floors. A lovely kitchen and updated bathroom with a new vanity and shower. There is a bonus entryway room that makes great for a home office or even an extra bedroom. The home also comes with a fenced in back yard, which is perfect for young children and dogs, as well as an above ground pool that is great for kicking back and relaxing. Furnace and AC were installed around 3 years ago. You won't want to miss out on this one!
Key facts
- Bonus entryway room
- Kitchen
- Living room area
Tags
Property features AI
Finance
- Other:
- Financial info:
- HOA & community:
Exterior
- Parking:
- Security:
- Utilities: Public water; Public sewer
- Home design: Single-family residence (site-built); One-story
- Construction: Vinyl siding; Built as a site-built home
- Exterior features: Privacy wood fencing; Above-ground private pool; Corner lot; Shed(s)
Interior
- Kitchen: Microwave; Refrigerator; Gas oven
- Bedrooms: Master downstairs
- Flooring: Hardwood; Carpet; Laminate
- Bathrooms: 1 full bathroom (main level)
- Heating & cooling: Natural gas heating with forced air; Central air conditioning
- Interior features: Open floorplan; Master suite on the main level; Crawl space basement
- Laundry & utility: Washer hookup; Electric dryer hookup (main level); Electric water heater
Neighborhood map
What this means for you Summary
Snapshot
- This is a 2-bed/1.0-bath single-family listed at $97k.
Deal economics
- At list price, monthly cash flow is $128 ($2k/yr) — positive.
- The deal already cash-flows at list — no discount required.
- To meet the 1% rule (rent ≥ 1% of price), the offer needs to be $88k (9.2% below list).
- Recommended offer: $88k (9.2% below list) — sets the bar for 1% rule.
Location & tenants
- Location reads 64/100 on livability (#404 in IN) — a middle-class / working-renter tenant base. Strengths: crime A+, cost of living A+, housing A+; Watch: health & safety D, amenities F, commute F.
- Jay School Corporation (rural): math 38% / reading 37% proficiency, ranked #175 of 301 in IN (top 58%) — families likely to look elsewhere, expect single-tenant / working-renter base with shorter leases.
- Zoned schools: West Jay Elementary (math 42% / reading 32%, grade F, #550 of 994 statewide, top 57%, 249 students, 75% FRL); Jay County Jr/Sr High School (math 34% / reading 41%, grade F, #245 of 369 statewide, top 67%, 1,242 students, 50% FRL) — zoned schools average 62% FRL vs 44% district-wide (19 pts higher); higher-poverty schools than district average — tighter screening recommended.
- Market conditions: 32 active listings in the ZIP; 19 units permitted in Jay County in 2024 (0 in 5+ unit buildings).
Forward outlook
- In year one you build about $4k of equity ($671 loan paydown + $4k appreciation (3.6% local appreciation)).
- Jay County population projected at -12% by 2050 — secular population decline; favor cash flow + early exit over multi-decade hold.
- At projected returns (3.6% appreciation + 3.0% rent growth), your $27k cash investment doubles in ~5 years — after that, you're playing with house money.
- By year 8, paydown + projected appreciation supports a ~$31k cash-out refi (75% LTV) — recoverable capital for the next deal without selling this one.
Negotiation context
- Only 3 days on market — expect competitive offers; lowballing is unlikely to land.
Risks & watch-outs
- Watch-outs: built in 1900 — expect roof / HVAC / electrical / plumbing capex.
Questions for the listing agent
- Built in 1900 — when were the roof, HVAC, electrical panel, plumbing, and water heater last replaced?
- Is there a deadline driving the sale (1031 exchange, divorce, estate, relocation)? That informs how much negotiation room exists.
- Schools are D-rated, which usually means shorter tenancies and higher turnover. Who's the typical renter profile here, and what's been the actual vacancy rate?
- The area grade is low — what's the realistic commute time and amenity access for the typical tenant pool here? Any planned neighborhood developments (good or bad) we should know about?
- What's the average days-on-market for RENTAL listings here right now (not sales)? A rising rental-DOM trend means longer vacancies and softer asking-rent achievability than the comps imply.
- What's the recent tenant-quality profile in this submarket — average credit score on applications, eviction rate, late-payment / NSF rate, and stable-employment percentage? A property-management company in the area should have these aggregated.
- How much new for-sale + rental construction is in the pipeline within 1–3 miles? Heavy new supply typically softens prices + rents 12–24 months out; constrained supply supports both.
Investment metrics
- 1% rule
- 0.91% ✗
- Cap rate
- 7.87%
- Cash-on-cash
- 5.65%
- DSCR
- 1.25
- GRM
- 9.2
CMA / ARV
- ARV (on-the-fly)
- $67,592
- Comps found
- 12
Show comp detail 12 sales within ~0.75 mi
| Address | Dist | Beds/Ba | Sqft | Sold | Price | $/sf | Match |
|---|---|---|---|---|---|---|---|
| 210 W Center St | 0.05mi | 1/0.5 (-1) | 913 (-4%) | 7mo | $10,000 | $11 | 78 |
| 355 E North St | 0.27mi | 2/1.0 | 872 (-8%) | 0mo | $40,000 | $46 | 73 |
| 651 N Hickory St | 0.34mi | 2/1.0 | 966 (+2%) | 11mo | $15,000 | $16 | 72 |
| 223 Mount Auburn St | 0.23mi | 2/1.0 | 986 (+4%) | 17mo | $37,000 | $38 | 69 |
| 156 E Grand St | 0.30mi | 2/1.0 | 980 (+3%) | 14mo | $72,500 | $74 | 69 |
| 120 W Sam St | 0.45mi | 2/1.0 | 896 (-6%) | 2mo | $60,000 | $67 | 67 |
| 709 N Main St | 0.40mi | 3/1.0 (+1) | 918 (-4%) | 7mo | $65,000 | $71 | 64 |
| 324 W Jay St | 0.32mi | 3/1.0 (+1) | 1,038 (+9%) | 2mo | $163,000 | $157 | 64 |
| 702 S Franklin St | 0.42mi | 2/2.0 | 1,010 (+6%) | 11mo | $135,000 | $134 | 57 |
| 607 Hart Dr | 0.51mi | 3/1.5 (+1) | 1,053 (+11%) | 2mo | $145,000 | $138 | 50 |
| 356 W Jay St | 0.35mi | 2/1.0 | 822 (-14%) | 17mo | $8,900 | $11 | 47 |
| 235 Moore Ave | 0.52mi | 3/1.5 (+1) | 1,075 (+13%) | 14mo | $163,000 | $152 | 35 |
Match score weights: distance 35% · size 25% · config 20% · recency 20%. Top-matched comps best support the ARV.
Projected returns pro-forma
3.64% appreciation · 3.0% rent growth · sell at horizon
- IRR
- 14.4%
- Equity multiple
- 1.85×
- Total profit
- $23,102
- Equity at exit
- $47,153
- IRR
- 15.7%
- Equity multiple
- 3.46×
- Total profit
- $66,772
- Equity at exit
- $75,547
Cash invested: $27,160 (down + closing). Projections, not guarantees.
Landlord ↔ Tenant lean methodology
- Overall (STATE)
- 90 Strongly Landlord-Friendly
- State Indiana
- 90 Strongly Landlord-Friendly · R+11
- County
- — inherits STATE
- City
- — inherits STATE
ZIP-level market 47336
- Home prices YoY
- 1.6%
- Active inventory
- 32
- Price-to-rent
- 9.2×
Monthly cashflow live
- Estimated rent
- $880 medium interval (Pro) →
- Mortgage (P&I)
- −$509
- Tax from tax record
- −$19 /mo · $223/yr
- Insurance
- −$40
- HOA
- −$0
- Vacancy / Maint / Mgmt
- −$185
- Net cashflow
- $128
Break-even live
UW: 25.0% down · 7.5% · 30yr · 1.5% tax · 5.0% vac · 8.0% maint · 8.0% mgmt
Financing live
Cash to close
- Down payment
- $24,250
- Closing costs
- $2,910
- Reserves months
- —
- Total cash needed
- —
Loan-product check · same deal, 3 products live
Conventional
25% down · 7.5% · 30yr
- Down + closing
- —
- Monthly P&I
- —
- Monthly cashflow
- —
- DSCR
- —
- Eligible?
- —
Personal DTI + credit; lowest rate.
DSCR
20% down · 8.5% · 30yr
- Down + closing
- —
- Monthly P&I
- —
- Monthly cashflow
- —
- DSCR
- —
- Eligible?
- —
No personal income docs; deal must DSCR.
Hard money
10% down · 12.0% · 12mo
- Down + closing
- —
- Monthly P&I
- —
- Monthly cashflow
- —
- DSCR
- —
- Eligible?
- —
Short-term bridge; refi at stabilization.
Listing history 4 events
-
2026-06-18days on market $97,000 Active 3 DOM
-
2026-06-17days on market $97,000 Active 2 DOM
-
2026-06-16remarks 609-char remark
-
2026-06-16$97,000 Active 1 DOM
ⓘ Source: listings_history table (triggers on properties + properties_extension) + one-shot
backfill from property_details.listing_events for pre-trigger history.
Tax reassessment forecast IN · Partial reset (capped growth)
- Current annual tax
- $223 · $19/mo
- Projected year-2 tax
- $524 · $44/mo
- Expected delta
- +$301/yr (+$25/mo · 135.1%)
ⓘ Screening estimate from a state-policy table — verify with the county assessor before closing.
Climate risk First Street
- Flood 1/10 Low FEMA zone X (unshaded) · 0% chance over 30 yrs
- Wildfire 1/10 Low
- Heat 3/10 Moderate 7 d/yr ≥99°F today · 18 d/yr by 30 yrs out
- Wind 2/10 Low
- Air quality 3/10 Moderate 2 unhealthy d/yr today · 4 by 30 yrs out
Nearby sold comps map
Loading sold comps map…
Walkable amenities ~0.75 mi
Loading nearby amenities…
Taxation est. · year 1
- Rental income
- $10,564
- − Mortgage interest
- −$5,434
- − Property taxes
- −$223
- − Insurance
- −$485
- − Repairs & maintenance
- −$845
- − Management
- −$845
- − Depreciation
- −$2,822
- Taxable loss
- −$89
- Est. tax savings @ 24.0%
- +$21
- After-tax cash flow
- $1,555/yr
For passive investors: Depreciation is non-cash, so a rental often shows a tax loss while cash-flowing — sheltering income. Rental losses are passive: they offset passive income freely, and up to $25,000/yr can offset ordinary (W-2) income if you actively participate and your MAGI is under $100k (phasing out to $0 by $150k); unused losses carry forward. On sale, claimed depreciation is recaptured at up to 25%, and gains may owe capital-gains tax (a 1031 exchange can defer both). Figures are a year-1 estimate at your 24.0% rate — not tax advice; consult a CPA.
Schools (NCES district)
- District
- Jay School Corporation
- NCES district ID
- 1804980
- Math proficiency
- 38% ▼ -13.00%
- Reading proficiency
- 37% ▼ -13.00%
- Median HH income
- $40,841
- Composite
- 31.56/100
- National rank
- #5954
- State rank
- #175 of 301 in IN
Livability — Dunkirk
- Score
- 64/100
- State rank
- #404
- US rank
- #14764
Category grades
Schools grade is shown separately in the Schools card above.
Census & demographics
- Census place
- Dunkirk, IN
- Population (ZIP)
- 2,793
Population outlook (Jay County) Hauer SSP2
- Today (2025)
- 20,586 people
- By 2030
- 20,155 · -2.1%
- By 2040
- 19,274 · -6.4%
- By 2050
- 18,203 · -11.6%
- By 2075
- 15,062 · -26.8%
- By 2100
- 10,857 · -47.3%
Race, ethnicity, and origin ACS 2023
- Neighborhood character
- Predominantly White (95%)
- Race & ethnicity
- White 95% Two or more races 3% Hispanic / Latino 2%
- Common ancestry
- Italian 4% Slovak 2% Scotch-Irish 1%
- Foreign-born
- 0%
- Languages at home
- 98% English-only · Spanish 1%
Political lean MEDSL · Jay
- 2024 margin
- Solid R (+55.2) · D 21.6% · R 76.7% · Other 1.7%
- 2008→2024 swing
- -47.3pp toward R · 2008: -7.8pp · 2024: -55.2pp
- All cycles
- 2024: R+55.2 2020: R+52.4 2016: R+47.8 2012: R+20.0 2008: R+7.8
Not yet ingested
- Civics
- —
Market trends
- HPI YoY
- ▲ 3.64%
- Current HPI
- 238.768
- Rent YoY
- —
- Metro
- —
- State GDP YoY
- ▲ 2.90%
- F500 in state
- 18
Industry mix (Fortune 500 HQ in IN)
| Industry | F500 HQs | Revenue |
|---|---|---|
| Industrial Machinery | 2 | $37B |
|
||
| Healthcare | 1 | $177B |
|
||
| Pharmaceuticals | 1 | $45B |
|
||
| Metals / Steel | 1 | $18B |
|
||
| Agriculture | 1 | $17B |
|
||
| Packaging | 1 | $12B |
|
||
Price history
1 event — show timeline
- 2026-06-15 Listed $97,000 IRMLS
Property tax history
+3.3%/yrLatest (2024): $223 · -2.3% YoY. Source: county tax records.
Cash-flow waterfall
monthlySold comps — $/sqft
last 12 mo · ≤1 miLoading sold comps…