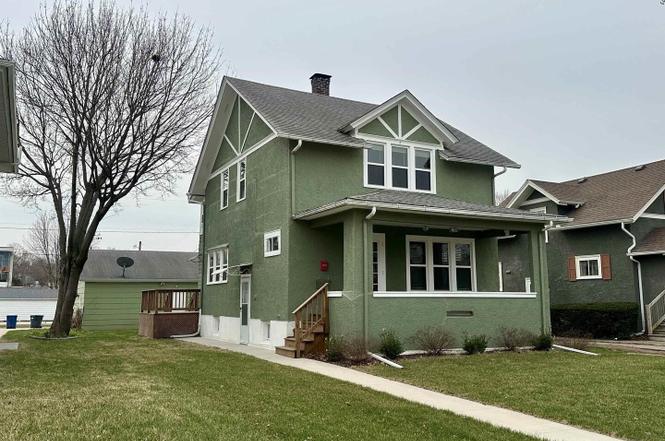
811 7th Ave S · Clinton, IA
Flood risk 3/10 · Minor
- FEMA flood zone
- X
- Chance of flooding over 30 yrs
- 0.1%
- Est. flood insurance / yr
- $473 – $860
Fire risk 2/10 · Minimal
- Est. fire insurance / yr
- $902 – $1,676
Heat risk 3/10 · Minor
- Hot days now (above 103°F)
- 7 days/yr
- Hot days in 30 yrs
- 16 days/yr
Wind risk 2/10 · Minimal
- Chance of severe wind over 30 yrs
- —
Air-quality risk 3/10 · Minor
- Unhealthy air days now
- 2 days/yr
- Unhealthy air days in 30 yrs
- 3 days/yr
Risk factors via First Street. Map © Google.
Why this score? — see what drove the D- grade
The composite is a weighted blend of 9 inputs, each scored 0–100. Each bar is that input's sub-score; the figure is the points it added to the 100-point composite (weight × sub-score).
- Cash flow +14.6/30.0
- Schools +4.5/10.0
- DSCR +4.4/10.0
- 1% rule +4.2/10.0
- Livability +3.8/5.0
- Rent growth +2.5/5.0
- Condition / age +2.5/5.0
- ARV discount +0.0/15.0
- Appreciation +0.0/10.0
$147,500
🖨 Deal sheet (PDF) 📄 Offer letter ✓ Due diligence
Key facts
- Built-in buffet
- Mudroom
- Original woodwork
Tags
Property features AI
Exterior
- Parking: Detached oversized garage with alley access (2 garage spaces, 2 total parking spaces)
- Utilities: Public water; Public sewer; Electric service with circuit breakers
- Home design: Detached single-family home; Two stories; Fee simple ownership; Home built over 100 years ago; Not rebuilt since original construction
- Construction: Stucco exterior; Block foundation
- Exterior features: Level lot; Lot dimensions approximately 45 x 140
Interior
- Kitchen: Kitchen on main level (10 x 10)
- Bedrooms: Three bedrooms total; Master bedroom located on second floor (10 x 19); Second bedroom located on second floor (9 x 12); Third bedroom located on second floor (10 x 11)
- Flooring: Hardwood flooring throughout main living areas and bedrooms
- Bathrooms: One full bathroom; One half bathroom; Basement includes a bathroom
- Heating & cooling: Forced air heating (natural gas); Central air conditioning
- Interior features: Full basement with egress window
Neighborhood map
What this means for you Summary
Snapshot
- This is a 3-bed/2.0-bath single-family listed at $148k.
Deal economics
- At list price, monthly cash flow is $34 ($409/yr) — positive.
- The deal already cash-flows at list — no discount required.
- To meet the 1% rule (rent ≥ 1% of price), the offer needs to be $136k (7.9% below list).
- Recommended offer: $130k (12.0% below list) — sets the bar for market timing.
Location & tenants
- Location reads 75/100 on livability (#222 in IA, #4,192 nationally) — a middle-class / working-renter tenant base. Strengths: cost of living A+, housing A+, health & safety A+; Watch: amenities C-, crime D, employment D.
- Clinton Community School District (town): math 52% / reading 56% proficiency, ranked #273 of 289 in IA (top 94%) — acceptable for families but not a draw, mixed tenant base, ~2y average lease.
- Zoned schools: Jefferson Elementary School (math 57% / reading 47%, grade C-, #494 of 616 statewide, top 83%, 343 students, 79% FRL); Clinton Middle School (math 49% / reading 53%, grade C, #210 of 246 statewide, top 87%, 749 students, 59% FRL); Clinton High School (math 43% / reading 57%, grade D+, #313 of 336 statewide, top 93%, 981 students, 49% FRL).
- Market conditions: 247 active listings in the ZIP; 5 comparable units currently listed for rent nearby; rentals lingering (median 46d on market — plan ~5-8 weeks vacancy on turnover, expect pricing pressure); 100% of comp listings sitting > 30 days — soft ceiling on asking rent; 116 units permitted in Clinton County in 2024 (50 in 5+ unit buildings).
Forward outlook
- Local home prices are declining (-3.0%/yr); year-one equity from $1k of loan paydown is wiped out by about $4k of value loss. Plan a longer hold.
- Clinton County population projected at -19% by 2050 — secular population decline; favor cash flow + early exit over multi-decade hold.
Negotiation context
- It's been on market 128 days — a 12% lower offer ($130k) is reasonable based on typical stale-listing flexibility.
- 9 sale attempts since 12y ago with the ask held roughly flat each time — persistent listings suggest the price (not the market) is what's stuck; bring a comps-based counter.
Risks & watch-outs
- Watch-outs: built in 1900 — expect roof / HVAC / electrical / plumbing capex.
Questions for the listing agent
- It's been on market 128 days. Have you received any prior offers? Is the seller open to a 12% concession, seller financing, or rate buy-down credit?
- Built in 1900 — when were the roof, HVAC, electrical panel, plumbing, and water heater last replaced?
- Why hasn't it sold? Are there any deal-killer items the seller is aware of (foundation, flood, title, zoning, code violations)?
- Is there a deadline driving the sale (1031 exchange, divorce, estate, relocation)? That informs how much negotiation room exists.
- Schools are B-rated — typically a magnet for longer-tenancy family renters. What's the average tenant stay here, and is there a school-zone premium baked into asking?
- Crime grade is D in this area — have there been break-ins, vandalism, or insurance claims at this property in the last 3 years? What carrier currently insures it and at what premium?
- The area grade is low — what's the realistic commute time and amenity access for the typical tenant pool here? Any planned neighborhood developments (good or bad) we should know about?
- What's the average days-on-market for RENTAL listings here right now (not sales)? A rising rental-DOM trend means longer vacancies and softer asking-rent achievability than the comps imply.
- What's the recent tenant-quality profile in this submarket — average credit score on applications, eviction rate, late-payment / NSF rate, and stable-employment percentage? A property-management company in the area should have these aggregated.
- How much new for-sale + rental construction is in the pipeline within 1–3 miles? Heavy new supply typically softens prices + rents 12–24 months out; constrained supply supports both.
Investment metrics
- 1% rule
- 0.92% ✗
- Cap rate
- 6.57%
- Cash-on-cash
- 0.99%
- DSCR
- 1.04
- GRM
- 9.0
CMA / ARV
- ARV (on-the-fly)
- $102,144
- Comps found
- 12
Show comp detail 12 sales within ~0.75 mi
| Address | Dist | Beds/Ba | Sqft | Sold | Price | $/sf | Match |
|---|---|---|---|---|---|---|---|
| 765 9th Ave S | 0.18mi | 2/1.0 (-1) | 1,353 (+1%) | 6mo | $102,500 | $76 | 76 |
| 1043 14th Ave S | 0.61mi | 2/2.0 (-1) | 1,359 (+1%) | 5mo | $130,000 | $96 | 60 |
| 1324 Caroline Ave | 0.60mi | 3/1.0 | 1,298 (-3%) | 2mo | $185,000 | $143 | 60 |
| 823 14th Ave S | 0.53mi | 3/2.0 | 1,456 (+8%) | 3mo | $100,000 | $69 | 59 |
| 756 13th Ave S | 0.46mi | 3/1.5 | 1,219 (-9%) | 4mo | $50,500 | $41 | 58 |
| 635 8th Ave S | 0.26mi | 2/1.0 (-1) | 1,210 (-10%) | 6mo | $36,525 | $30 | 57 |
| 545 3rd Ave S | 0.49mi | 2/1.0 (-1) | 1,245 (-7%) | 2mo | $74,900 | $60 | 54 |
| 1125 8th Ave S | 0.39mi | 4/1.5 (+1) | 1,527 (+14%) | 1mo | $20,000 | $13 | 52 |
| 1316 Florence Ave | 0.63mi | 2/1.0 (-1) | 1,276 (-5%) | 4mo | $154,255 | $121 | 50 |
| 1115 S 12th St | 0.57mi | 3/1.5 | 1,175 (-13%) | 2mo | $87,000 | $74 | 49 |
| 1408 S 10th St | 0.58mi | 2/1.0 (-1) | 1,164 (-13%) | 1mo | $125,000 | $107 | 40 |
| 1336 Florence Ave | 0.67mi | 2/1.5 (-1) | 1,152 (-14%) | 3mo | $133,900 | $116 | 35 |
Match score weights: distance 35% · size 25% · config 20% · recency 20%. Top-matched comps best support the ARV.
Projected returns pro-forma
-3.0% appreciation · 3.0% rent growth · sell at horizon
- IRR
- -14.7%
- Equity multiple
- 0.47×
- Total profit
- $-21,698
- Equity at exit
- $21,993
- IRR
- -6.0%
- Equity multiple
- 0.61×
- Total profit
- $-15,966
- Equity at exit
- $12,753
Cash invested: $41,300 (down + closing). Projections, not guarantees.
Landlord ↔ Tenant lean methodology
- Overall (STATE)
- 83 Strongly Landlord-Friendly
- State Iowa
- 83 Strongly Landlord-Friendly · R+6
- County
- — inherits STATE
- City
- — inherits STATE
ZIP-level market 52732
- Home prices YoY
- -34.9%
- Active inventory
- 247
- Price-to-rent
- 9.0×
Monthly cashflow live
- Estimated rent
- $1,359 high interval (Pro) →
- Mortgage (P&I)
- −$774
- Tax from tax record
- −$204 /mo · $2,452/yr
- Insurance
- −$61
- HOA
- −$0
- Vacancy / Maint / Mgmt
- −$285
- Net cashflow
- $34
Break-even live
Sensitivity live
| Price | -10% $118 | -5% $76 | +0% $34 | +5% $-8 | +10% $-49 |
|---|---|---|---|---|---|
| Rent | -10% $-73 | -5% $-20 | +0% $34 | +5% $88 | +10% $141 |
| Rate | -1.0pp $108 | -0.5pp $72 | base $34 | +0.5pp $-4 | +1.0pp $-43 |
UW: 25.0% down · 7.5% · 30yr · 1.5% tax · 5.0% vac · 8.0% maint · 8.0% mgmt
Financing live
Cash to close
- Down payment
- $36,875
- Closing costs
- $4,425
- Reserves months
- —
- Total cash needed
- —
Loan-product check · same deal, 3 products live
Conventional
25% down · 7.5% · 30yr
- Down + closing
- —
- Monthly P&I
- —
- Monthly cashflow
- —
- DSCR
- —
- Eligible?
- —
Personal DTI + credit; lowest rate.
DSCR
20% down · 8.5% · 30yr
- Down + closing
- —
- Monthly P&I
- —
- Monthly cashflow
- —
- DSCR
- —
- Eligible?
- —
No personal income docs; deal must DSCR.
Hard money
10% down · 12.0% · 12mo
- Down + closing
- —
- Monthly P&I
- —
- Monthly cashflow
- —
- DSCR
- —
- Eligible?
- —
Short-term bridge; refi at stabilization.
Rent comps 5 comps
| Address | Beds | Baths | Sqft | Rent | $/sqft | DOM | Units | Dist |
|---|---|---|---|---|---|---|---|---|
| 516 2nd Ave S Unit 2 Clinton, IA | 2.0 | 1.0 | 1082 | $750 | $0.69 | 45d | 1 | 0.59mi |
| 1004 S 4th St Clinton, IA | 3.0 | 2.5 | 1467 | $1,700 | $1.16 | 45d | 1 | 0.65mi |
| 1002 S 4th St Clinton, IA | 3.0 | 2.5 | 1467 | $1,750 | $1.19 | 45d | 1 | 0.66mi |
| 1006 S 4th St Clinton, IA | 3.0 | 2.5 | 1467 | $1,700 | $1.16 | 45d | 1 | 0.66mi |
| 1008 S 4th St Clinton, IA | 3.0 | 2.5 | 1467 | $1,750 | $1.19 | 45d | 1 | 0.67mi |
Listing history 30 events
-
2026-05-14status Pending
-
2026-03-30historical Contingent - Continue to Show
-
2026-01-06$147,500 Active
-
2025-12-17historical
-
2025-12-17historical
-
2025-09-09price
-
2025-09-08Active
-
2025-08-22historical
-
2025-08-22historical
-
2025-06-01price
-
2025-05-14price
-
2025-04-24price
-
2025-04-02Active
-
2022-11-29soldstatus $168,000
-
2022-11-28soldstatus $168,000
-
2022-11-28soldstatus $168,000 Closed
-
2022-10-14status Pending
-
2022-09-18$189,900
-
2022-09-18$189,900 Active
-
2021-02-26soldstatus $54,000
-
2021-02-26soldstatus $54,000
-
2021-02-26soldstatus $54,000
-
2021-01-11$67,900
-
2021-01-11$67,900
-
2020-05-08soldstatus $25,000
-
2015-04-27soldstatus $67,500
-
2015-04-24soldstatus $67,500
-
2015-04-24soldstatus $67,500
-
2014-11-01$69,500
-
2014-11-01$69,500
ⓘ Source: listings_history table (triggers on properties + properties_extension) + one-shot
backfill from property_details.listing_events for pre-trigger history.
Tax reassessment forecast IA · Partial reset (capped growth)
- Current annual tax
- $2,452 · $204/mo
- Projected year-2 tax
- $2,452 · $204/mo
- Expected delta
- $0/yr ($0/mo · 0.0%)
ⓘ Screening estimate from a state-policy table — verify with the county assessor before closing.
Climate risk First Street
- Flood 3/10 Moderate FEMA zone X · 10% chance over 30 yrs
- Wildfire 2/10 Low
- Heat 3/10 Moderate 7 d/yr ≥103°F today · 16 d/yr by 30 yrs out
- Wind 2/10 Low
- Air quality 3/10 Moderate 2 unhealthy d/yr today · 3 by 30 yrs out
Nearby sold comps map
Loading sold comps map…
Walkable amenities ~0.75 mi
Loading nearby amenities…
Taxation est. · year 1
- Rental income
- $16,305
- − Mortgage interest
- −$8,262
- − Property taxes
- −$2,452
- − Insurance
- −$738
- − Repairs & maintenance
- −$1,304
- − Management
- −$1,304
- − Depreciation
- −$4,291
- Taxable loss
- −$2,047
- Est. tax savings @ 24.0%
- +$491
- After-tax cash flow
- $900/yr
For passive investors: Depreciation is non-cash, so a rental often shows a tax loss while cash-flowing — sheltering income. Rental losses are passive: they offset passive income freely, and up to $25,000/yr can offset ordinary (W-2) income if you actively participate and your MAGI is under $100k (phasing out to $0 by $150k); unused losses carry forward. On sale, claimed depreciation is recaptured at up to 25%, and gains may owe capital-gains tax (a 1031 exchange can defer both). Figures are a year-1 estimate at your 24.0% rate — not tax advice; consult a CPA.
Schools (NCES district)
- District
- Clinton Community School District
- NCES district ID
- 1907710
- Math proficiency
- 52% ▼ -13.00%
- Reading proficiency
- 56% ▼ -8.00%
- Median HH income
- $40,900
- Composite
- 45.22/100
- National rank
- #2666
- State rank
- #273 of 289 in IA
Livability — Clinton
- Score
- 75/100
- State rank
- #222
- US rank
- #4192
Category grades
Schools grade is shown separately in the Schools card above.
Census & demographics
- Census place
- Clinton, IA
- County
- Clinton County · 25,880 people
- City population
- 25,880
- Metro
- Clinton, IA
- Population (ZIP)
- 25,880
- Household income
- $61,105
- Rent vs Own
- Severe rent burden
- 889.0
Population outlook (Clinton County) Hauer SSP2
- Today (2025)
- 44,817 people
- By 2030
- 43,090 · -3.9%
- By 2040
- 39,513 · -11.8%
- By 2050
- 36,209 · -19.2%
- By 2075
- 31,888 · -28.8%
- By 2100
- 30,382 · -32.2%
Race, ethnicity, and origin ACS 2023
- Neighborhood character
- Predominantly White (86%)
- Race & ethnicity
- White 86% Two or more races 7% Hispanic / Latino 5% Black 4%
- Common ancestry
- Iranian 4% Portuguese 2% Lithuanian 2%
- Foreign-born
- 2% · Canada
- Languages at home
- 97% English-only · Spanish 2% Arabic 1%
Political lean MEDSL · Clinton
- 2024 margin
- R (+18.9) · D 39.8% · R 58.6% · Other 1.6%
- 2008→2024 swing
- -41.9pp toward R · 2008: 23.0pp · 2024: -18.9pp
- All cycles
- 2024: R+18.9 2020: R+10.3 2016: R+5.1 2012: D+22.9 2008: D+23.0
Not yet ingested
- Civics
- —
Market trends
- HPI YoY
- ▼ -83.23%
- Current HPI
- 155.3426
- Rent YoY
- —
- Metro
- Clinton, IA
- State GDP YoY
- ▲ 2.48%
- F500 in state
- 4
Industry mix (Fortune 500 HQ in IA)
| Industry | F500 HQs | Revenue |
|---|---|---|
| Financial Services | 1 | $16B |
|
||
| Retail / Convenience | 1 | $15B |
|
||
Price history
+112.2% since first listed30 events — show timeline
- 2026-05-14 Pending — MRED as Distributed by MLS Grid
- 2026-03-30 Contingent — MRED as Distributed by MLS Grid
- 2026-01-06 Listed $147,500 MRED as Distributed by MLS Grid
- 2025-12-17 Listing Removed — MRED as Distributed by MLS Grid
- 2025-12-17 Listing Removed — RMLSA as Distributed by MLS Grid
- 2025-09-09 Price Changed — RMLSA as Distributed by MLS Grid
- 2025-09-08 Listed — RMLSA as Distributed by MLS Grid
- 2025-08-22 Listing Removed — RMLSA as Distributed by MLS Grid
- 2025-08-22 Listing Removed — MRED as Distributed by MLS Grid
- 2025-06-01 Price Changed — RMLSA as Distributed by MLS Grid
- 2025-05-14 Price Changed — RMLSA as Distributed by MLS Grid
- 2025-04-24 Price Changed — RMLSA as Distributed by MLS Grid
- 2025-04-02 Listed — RMLSA as Distributed by MLS Grid
- 2022-11-29 Sold (Public Records) $168,000 Public Records
- 2022-11-28 Sold (MLS) $168,000 RMLSA as Distributed by MLS Grid
- 2022-11-28 Sold (MLS) $168,000 MRED as Distributed by MLS Grid
- 2022-10-14 Pending — RMLSA as Distributed by MLS Grid
- 2022-09-18 Listed $189,900 RMLSA as Distributed by MLS Grid
- 2022-09-18 Listed $189,900 MRED as Distributed by MLS Grid
- 2021-02-26 Sold (Public Records) $54,000 Public Records
- 2021-02-26 Sold (MLS) $54,000 RMLSA as Distributed by MLS Grid
- 2021-02-26 Sold (MLS) $54,000 MRED as Distributed by MLS Grid
- 2021-01-11 Listed $67,900 RMLSA as Distributed by MLS Grid
- 2021-01-11 Listed $67,900 MRED as Distributed by MLS Grid
- 2020-05-08 Sold (Public Records) $25,000 Public Records
- 2015-04-27 Sold (Public Records) $67,500 Public Records
- 2015-04-24 Sold (MLS) $67,500 MRED as Distributed by MLS Grid
- 2015-04-24 Sold (MLS) $67,500 RMLSA as Distributed by MLS Grid
- 2014-11-01 Listed $69,500 MRED as Distributed by MLS Grid
- 2014-11-01 Listed $69,500 RMLSA as Distributed by MLS Grid
Property tax history
+6.4%/yrLatest (2025): $2,452 · +1.7% YoY. Source: county tax records.
Cash-flow waterfall
monthlySold comps — $/sqft
last 12 mo · ≤1 miLoading sold comps…