 7-Plex
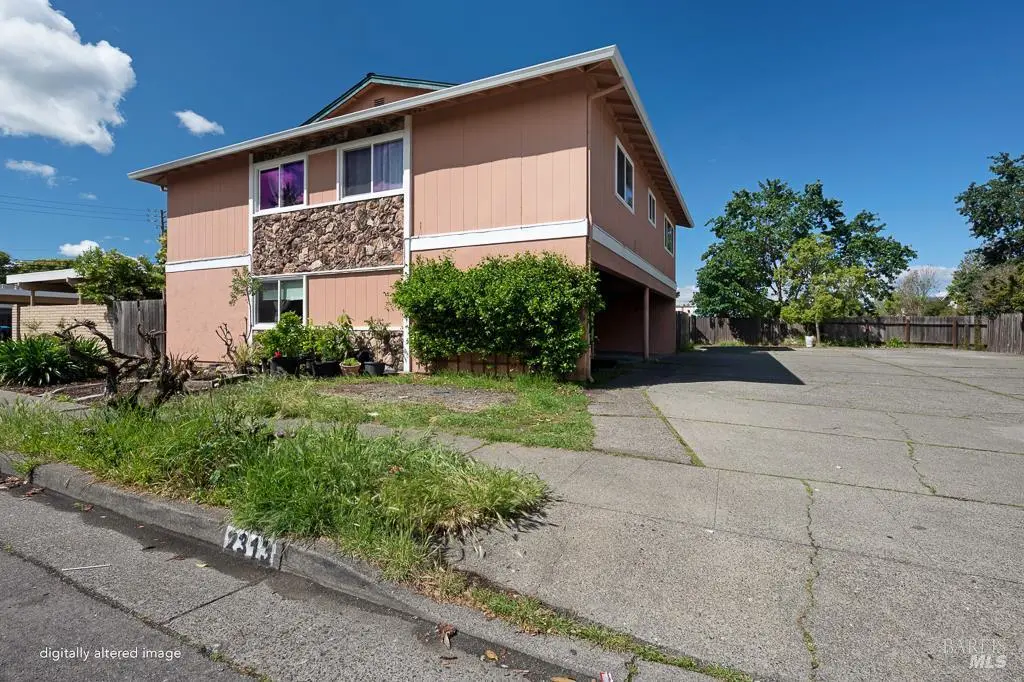
2313 Heidi Pl · Santa Rosa, CA
Flood risk 1/10 · Minimal
- FEMA flood zone
- X (unshaded)
- Chance of flooding over 30 yrs
- 0.0%
- Est. flood insurance / yr
- $507 – $1,088
Fire risk 2/10 · Minimal
- Est. fire insurance / yr
- $659 – $1,223
Heat risk 4/10 · Minor
- Hot days now (above 92°F)
- 7 days/yr
- Hot days in 30 yrs
- 16 days/yr
Wind risk 1/10 · Minimal
- Chance of severe wind over 30 yrs
- —
Air-quality risk 10/10 · Severe
- Unhealthy air days now
- 21 days/yr
- Unhealthy air days in 30 yrs
- 21 days/yr
Risk factors via First Street. Map © Google.
Why this score? — see what drove the C+ grade
The composite is a weighted blend of 9 inputs, each scored 0–100. Each bar is that input's sub-score; the figure is the points it added to the 100-point composite (weight × sub-score).
- Cash flow +25.3/30.0
- ARV discount +10.2/15.0
- DSCR +8.3/10.0
- 1% rule +6.3/10.0
- Livability +3.8/5.0
- Schools +3.7/10.0
- Rent growth +2.5/5.0
- Condition / age +2.5/5.0
- Appreciation +0.0/10.0
$1,199,000
🖨 Deal sheet (PDF) 📄 Offer letter ✓ Due diligence
Multi-family units
County records classify this as Multi-Family (2-4 Unit). Listing-text estimate: 7 units. estimate disagrees with records
Listing remarks
Strategic Value-Add Opportunity | 2313 Heidi Place, Santa Rosa Investors and exchange buyers will find significant upside potential at 2313 Heidi Place, a fully occupied four-plex in Northwest Santa Rosa. This 3,266 sq. ft. building features four spacious 2-bedroom, 1-bathroom units split between two levels. While the property currently provides immediate cash flow, the units are in a non-updated state, offering a prime opportunity for a modern refresh to bring the interiors in line with today's market standards. Strategic updates will allow a new owner to optimize rental income and capture the building's full market potential. The ground floor also includes a shared coin-operated laundr
Key facts
- Smart train station
- 6,930 sq ft lot
- 6 parking spots
Tags
Property features AI
Finance
- HOA & community: No association
Exterior
- Parking: Attached covered parking with capacity for 6 vehicles
- Security: Fire alarm
- Utilities: Public sewer
- Home design: Residential income property (quadruplex); Two stories
- Construction: Property condition varies by unit; fixer condition noted
- Exterior features: Lot includes other features
Interior
- Kitchen: No appliance details provided
- Bedrooms: Each unit has 2 bedrooms (units: four 2-bedroom apartments)
- Bathrooms: Each full unit bathroom: 1 (in three listed units; overall units include full baths)
- Heating & cooling: Wall furnace heating; Ceiling fans
- Interior features: Fire alarm; Two-story building
- Laundry & utility: Coin-operated laundry in common area
Neighborhood map
What this means for you Summary
Snapshot
- This is a 7 × 1-bed/?-bath units multifamily listed at $1.20M.
Deal economics
- At list price, monthly cash flow is $3k ($33k/yr) — positive. Per door: $388/mo.
- The deal already cash-flows at list — no discount required.
- Meets the 1% rule at list price ($14k rent vs $1.20M).
- Recommended offer: $1.16M (3.0% below list) — sets the bar for market timing.
- Cap rate 9.0% vs local median 2.5% in Santa Rosa — top-decile yield for the area; either an underpriced asset or a hidden risk that comps aren't pricing in. Stress-test before assuming the spread holds.
Location & tenants
- Location reads 75/100 on livability (#112 in CA, #3,940 nationally) — a middle-class / working-renter tenant base. Strengths: amenities A+, commute A+, employment A+; Watch: cost of living F.
- Santa Rosa High (urban): math 31% / reading 47% proficiency, ranked #703 of 1,400 in CA (top 50%) — families likely to look elsewhere, expect single-tenant / working-renter base with shorter leases.
- Zoned schools: Steele Lane Elementary (378 students, 69% FRL); Hilliard Comstock Middle (434 students, 60% FRL); Piner High (1,361 students, 51% FRL) — zoned schools average 60% FRL vs 22% district-wide (38 pts higher); higher-poverty schools than district average — tighter screening recommended.
- Market conditions: Rents flat; 202 active listings in the ZIP; solid renter incomes; 1,039 units permitted in Sonoma County in 2024 (185 in 5+ unit buildings).
- At $13,519/mo this rent would consume 165% of the median local household income ($98k/yr) (locally 1770% of renters already pay >50% of income on rent) — very limited rent-growth headroom before tenants either downsize or default.
Forward outlook
- Local home prices are declining (-3.0%/yr); year-one equity from $8k of loan paydown is wiped out by about $36k of value loss. Plan a longer hold.
- Sonoma County population projected at +8% by 2050 — modest demand growth; plan on rents tracking national, not racing it.
Negotiation context
- It's been on market 60 days — a 3% lower offer ($1.16M) is reasonable based on typical stale-listing flexibility.
Questions for the listing agent
- It's been on market 60 days. Have you received any prior offers? Is the seller open to a 3% concession, seller financing, or rate buy-down credit?
- Can we see the unit-by-unit rent roll, current vacancy, and any below-market leases? What's the average tenancy length?
- What capital expenditures (roof, boiler, parking lot, exteriors) have been made in the last 5 years, and what's planned in the next 2?
- Built in 1971 — when were the roof, HVAC, electrical panel, plumbing, and water heater last replaced?
- Is there a deadline driving the sale (1031 exchange, divorce, estate, relocation)? That informs how much negotiation room exists.
- What's the average days-on-market for RENTAL listings here right now (not sales)? A rising rental-DOM trend means longer vacancies and softer asking-rent achievability than the comps imply.
- What's the recent tenant-quality profile in this submarket — average credit score on applications, eviction rate, late-payment / NSF rate, and stable-employment percentage? A property-management company in the area should have these aggregated.
- How much new apartment / multifamily construction is in the pipeline within 1–3 miles? Heavy new supply (>2% of stock underway) typically softens rents 12–24 months out; light construction supports rent growth.
Investment metrics
- 1% rule
- 1.13% ✓
- Cap rate
- 9.01%
- Cash-on-cash
- 9.72%
- DSCR
- 1.43
- GRM
- 7.4
CMA / ARV
- ARV (on-the-fly)
- $1,277,006
- Comps found
- 1
Show comp detail 1 sale within ~0.75 mi
| Address | Dist | Beds/Ba | Sqft | Sold | Price | $/sf | Match |
|---|---|---|---|---|---|---|---|
| 1080 Tijuana Ct | 0.56mi | 8/4.0 | 3,120 (-4%) | 2mo | $1,220,000 | $391 | 64 |
Match score weights: distance 35% · size 25% · config 20% · recency 20%. Top-matched comps best support the ARV.
Projected returns pro-forma
-3.0% appreciation · 0.1% rent growth · sell at horizon
- IRR
- -4.9%
- Equity multiple
- 0.82×
- Total profit
- $-59,487
- Equity at exit
- $178,775
- IRR
- 1.1%
- Equity multiple
- 1.07×
- Total profit
- $22,711
- Equity at exit
- $103,668
Cash invested: $335,720 (down + closing). Projections, not guarantees.
Landlord ↔ Tenant lean methodology
- Overall (STATE)
- 18 Strongly Tenant-Friendly
- State California
- 18 Strongly Tenant-Friendly · D+13
- County
- — inherits STATE
- City
- — inherits STATE
ZIP-level market 95403
- Rents YoY
- 0.1%
- Active inventory
- 202
- Price-to-rent
- 51.7×
Monthly cashflow live
- Estimated rent
- $13,519 medium interval (Pro) →
- Mortgage (P&I)
- −$6,288
- Tax from tax record
- −$1,174 /mo · $14,092/yr
- Insurance
- −$500
- HOA
- −$0
- Vacancy / Maint / Mgmt
- −$2,839
- Net cashflow
- $2,718
Break-even live
Sensitivity live
| Price | -10% $3,397 | -5% $3,058 | +0% $2,718 | +5% $2,379 | +10% $2,040 |
|---|---|---|---|---|---|
| Rent | -10% $1,650 | -5% $2,184 | +0% $2,718 | +5% $3,252 | +10% $3,786 |
| Rate | -1.0pp $3,322 | -0.5pp $3,023 | base $2,718 | +0.5pp $2,408 | +1.0pp $2,092 |
7-unit breakdown (identical units grouped — click to expand)
| Units | Beds | Baths | Est. rent |
|---|---|---|---|
| 7× units | 1 | — | $13,517 |
| #1 | 1 | — | $1,931 |
| #2 | 1 | — | $1,931 |
| #3 | 1 | — | $1,931 |
| #4 | 1 | — | $1,931 |
| #5 | 1 | — | $1,931 |
| #6 | 1 | — | $1,931 |
| #7 | 1 | — | $1,931 |
| Total (7 units) | $13,519 | ||
UW: 25.0% down · 7.5% · 30yr · 1.5% tax · 5.0% vac · 8.0% maint · 8.0% mgmt
Financing live
Cash to close
- Down payment
- $299,750
- Closing costs
- $35,970
- Reserves months
- —
- Total cash needed
- —
Loan-product check · same deal, 3 products live
Conventional
25% down · 7.5% · 30yr
- Down + closing
- —
- Monthly P&I
- —
- Monthly cashflow
- —
- DSCR
- —
- Eligible?
- —
Personal DTI + credit; lowest rate.
DSCR
20% down · 8.5% · 30yr
- Down + closing
- —
- Monthly P&I
- —
- Monthly cashflow
- —
- DSCR
- —
- Eligible?
- —
No personal income docs; deal must DSCR.
Hard money
10% down · 12.0% · 12mo
- Down + closing
- —
- Monthly P&I
- —
- Monthly cashflow
- —
- DSCR
- —
- Eligible?
- —
Short-term bridge; refi at stabilization.
Listing history 26 events
-
2026-06-21days on market $1,199,000 Active 60 DOM
-
2026-06-18days on market $1,199,000 Active 57 DOM
-
2026-06-17days on market $1,199,000 Active 56 DOM
-
2026-06-16days on market $1,199,000 Active 55 DOM
-
2026-06-15days on market $1,199,000 Active 54 DOM
-
2026-06-14days on market $1,199,000 Active 52 DOM
-
2026-06-13days on market $1,199,000 Active 51 DOM
-
2026-06-10days on market $1,199,000 Active 49 DOM
-
2026-06-09days on market $1,199,000 Active 48 DOM
-
2026-06-08days on market $1,199,000 Active 47 DOM
-
2026-06-07days on market $1,199,000 Active 46 DOM
-
2026-06-05days on market $1,199,000 Active 43 DOM
-
2026-06-03days on market $1,199,000 Active 42 DOM
-
2026-06-03price $1,199,000 Active 41 DOM
-
2026-06-02days on market $1,249,000 Active 41 DOM
-
2026-06-01days on market $1,249,000 Active 40 DOM
-
2026-05-31days on market $1,249,000 Active 39 DOM
-
2026-05-30days on market $1,249,000 Active 38 DOM
-
2026-04-22$1,249,000 Active
-
2019-04-26soldstatus $1,100,000
-
2007-03-15soldstatus $625,000
-
2001-06-26soldstatus $510,000
-
1993-03-29soldstatus $325,000
-
1988-11-16soldstatus $262,500
-
1988-11-16soldstatus $262,500
-
1987-07-31soldstatus $228,000
ⓘ Source: listings_history table (triggers on properties + properties_extension) + one-shot
backfill from property_details.listing_events for pre-trigger history.
Tax reassessment forecast CA · Resets to sale price
- Current annual tax
- $14,092 · $1,174/mo
- Projected year-2 tax
- $14,092 · $1,174/mo
- Expected delta
- $0/yr ($0/mo · 0.0%)
ⓘ Screening estimate from a state-policy table — verify with the county assessor before closing.
Climate risk First Street
- Flood 1/10 Low FEMA zone X (unshaded) · 0% chance over 30 yrs
- Wildfire 2/10 Low
- Heat 4/10 Moderate 7 d/yr ≥92°F today · 16 d/yr by 30 yrs out
- Wind 1/10 Low
- Air quality 10/10 Extreme 21 unhealthy d/yr today · 21 by 30 yrs out
Nearby sold comps map
Loading sold comps map…
Walkable amenities ~0.75 mi
Loading nearby amenities…
Taxation est. · year 1
- Rental income
- $162,228
- − Mortgage interest
- −$67,163
- − Property taxes
- −$14,092
- − Insurance
- −$5,995
- − Repairs & maintenance
- −$12,978
- − Management
- −$12,978
- − Depreciation
- −$34,880
- Taxable income
- $14,141
- Est. tax owed @ 24.0%
- −$3,394
- After-tax cash flow
- $29,226/yr
For passive investors: Depreciation is non-cash, so a rental often shows a tax loss while cash-flowing — sheltering income. Rental losses are passive: they offset passive income freely, and up to $25,000/yr can offset ordinary (W-2) income if you actively participate and your MAGI is under $100k (phasing out to $0 by $150k); unused losses carry forward. On sale, claimed depreciation is recaptured at up to 25%, and gains may owe capital-gains tax (a 1031 exchange can defer both). Figures are a year-1 estimate at your 24.0% rate — not tax advice; consult a CPA.
Schools (NCES district)
- District
- Santa Rosa High
- NCES district ID
- 0635830
- Math proficiency
- 31% —
- Reading proficiency
- 47% —
- Median HH income
- $62,000
- Composite
- 37.25/100
- National rank
- #8972
- State rank
- #703 of 1400 in CA
Livability — Santa Rosa
- Score
- 75/100
- State rank
- #112
- US rank
- #3940
Category grades
Schools grade is shown separately in the Schools card above.
Census & demographics
- Census place
- Santa Rosa, CA
- County
- Sonoma County · 449,805 people
- City population
- 210,074
- Metro
- Santa Rosa-Petaluma, CA
- Population (ZIP)
- 45,806
- Household income
- $98,191
- Rent vs Own
- Severe rent burden
- 1770.0
Population outlook (Sonoma County) Hauer SSP2
- Today (2025)
- 539,935 people
- By 2030
- 554,870 · +2.8%
- By 2040
- 573,262 · +6.2%
- By 2050
- 580,715 · +7.6%
- By 2075
- 579,229 · +7.3%
- By 2100
- 547,835 · +1.5%
Race, ethnicity, and origin ACS 2023
- Neighborhood character
- Diverse neighborhood (Simpson 0.61)
- Race & ethnicity
- White 50% Hispanic / Latino 37% Two or more races 13% Asian 5% Native American 2% Black 2%
- Hispanic origin (detail)
- Mexican 31%
- Common ancestry
- Italian 3% Slovak 2% Lithuanian 2%
- Foreign-born
- 20% · Canada, Vietnam, South Korea
- Languages at home
- 67% English-only · Spanish 26% Other Indo-European 1% Vietnamese 1%
Political lean MEDSL · Sonoma
- 2024 margin
- Solid D (+46.2) · D 71.4% · R 25.2% · Other 3.3%
- 2008→2024 swing
- -3.4pp toward R · 2008: 49.6pp · 2024: 46.2pp
- All cycles
- 2024: D+46.2 2020: D+51.5 2016: D+47.9 2012: D+44.9 2008: D+49.6
Not yet ingested
- Civics
- —
Market trends
- HPI YoY
- ▼ -679.94%
- Current HPI
- 254.3106
- Rent YoY
- ▲ 0.10%
- Metro
- Santa Rosa-Petaluma, CA
- State GDP YoY
- ▲ 3.21%
- F500 in state
- 116
Industry mix (Fortune 500 HQ in CA)
| Industry | F500 HQs | Revenue |
|---|---|---|
| Technology | 27 | $1,492B |
|
||
| Financial Services | 3 | $174B |
|
||
| Retail | 3 | $44B |
|
||
| Insurance | 3 | $26B |
|
||
| Media / Entertainment | 2 | $115B |
|
||
| Pharmaceuticals / Biotech | 2 | $62B |
|
||
Price history
+447.8% since first listed8 events — show timeline
- 2026-04-22 Listed $1,249,000 BAREIS
- 2019-04-26 Sold (Public Records) $1,100,000 Public Records
- 2007-03-15 Sold (Public Records) $625,000 Public Records
- 2001-06-26 Sold (Public Records) $510,000 Public Records
- 1993-03-29 Sold (Public Records) $325,000 Public Records
- 1988-11-16 Sold (Public Records) $262,500 Public Records
- 1988-11-16 Sold (Public Records) $262,500 Public Records
- 1987-07-31 Sold (Public Records) $228,000 Public Records
Property tax history
+4.0%/yrLatest (2025): $14,092 · +1.5% YoY. Source: county tax records.
Cash-flow waterfall
monthlySold comps — $/sqft
last 12 mo · ≤1 miLoading sold comps…