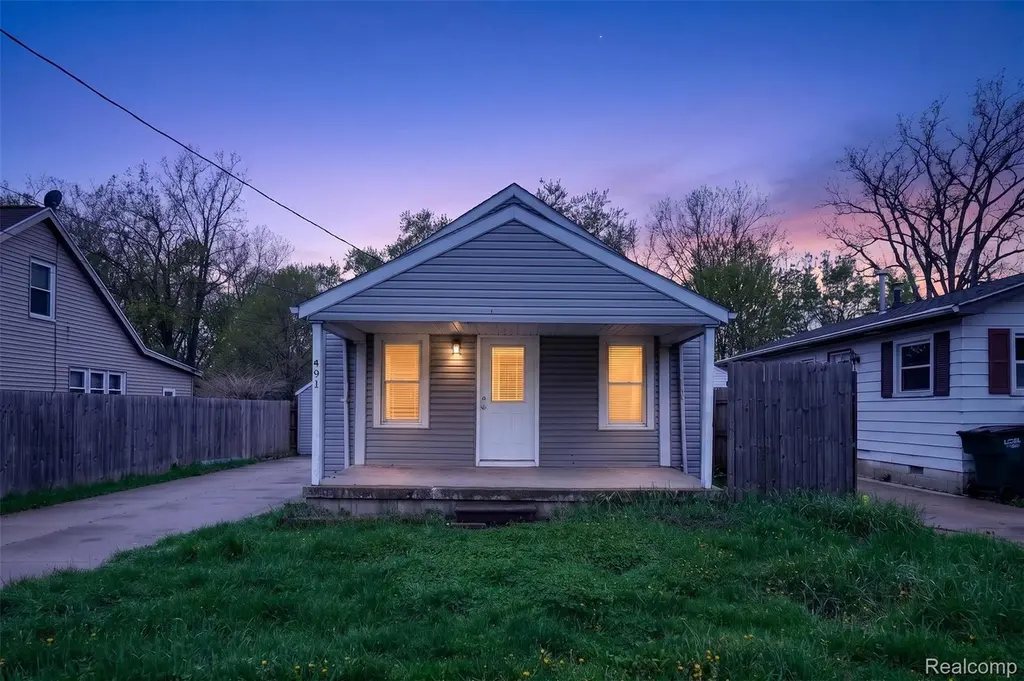
4910 Hughes Rd · Lansing, MI
Flood risk 1/10 · Minimal
- FEMA flood zone
- X (unshaded)
- Chance of flooding over 30 yrs
- 0.0%
- Est. flood insurance / yr
- $507 – $1,088
Fire risk 1/10 · Minimal
- Est. fire insurance / yr
- $784 – $1,456
Heat risk 2/10 · Minimal
- Hot days now (above 97°F)
- 7 days/yr
- Hot days in 30 yrs
- 15 days/yr
Wind risk 2/10 · Minimal
- Chance of severe wind over 30 yrs
- —
Air-quality risk 2/10 · Minimal
- Unhealthy air days now
- 1 days/yr
- Unhealthy air days in 30 yrs
- 2 days/yr
Risk factors via First Street. Map © Google.
Why this score? — see what drove the B- grade
The composite is a weighted blend of 9 inputs, each scored 0–100. Each bar is that input's sub-score; the figure is the points it added to the 100-point composite (weight × sub-score).
- Cash flow +30.0/30.0
- 1% rule +10.0/10.0
- DSCR +10.0/10.0
- ARV discount +6.6/15.0
- Livability +4.0/5.0
- Rent growth +3.7/5.0
- Condition / age +2.5/5.0
- Schools +1.9/10.0
- Appreciation +0.0/10.0
$69,900
🖨 Deal sheet (PDF) 📄 Offer letter ✓ Due diligence
Listing remarks MLS
Great cozy ranch with lots of updates including new floors, new kitchen, fresh paint, updated fully tiled bathroom. One detached car garage & a large & spacious backyard.
Key facts
- New floors
- New kitchen
- Detached car garage
Tags
Property features AI
Exterior
- Parking: Detached 1-car garage
- Utilities: Public water; Public sewer; Sewer available
- Home design: Single-family residence; One story; Ground-level entry with steps; Shingle and vinyl siding
- Construction: Shingle siding; Vinyl siding
- Exterior features: Paved road access; Lot approximately 0.2 acres (40 x 212); Crawl space basement
Interior
- Kitchen: Free-standing gas range; Free-standing refrigerator; Disposal; Range hood
- Bathrooms: 1 full bathroom
- Heating & cooling: Forced air heating (natural gas); No central cooling
- Interior features: Disposal; Range hood
Neighborhood map
What this means for you Summary
Snapshot
- This is a 2-bed/1.0-bath single-family listed at $70k.
Deal economics
- At list price, monthly cash flow is $291 ($3k/yr) — positive.
- The deal already cash-flows at list — no discount required.
- Meets the 1% rule at list price ($1k rent vs $70k).
- Recommended offer: $68k (3.0% below list) — sets the bar for market timing.
- Cap rate 11.3% vs local median 6.0% in Lansing — top-decile yield for the area; either an underpriced asset or a hidden risk that comps aren't pricing in. Stress-test before assuming the spread holds.
Location & tenants
- Location reads 79/100 on livability (#94 in MI, #2,182 nationally) — a middle-class / working-renter tenant base. Strengths: amenities A+, commute A+, cost of living A+; Watch: employment D, crime F.
- Lansing Public School District (urban): math 14% / reading 23% proficiency, ranked #650 of 760 in MI (top 86%) — low school quality limits family demand, transient renter base, plan for 1-2y turnover; 68% free/reduced lunch — lower-income household profile, screen leases tightly.
- Zoned schools: Cavanaugh School (315 students, 89% FRL); Attwood School (193 students, 88% FRL) — zoned schools average 88% FRL vs 68% district-wide (21 pts higher); higher-poverty schools than district average — tighter screening recommended.
- Market conditions: Rents rising fast (+4.7%/yr); 175 active listings in the ZIP; 9 comparable units currently listed for rent nearby; rentals at typical pace (median 16d on market — plan ~3-4 weeks tenant-placement turnaround); 350 units permitted in Ingham County in 2024 (186 in 5+ unit buildings).
Forward outlook
- Local home prices are declining (-3.0%/yr); year-one equity from $483 of loan paydown is wiped out by about $2k of value loss. Plan a longer hold.
- Ingham County population projected at +11% by 2050 — modest demand growth; plan on rents tracking national, not racing it.
- At projected returns (-3.0% appreciation + 4.7% rent growth), your $20k cash investment doubles in ~6 years — after that, you're playing with house money.
Negotiation context
- It's been on market 60 days — a 3% lower offer ($68k) is reasonable based on typical stale-listing flexibility.
- 8 sale attempts since 19y ago; this cycle's ask has dropped $20k (22%) from the opening price — seller is motivated, your offer sets the floor, not the list.
- Current owner paid $35k; list at $70k implies a 100% gain — meaningful room to come down on a strong offer.
Risks & watch-outs
- Watch-outs: property tax is 3.3% of price; built in 1941 — expect roof / HVAC / electrical / plumbing capex.
Questions for the listing agent
- It's been on market 60 days. Have you received any prior offers? Is the seller open to a 3% concession, seller financing, or rate buy-down credit?
- Built in 1941 — when were the roof, HVAC, electrical panel, plumbing, and water heater last replaced?
- Property tax is high relative to price — has the assessment been appealed recently, and will the sale trigger a re-assessment?
- Is there a deadline driving the sale (1031 exchange, divorce, estate, relocation)? That informs how much negotiation room exists.
- Schools are F-rated, which usually means shorter tenancies and higher turnover. Who's the typical renter profile here, and what's been the actual vacancy rate?
- Crime grade is F in this area — have there been break-ins, vandalism, or insurance claims at this property in the last 3 years? What carrier currently insures it and at what premium?
- What's the average days-on-market for RENTAL listings here right now (not sales)? A rising rental-DOM trend means longer vacancies and softer asking-rent achievability than the comps imply.
- What's the recent tenant-quality profile in this submarket — average credit score on applications, eviction rate, late-payment / NSF rate, and stable-employment percentage? A property-management company in the area should have these aggregated.
- How much new for-sale + rental construction is in the pipeline within 1–3 miles? Heavy new supply typically softens prices + rents 12–24 months out; constrained supply supports both.
Investment metrics
- 1% rule
- 1.59% ✓
- Cap rate
- 11.29%
- Cash-on-cash
- 17.86%
- DSCR
- 1.79
- GRM
- 5.2
CMA / ARV
- ARV (median comp)
- $68,601
- List price
- $69,900
- Delta
- 1.89%
- Verdict
- FAIR
- Comps
- 20 within 1.0 mi
Show comp detail 2 sales within ~0.75 mi
| Address | Dist | Beds/Ba | Sqft | Sold | Price | $/sf | Match |
|---|---|---|---|---|---|---|---|
| 4810 Sidney St | 0.37mi | 2/1.0 | 570 (+3%) | 19mo | $79,900 | $140 | 61 |
| 4607 Pleasant Grove Rd | 0.24mi | 2/1.0 | 594 (+8%) | 20mo | $52,500 | $88 | 60 |
Match score weights: distance 35% · size 25% · config 20% · recency 20%. Top-matched comps best support the ARV.
Projected returns pro-forma
-3.0% appreciation · 4.71% rent growth · sell at horizon
- IRR
- 11.6%
- Equity multiple
- 1.47×
- Total profit
- $9,244
- Equity at exit
- $10,422
- IRR
- 22.1%
- Equity multiple
- 3.07×
- Total profit
- $40,516
- Equity at exit
- $6,044
Cash invested: $19,572 (down + closing). Projections, not guarantees.
Landlord ↔ Tenant lean methodology
- Overall (STATE)
- 62 Landlord-Friendly
- State Michigan
- 62 Landlord-Friendly · EVEN
- County
- — inherits STATE
- City
- — inherits STATE
ZIP-level market 48910
- Rents YoY
- 4.7%
- Active inventory
- 175
- Price-to-rent
- 5.2×
Monthly cashflow live
- Estimated rent
- $1,111 high interval (Pro) →
- Mortgage (P&I)
- −$367
- Tax from tax record
- −$190 /mo · $2,285/yr
- Insurance
- −$29
- HOA
- −$0
- Vacancy / Maint / Mgmt
- −$233
- Net cashflow
- $291
Break-even live
Sensitivity live
| Price | -10% $331 | -5% $311 | +0% $291 | +5% $271 | +10% $252 |
|---|---|---|---|---|---|
| Rent | -10% $203 | -5% $247 | +0% $291 | +5% $335 | +10% $379 |
| Rate | -1.0pp $326 | -0.5pp $309 | base $291 | +0.5pp $273 | +1.0pp $255 |
UW: 25.0% down · 7.5% · 30yr · 1.5% tax · 5.0% vac · 8.0% maint · 8.0% mgmt
Financing live
Cash to close
- Down payment
- $17,475
- Closing costs
- $2,097
- Reserves months
- —
- Total cash needed
- —
Loan-product check · same deal, 3 products live
Conventional
25% down · 7.5% · 30yr
- Down + closing
- —
- Monthly P&I
- —
- Monthly cashflow
- —
- DSCR
- —
- Eligible?
- —
Personal DTI + credit; lowest rate.
DSCR
20% down · 8.5% · 30yr
- Down + closing
- —
- Monthly P&I
- —
- Monthly cashflow
- —
- DSCR
- —
- Eligible?
- —
No personal income docs; deal must DSCR.
Hard money
10% down · 12.0% · 12mo
- Down + closing
- —
- Monthly P&I
- —
- Monthly cashflow
- —
- DSCR
- —
- Eligible?
- —
Short-term bridge; refi at stabilization.
Rent comps 9 comps
| Address | Beds | Baths | Sqft | Rent | $/sqft | DOM | Units | Dist |
|---|---|---|---|---|---|---|---|---|
| 4318 Pleasant Grove Rd Lansing, MI | 1.0–3.0 | 1.0–2.0 | 722 | $1,125 | $1.56 | 15d | 1 | 0.36mi |
| 2114 Ferrol St Unit 1 Lansing, MI | 2.0 | 1.0 | 700 | $950 | $1.36 | 23d | 1 | 0.69mi |
| 3606 Pleasant Grove Rd Lansing, MI | 1.0–2.0 | 1.0 | 812 | $1,100 | $1.35 | 45d | 1 | 0.75mi |
| 1001 W Cavanaugh Rd Lansing, MI | 1.0–2.0 | 1.0 | 775 | $850 | $1.10 | 15d | 4 | 0.76mi |
| 911 W Cavanaugh Rd Lansing, MI | 1.0–2.0 | 1.0 | 775 | $1,000 | $1.29 | 23d | 1 | 0.80mi |
| 3334 Pleasant Grove Rd Unit 19 Lansing, MI | 2.0 | 1.0 | 700 | $999 | $1.43 | 15d | 1 | 0.94mi |
| 2010 Georgetown Blvd Lansing, MI | 1.0–2.0 | 1.0 | 836 | $1,188 | $1.42 | 15d | 8 | 1.32mi |
| 915 Loa St Lansing, MI | 2.0 | 1.0 | 674 | $999 | $1.48 | 45d | 1 | 1.32mi |
| 4030 Hartford Rd Lansing, MI | 1.0–2.0 | 1.0 | 640 | $1,094 | $1.71 | 15d | 42 | 1.40mi |
Listing history 40 events
-
2026-06-21days on market $69,900 Active 60 DOM
-
2026-06-18days on market $69,900 Active 57 DOM
-
2026-06-17days on market $69,900 Active 56 DOM
-
2026-06-16days on market $69,900 Active 55 DOM
-
2026-06-15pricedays on market $69,900 Active 54 DOM
-
2026-06-14days on market $74,900 Active 52 DOM
-
2026-06-13days on market $74,900 Active 51 DOM
Show marketing remark (182 chars)
Great cozy ranch with lots of updates including new floors, new kitchen, fresh paint, updated fully tiled bathroom. One detached car garage & a large & spacious backyard.
-
2026-06-10days on market $74,900 Active 49 DOM
-
2026-06-09days on market $74,900 Active 48 DOM
-
2026-06-08days on market $74,900 Active 47 DOM
-
2026-06-07days on market $74,900 Active 46 DOM
-
2026-06-05pricedays on market $74,900 Active 43 DOM
-
2026-06-03days on market $79,900 Active 42 DOM
-
2026-06-02days on market $79,900 Active 41 DOM
-
2026-06-01days on market $79,900 Active 40 DOM
-
2026-05-31days on market $79,900 Active 39 DOM
-
2026-05-30days on market $79,900 Active 38 DOM
-
2026-04-23price $79,900 182-char remark
Show marketing remark (182 chars)
Great cozy ranch with lots of updates including new floors, new kitchen, fresh paint, updated fully tiled bathroom. One detached car garage & a large & spacious backyard.
-
2026-04-23price $79,900 182-char remark
Show marketing remark (182 chars)
Great cozy ranch with lots of updates including new floors, new kitchen, fresh paint, updated fully tiled bathroom. One detached car garage & a large & spacious backyard.
-
2026-04-22$89,900 Active 182-char remark
Show marketing remark (182 chars)
Great cozy ranch with lots of updates including new floors, new kitchen, fresh paint, updated fully tiled bathroom. One detached car garage & a large & spacious backyard.
-
2026-04-22$89,900 Active 182-char remark
Show marketing remark (182 chars)
Great cozy ranch with lots of updates including new floors, new kitchen, fresh paint, updated fully tiled bathroom. One detached car garage & a large & spacious backyard.
-
2023-11-08historical
-
2023-11-08historical
-
2023-11-01price $72,900
-
2023-09-28$72,900
-
2023-09-28$74,900 Active
-
2023-09-27historical
-
2023-09-27historical
-
2023-09-05price $79,900
-
2023-09-05price $79,900
-
2023-08-18$89,900 Active
-
2023-08-18$89,900 Active
-
2023-08-12historical
-
2023-08-12historical
-
2011-03-23soldstatus $35,000
-
2011-02-16soldstatus $21,000
-
2008-06-30soldstatus $17,000
-
2008-04-11$24,900
-
2007-08-24historical
-
2007-06-11$40,000
ⓘ Source: listings_history table (triggers on properties + properties_extension) + one-shot
backfill from property_details.listing_events for pre-trigger history.
Tax reassessment forecast MI · Partial reset (capped growth)
- Current annual tax
- $2,285 · $190/mo
- Projected year-2 tax
- $2,285 · $190/mo
- Expected delta
- $0/yr ($0/mo · 0.0%)
ⓘ Screening estimate from a state-policy table — verify with the county assessor before closing.
Climate risk First Street
- Flood 1/10 Low FEMA zone X (unshaded) · 0% chance over 30 yrs
- Wildfire 1/10 Low
- Heat 2/10 Low 7 d/yr ≥97°F today · 15 d/yr by 30 yrs out
- Wind 2/10 Low
- Air quality 2/10 Low 1 unhealthy d/yr today · 2 by 30 yrs out
Nearby sold comps map
Loading sold comps map…
Walkable amenities ~0.75 mi
Loading nearby amenities…
Taxation est. · year 1
- Rental income
- $13,326
- − Mortgage interest
- −$3,915
- − Property taxes
- −$2,285
- − Insurance
- −$350
- − Repairs & maintenance
- −$1,066
- − Management
- −$1,066
- − Depreciation
- −$2,033
- Taxable income
- $2,611
- Est. tax owed @ 24.0%
- −$627
- After-tax cash flow
- $2,868/yr
For passive investors: Depreciation is non-cash, so a rental often shows a tax loss while cash-flowing — sheltering income. Rental losses are passive: they offset passive income freely, and up to $25,000/yr can offset ordinary (W-2) income if you actively participate and your MAGI is under $100k (phasing out to $0 by $150k); unused losses carry forward. On sale, claimed depreciation is recaptured at up to 25%, and gains may owe capital-gains tax (a 1031 exchange can defer both). Figures are a year-1 estimate at your 24.0% rate — not tax advice; consult a CPA.
Schools (NCES district)
- District
- Lansing Public School District
- NCES district ID
- 2621150
- Math proficiency
- 14% ▲ 1.00%
- Reading proficiency
- 23% ▲ 3.00%
- Median HH income
- $37,453
- Composite
- 18.76/100
- National rank
- #14002
- State rank
- #650 of 760 in MI
Livability — Lansing
- Score
- 79/100
- State rank
- #94
- US rank
- #2182
Category grades
Schools grade is shown separately in the Schools card above.
Census & demographics
- Census place
- Lansing, MI
- County
- Ingham County · 237,052 people
- City population
- 161,269
- Metro
- Lansing-East Lansing, MI
- Population (ZIP)
- 32,800
- Household income
- $54,712
- Rent vs Own
- Severe rent burden
- 1305.0
Population outlook (Ingham County) Hauer SSP2
- Today (2025)
- 300,362 people
- By 2030
- 307,808 · +2.5%
- By 2040
- 320,492 · +6.7%
- By 2050
- 333,223 · +10.9%
- By 2075
- 373,693 · +24.4%
- By 2100
- 392,021 · +30.5%
Race, ethnicity, and origin ACS 2023
- Neighborhood character
- Diverse neighborhood (Simpson 0.62)
- Race & ethnicity
- White 58% Black 16% Hispanic / Latino 12% Two or more races 12% Asian 4% Native American 1%
- Hispanic origin (detail)
- Mexican 9% Cuban 2%
- Common ancestry
- Romanian 5% Lithuanian 3% Slovak 2%
- Foreign-born
- 9% · Canada, China, Vietnam
- Languages at home
- 87% English-only · Spanish 6% Chinese 1% Other Indo-European 1%
Political lean MEDSL · Ingham
- 2024 margin
- Strong D (+29.7) · D 63.9% · R 34.2% · Other 2.0%
- 2008→2024 swing
- -3.6pp toward R · 2008: 33.3pp · 2024: 29.7pp
- All cycles
- 2024: D+29.7 2020: D+32.2 2016: D+27.6 2012: D+27.9 2008: D+33.3
Not yet ingested
- Civics
- —
Market trends
- HPI YoY
- ▼ -211.82%
- Current HPI
- 196.8087
- Rent YoY
- ▲ 4.71%
- Metro
- Lansing-East Lansing, MI
- State GDP YoY
- ▲ 1.37%
- F500 in state
- 28
Industry mix (Fortune 500 HQ in MI)
| Industry | F500 HQs | Revenue |
|---|---|---|
| Automotive Parts | 3 | $48B |
|
||
| Automotive | 2 | $372B |
|
||
| Chemicals | 1 | $45B |
|
||
| Automotive Retail | 1 | $29B |
|
||
| Healthcare / Medical Devices | 1 | $23B |
|
||
| Automotive Technology | 1 | $20B |
|
||
Price history
+74.8% since first listed27 events — show timeline
- 2026-06-14 Price Changed $69,900 REALCOMP
- 2026-06-13 Price Changed $69,900 MiRealSource-MiMLS
- 2026-06-04 Price Changed $74,900 MiRealSource-MiMLS
- 2026-06-03 Price Changed $74,900 REALCOMP
- 2026-04-23 Price Changed $79,900 MiRealSource-MiMLS
- 2026-04-23 Price Changed $79,900 REALCOMP
- 2026-04-22 Listed $89,900 MiRealSource-MiMLS
- 2026-04-22 Listed $89,900 REALCOMP
- 2023-11-08 Listing Removed — Greater Lansing AoR
- 2023-11-08 Listing Removed — REALCOMP
- 2023-11-01 Price Changed $72,900 Greater Lansing AoR
- 2023-09-28 Listed $74,900 Greater Lansing AoR
- 2023-09-28 Listed $72,900 REALCOMP
- 2023-09-27 Listing Removed — MiRealSource-MiMLS
- 2023-09-27 Listing Removed — REALCOMP
- 2023-09-05 Price Changed $79,900 MiRealSource-MiMLS
- 2023-09-05 Price Changed $79,900 REALCOMP
- 2023-08-18 Listed $89,900 MiRealSource-MiMLS
- 2023-08-18 Listed $89,900 REALCOMP
- 2023-08-12 Coming Soon — MiRealSource-MiMLS
- 2023-08-12 Coming Soon — REALCOMP
- 2011-03-23 Sold (Public Records) $35,000 Public Records
- 2011-02-16 Sold (Public Records) $21,000 Public Records
- 2008-06-30 Sold (MLS) $17,000 Greater Lansing AoR
- 2008-04-11 Listed $24,900 Greater Lansing AoR
- 2007-08-24 Listing Removed — Greater Lansing AoR
- 2007-06-11 Listed $40,000 Greater Lansing AoR
Property tax history
+9.6%/yrLatest (2025): $2,285 · +3.0% YoY. Source: county tax records.
Cash-flow waterfall
monthlySold comps — $/sqft
last 12 mo · ≤1 miLoading sold comps…