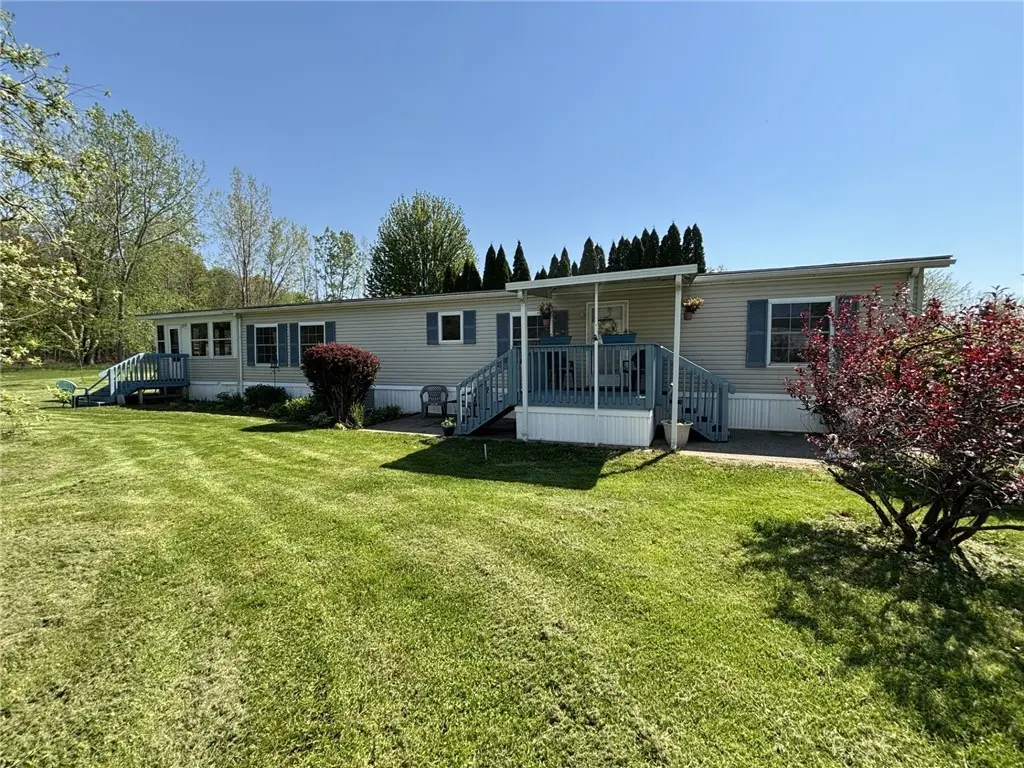
305 Sunset Dr · Holley, NY
Flood risk 1/10 · Minimal
- FEMA flood zone
- —
- Chance of flooding over 30 yrs
- 0.0%
- Est. flood insurance / yr
- —
Fire risk 3/10 · Minor
- Est. fire insurance / yr
- $691 – $1,283
Heat risk 2/10 · Minimal
- Hot days now (above 94°F)
- 7 days/yr
- Hot days in 30 yrs
- 16 days/yr
Wind risk 1/10 · Minimal
- Chance of severe wind over 30 yrs
- —
Air-quality risk 2/10 · Minimal
- Unhealthy air days now
- 1 days/yr
- Unhealthy air days in 30 yrs
- 2 days/yr
Risk factors via First Street. Map © Google.
Why this score? — see what drove the B- grade
The composite is a weighted blend of 9 inputs, each scored 0–100. Each bar is that input's sub-score; the figure is the points it added to the 100-point composite (weight × sub-score).
- Cash flow +30.0/30.0
- 1% rule +10.0/10.0
- DSCR +10.0/10.0
- ARV discount +5.5/15.0
- Condition / age +3.8/5.0
- Schools +3.5/10.0
- Livability +3.2/5.0
- Rent growth +2.5/5.0
- Appreciation +0.0/10.0
$79,900
🖨 Deal sheet 📄 Offer letter ✓ Due diligence
Listing remarks
Delayed Negotiations May 27th 1pm. Located at Heron Falls just a few minutes from Brockport (Shopping, Banking, Car Wash, Groceries and more! Come see this well maintained 3-bedroom, 2 bath with an open floor plan. Home ss in Clarendon on Rte31a South side. Nice size bedroom . Home backs up to the woods for a quiet backyard and 2 sheds. Lot rent is $740.00
Key facts
- Open floor plan
- 2 sheds
- Quiet backyard
Tags
Property features AI
Finance
- HOA & community: Land lease of $740
Exterior
- Parking: No garage; Driveway parking
- Utilities: Cable available; High-speed internet available; Public water (connected); Sewer connected; Circuit breaker electrical system
- Home design: Double-wide mobile home; Single-story; Resale property; Titan make
- Construction: Vinyl siding; Architectural shingle roof; Existing structure
- Exterior features: Blacktop driveway; Deck; Enclosed porch; Open porch; Patio; Propane tank (leased); Shed(s)/storage
Interior
- Kitchen: Gas oven and gas range; Range hood; Dishwasher; Refrigerator; Exhaust fan
- Bedrooms: Three main-level bedrooms
- Flooring: Carpet; Luxury vinyl; Vinyl; Varied flooring
- Bathrooms: Two full bathrooms (both on the main level)
- Heating & cooling: Propane heating; Central air conditioning
- Interior features: Ceiling fans; Cathedral ceilings; Separate/formal dining room; Eat-in kitchen; Separate/formal living room; Combined living/dining room; Sliding glass doors; Bath in primary bedroom; Primary bedroom on main level; Thermal windows; Sliding doors
- Laundry & utility: Main-level laundry; Washer and dryer; Electric and propane water heaters
Neighborhood map
What this means for you Summary
Snapshot
- This is a 3-bed/2.0-bath manufactured listed at $80k. Condition is rated good.
Deal economics
- At list price, monthly cash flow is $499 ($6k/yr) — positive.
- The deal already cash-flows at list — no discount required.
- Meets the 1% rule at list price ($1k rent vs $80k).
- Recommended offer: $79k (1.5% below list) — sets the bar for market timing.
- Cap rate 13.8% vs local median 4.4% in Holley — top-decile yield for the area; either an underpriced asset or a hidden risk that comps aren't pricing in. Stress-test before assuming the spread holds.
Location & tenants
- Location reads 65/100 on livability (#705 in NY) — a middle-class / working-renter tenant base. Strengths: cost of living A+, housing A+, crime A-; Watch: schools D, amenities F, commute F.
- Holley Central School District (town): math 38% / reading 44% proficiency, ranked #505 of 590 in NY (top 86%) — families likely to look elsewhere, expect single-tenant / working-renter base with shorter leases.
- Market conditions: 43 active listings in the ZIP; 28 units permitted in Orleans County in 2024 (0 in 5+ unit buildings).
Forward outlook
- Local home prices are declining (-3.0%/yr); year-one equity from $552 of loan paydown is wiped out by about $2k of value loss. Plan a longer hold.
- Orleans County population projected at -20% by 2050 — secular population decline; favor cash flow + early exit over multi-decade hold.
- At projected returns (-3.0% appreciation + 3.0% rent growth), your $22k cash investment doubles in ~5 years — after that, you're playing with house money.
Negotiation context
- It's been on market 15 days — a 2% lower offer ($79k) is reasonable based on typical stale-listing flexibility.
Questions for the listing agent
- Is there a deadline driving the sale (1031 exchange, divorce, estate, relocation)? That informs how much negotiation room exists.
- Schools are D-rated, which usually means shorter tenancies and higher turnover. Who's the typical renter profile here, and what's been the actual vacancy rate?
- What's the average days-on-market for RENTAL listings here right now (not sales)? A rising rental-DOM trend means longer vacancies and softer asking-rent achievability than the comps imply.
- What's the recent tenant-quality profile in this submarket — average credit score on applications, eviction rate, late-payment / NSF rate, and stable-employment percentage? A property-management company in the area should have these aggregated.
- How much new for-sale + rental construction is in the pipeline within 1–3 miles? Heavy new supply typically softens prices + rents 12–24 months out; constrained supply supports both.
Investment metrics
- 1% rule
- 1.63% ✓
- Cap rate
- 13.79%
- Cash-on-cash
- 26.79%
- DSCR
- 2.19
- GRM
- 5.1
CMA / ARV
- ARV (on-the-fly)
- $76,440
- Comps found
- 12
Show comp detail 12 sales within ~0.75 mi
| Address | Dist | Beds/Ba | Sqft | Sold | Price | $/sf | Match |
|---|---|---|---|---|---|---|---|
| 299 Sunset Dr | 0.03mi | 3/2.0 | 1,568 (+0%) | 10mo | $50,100 | $32 | 89 |
| 211 Sunset Dr | 0.30mi | 2/2.0 (-1) | 1,568 (+0%) | 1mo | $45,000 | $29 | 79 |
| 155 Trinity Dr | 0.11mi | 3/2.0 | 1,512 (-3%) | 13mo | $55,000 | $36 | 79 |
| 128 Trinity Drive Dr | 0.20mi | 3/2.0 | 1,680 (+8%) | 1mo | $82,500 | $49 | 77 |
| 283 Sunset Dr | 0.12mi | 3/2.0 | 1,456 (-7%) | 11mo | $47,500 | $33 | 74 |
| 291 Sunset Dr | 0.08mi | 3/2.0 | 1,440 (-8%) | 18mo | $70,000 | $49 | 68 |
| 537 Rockview Dr | 0.43mi | 3/2.0 | 1,624 (+4%) | 7mo | $94,000 | $58 | 67 |
| 225 Sunset Dr | 0.35mi | 3/2.0 | 1,680 (+8%) | 8mo | $103,000 | $61 | 65 |
| 903 Cobblestone Ct | 0.39mi | 4/2.0 (+1) | 1,496 (-4%) | 12mo | $117,000 | $78 | 60 |
| 525 Rockview Dr | 0.43mi | 3/2.0 | 1,612 (+3%) | 19mo | $66,000 | $41 | 58 |
| 127 Trinity Dr | 0.26mi | 3/2.5 | 1,792 (+15%) | 11mo | $62,000 | $35 | 52 |
| 4694 Hall Rd | 0.41mi | 3/2.0 | 1,344 (-14%) | 15mo | $170,000 | $126 | 45 |
Match score weights: distance 35% · size 25% · config 20% · recency 20%. Top-matched comps best support the ARV.
Projected returns pro-forma
-3.0% appreciation · 3.0% rent growth · sell at horizon
- IRR
- 20.7%
- Equity multiple
- 1.84×
- Total profit
- $18,864
- Equity at exit
- $11,913
- IRR
- 28.9%
- Equity multiple
- 3.57×
- Total profit
- $57,402
- Equity at exit
- $6,908
Cash invested: $22,372 (down + closing). Projections, not guarantees.
Landlord ↔ Tenant lean methodology
- Overall (STATE)
- 15 Strongly Tenant-Friendly
- State New York
- 15 Strongly Tenant-Friendly · D+10
- County
- — inherits STATE
- City
- — inherits STATE
ZIP-level market 14470
- Home prices YoY
- -10.8%
- Active inventory
- 43
- Price-to-rent
- 5.1×
Monthly cashflow live
- Estimated rent
- $1,300 medium interval (Pro) →
- Mortgage (P&I)
- −$419
- Tax from tax record
- −$75 /mo · $902/yr
- Insurance
- −$33
- HOA
- −$0
- Vacancy / Maint / Mgmt
- −$273
- Net cashflow
- $499
Break-even live
UW: 25.0% down · 7.5% · 30yr · 1.5% tax · 5.0% vac · 8.0% maint · 8.0% mgmt
Financing live
Cash to close
- Down payment
- $19,975
- Closing costs
- $2,397
- Reserves months
- —
- Total cash needed
- —
Loan-product check · same deal, 3 products live
Conventional
25% down · 7.5% · 30yr
- Down + closing
- —
- Monthly P&I
- —
- Monthly cashflow
- —
- DSCR
- —
- Eligible?
- —
Personal DTI + credit; lowest rate.
DSCR
20% down · 8.5% · 30yr
- Down + closing
- —
- Monthly P&I
- —
- Monthly cashflow
- —
- DSCR
- —
- Eligible?
- —
No personal income docs; deal must DSCR.
Hard money
10% down · 12.0% · 12mo
- Down + closing
- —
- Monthly P&I
- —
- Monthly cashflow
- —
- DSCR
- —
- Eligible?
- —
Short-term bridge; refi at stabilization.
Listing history 6 events
-
2026-06-07statusdays on market $79,900 Pending 15 DOM
-
2026-06-03days on market $79,900 Active 14 DOM
-
2026-06-03days on market $79,900 Active 13 DOM
-
2026-06-01days on market $79,900 Active 12 DOM
-
2026-05-31days on market $79,900 Active 11 DOM
-
2026-05-19$79,900 Active
ⓘ Source: listings_history table (triggers on properties + properties_extension) + one-shot
backfill from property_details.listing_events for pre-trigger history.
Tax reassessment forecast NY · Partial reset (capped growth)
- Current annual tax
- $902 · $75/mo
- Projected year-2 tax
- $1,126 · $94/mo
- Expected delta
- +$224/yr (+$19/mo · 24.9%)
ⓘ Screening estimate from a state-policy table — verify with the county assessor before closing.
Climate risk First Street
- Flood 1/10 Low 0% chance over 30 yrs
- Wildfire 3/10 Moderate
- Heat 2/10 Low 7 d/yr ≥94°F today · 16 d/yr by 30 yrs out
- Wind 1/10 Low
- Air quality 2/10 Low 1 unhealthy d/yr today · 2 by 30 yrs out
Nearby sold comps map
Loading sold comps map…
Walkable amenities ~0.75 mi
Loading nearby amenities…
Taxation est. · year 1
- Rental income
- $15,598
- − Mortgage interest
- −$4,476
- − Property taxes
- −$902
- − Insurance
- −$400
- − Repairs & maintenance
- −$1,248
- − Management
- −$1,248
- − Depreciation
- −$2,324
- Taxable income
- $5,001
- Est. tax owed @ 24.0%
- −$1,200
- After-tax cash flow
- $4,793/yr
For passive investors: Depreciation is non-cash, so a rental often shows a tax loss while cash-flowing — sheltering income. Rental losses are passive: they offset passive income freely, and up to $25,000/yr can offset ordinary (W-2) income if you actively participate and your MAGI is under $100k (phasing out to $0 by $150k); unused losses carry forward. On sale, claimed depreciation is recaptured at up to 25%, and gains may owe capital-gains tax (a 1031 exchange can defer both). Figures are a year-1 estimate at your 24.0% rate — not tax advice; consult a CPA.
Condition & rehab AI · 1 photo
This well-maintained mobile home is in good condition with a good exterior and interior. It has a good curb appeal and is located in a desirable area. Minor updates to the exterior and landscaping can further enhance its value.
Value-add opportunities
- Both Paint exterior siding — Fresh paint can enhance the curb appeal and value of the home.
- Both Clean and maintain gutters — Clean gutters improve the home's appearance and prevent water damage.
- Both Upgrade landscaping — A more landscaped yard can increase both resale and rental value.
- Both Install new windows — Newer, energy-efficient windows can improve energy efficiency and increase the home's value.
- Both Update HVAC system — A modern HVAC system can improve comfort and energy efficiency, enhancing both resale and rental value.
Renovation cost estimate screening
Value-add ROI direction
- Both Paint exterior siding — Fresh paint can enhance the curb appeal and value of the home. ↑
- Both Clean and maintain gutters — Clean gutters improve the home's appearance and prevent water damage. ↑
- Both Upgrade landscaping — A more landscaped yard can increase both resale and rental value. ↑
- Both Install new windows — Newer, energy-efficient windows can improve energy efficiency and increase the home's value. ↑
- Both Update HVAC system — A modern HVAC system can improve comfort and energy efficiency, enhancing both resale and rental value. ↑
ⓘ Cost ranges are severity-bucket heuristics (US national rule-of-thumb). Get contractor quotes + a written scope before underwriting a rehab budget.
Schools (NCES district)
- District
- Holley Central School District
- NCES district ID
- 3614610
- Math proficiency
- 38% ▼ -10.00%
- Reading proficiency
- 44% ▲ 2.00%
- Median HH income
- $48,177
- Composite
- 35.13/100
- National rank
- #5013
- State rank
- #505 of 590 in NY
Livability — Holley
- Score
- 65/100
- State rank
- #705
- US rank
- #13281
Category grades
Schools grade is shown separately in the Schools card above.
Census & demographics
- Population (ZIP)
- 7,765
Population outlook (Orleans County) Hauer SSP2
- Today (2025)
- 39,123 people
- By 2030
- 37,648 · -3.8%
- By 2040
- 34,432 · -12.0%
- By 2050
- 31,487 · -19.5%
- By 2075
- 26,544 · -32.2%
- By 2100
- 22,251 · -43.1%
Race, ethnicity, and origin ACS 2023
- Neighborhood character
- Predominantly White (91%)
- Race & ethnicity
- White 91% Two or more races 4% Hispanic / Latino 3% Black 2%
- Common ancestry
- Romanian 4% Iranian 4% Lithuanian 3%
- Foreign-born
- 3% · Canada
- Languages at home
- 97% English-only · Spanish 1% Tagalog/Filipino 1% German/W. Germanic 1%
Political lean MEDSL · Orleans
- 2024 margin
- Solid R (+40.5) · D 29.8% · R 70.2%
- 2008→2024 swing
- -21.8pp toward R · 2008: -18.7pp · 2024: -40.5pp
- All cycles
- 2024: R+40.5 2020: R+36.0 2016: R+43.4 2012: R+19.4 2008: R+18.7
Not yet ingested
- Civics
- —
Market trends
- HPI YoY
- ▼ -34.80%
- Current HPI
- 287.9167
- Rent YoY
- —
- Metro
- —
- State GDP YoY
- ▲ 2.60%
- F500 in state
- 92
Industry mix (Fortune 500 HQ in NY)
| Industry | F500 HQs | Revenue |
|---|---|---|
| Financial Services | 10 | $950B |
|
||
| Consumer Goods | 9 | $162B |
|
||
| Insurance | 4 | $225B |
|
||
| Telecommunications | 2 | $144B |
|
||
| Pharmaceuticals | 2 | $112B |
|
||
| Media / Entertainment | 2 | $69B |
|
||
Price history
1 event — show timeline
- 2026-05-19 Listed $79,900 UNYREIS
Property tax history
+16.1%/yrLatest (2025): $902 · -0.2% YoY. Source: county tax records.
Cash-flow waterfall
monthlySold comps — $/sqft
last 12 mo · ≤1 miLoading sold comps…