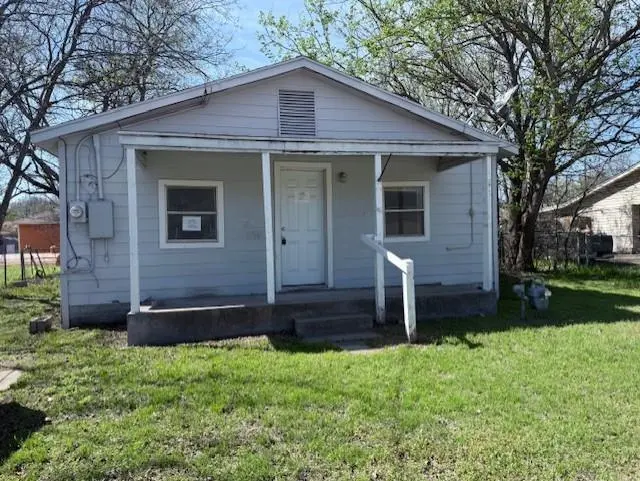
311 Elmo St · Cleburne, TX
Flood risk 1/10 · Minimal
- FEMA flood zone
- X (unshaded)
- Chance of flooding over 30 yrs
- 0.0%
- Est. flood insurance / yr
- $507 – $1,088
Fire risk 5/10 · Moderate
- Est. fire insurance / yr
- $1,222 – $2,270
Heat risk 7/10 · Major
- Hot days now (above 109°F)
- 7 days/yr
- Hot days in 30 yrs
- 24 days/yr
Wind risk 6/10 · Moderate
- Chance of severe wind over 30 yrs
- 27.0%
Air-quality risk 2/10 · Minimal
- Unhealthy air days now
- 1 days/yr
- Unhealthy air days in 30 yrs
- 2 days/yr
Risk factors via First Street. Map © Google.
Why this score? — see what drove the B- grade
The composite is a weighted blend of 9 inputs, each scored 0–100. Each bar is that input's sub-score; the figure is the points it added to the 100-point composite (weight × sub-score).
- Cash flow +30.0/30.0
- 1% rule +10.0/10.0
- DSCR +10.0/10.0
- ARV discount +7.5/15.0
- Livability +3.4/5.0
- Schools +2.9/10.0
- Rent growth +2.5/5.0
- Condition / age +2.5/5.0
- Appreciation +0.0/10.0
$69,900
🖨 Deal sheet 📄 Offer letter ✓ Due diligence
Listing remarks MLS
Calling all buyers who have dreamed of owning a home and making it their own! This could be the opportunity you’ve been waiting for. The bathroom has already been beautifully updated and finished with modern design in mind, giving you a great head start. The home sits on a generously sized lot and features an impressive, oversized storage building, providing ample additional space and flexibility. Bring your vision and imagination to see how this home can be transformed to fit your needs. Schedule your showing today! All offers must be submitted by the Buyer's agent via the RES.NET Agent Portal. If your offer is accepted, you agree to be responsible for an offer submission technology fee of $300.00. The fee will be collected and disbursed by the settlement agent and disbursed at the closing and settlement of the transaction. To submit your buyer's offer, simply click the link below. If you already have a RES.NET Agent account, you will be prompted to log in. If not, you will be prompted to create an account. To begin, click or paste this link into your web browser: https:agent.res.netOffers.aspx?-1809988
Key facts
- Generously sized lot
- Updated bathroom
- 9,278 sq ft lot
Tags
Neighborhood map
What this means for you Summary
Snapshot
- This is a 2-bed/1.0-bath single-family listed at $70k.
Deal economics
- At list price, monthly cash flow is $380 ($5k/yr) — positive.
- The deal already cash-flows at list — no discount required.
- Meets the 1% rule at list price ($1k rent vs $70k).
- Recommended offer: $66k (6.0% below list) — sets the bar for market timing.
- Cap rate 12.8% vs local median 3.6% in Cleburne — top-decile yield for the area; either an underpriced asset or a hidden risk that comps aren't pricing in. Stress-test before assuming the spread holds.
Location & tenants
- Location reads 68/100 on livability (#460 in TX) — a middle-class / working-renter tenant base. Strengths: cost of living A+, housing A+, health & safety A+; Watch: employment C-, schools F, amenities F.
- Cleburne ISD (town): math 34% / reading 33% proficiency, ranked #537 of 826 in TX (top 65%) — families likely to look elsewhere, expect single-tenant / working-renter base with shorter leases.
- Market conditions: 335 active listings in the ZIP; 7 comparable units currently listed for rent nearby; rentals leasing fast (median 7d on market — plan ~1-2 weeks tenant-placement turnaround); 2,152 units permitted in Johnson County in 2024 (76 in 5+ unit buildings).
Forward outlook
- Local home prices are declining (-3.0%/yr); year-one equity from $483 of loan paydown is wiped out by about $2k of value loss. Plan a longer hold.
- Johnson County population projected at +24% by 2050 — long-run rental-demand tailwind backs the buy-and-hold thesis.
- At projected returns (-3.0% appreciation + 3.0% rent growth), your $20k cash investment doubles in ~6 years — after that, you're playing with house money.
Negotiation context
- It's been on market 69 days — a 6% lower offer ($66k) is reasonable based on typical stale-listing flexibility.
- 4 sale attempts with the ask held roughly flat each time — persistent listings suggest the price (not the market) is what's stuck; bring a comps-based counter.
Risks & watch-outs
- Watch-outs: property tax is 3.8% of price.
- Climate carrying-cost: major wind risk, 27% chance of damaging wind over 30y; moderate wildfire risk; extreme-heat days projected 7→24/yr by 2055 (HVAC capex compounding) — expect insurance premiums to compound above CPI over the hold.
Questions for the listing agent
- It's been on market 69 days. Have you received any prior offers? Is the seller open to a 6% concession, seller financing, or rate buy-down credit?
- Built in 1965 — when were the roof, HVAC, electrical panel, plumbing, and water heater last replaced?
- Property tax is high relative to price — has the assessment been appealed recently, and will the sale trigger a re-assessment?
- Why hasn't it sold? Are there any deal-killer items the seller is aware of (foundation, flood, title, zoning, code violations)?
- Is there a deadline driving the sale (1031 exchange, divorce, estate, relocation)? That informs how much negotiation room exists.
- Schools are F-rated, which usually means shorter tenancies and higher turnover. Who's the typical renter profile here, and what's been the actual vacancy rate?
- What's the average days-on-market for RENTAL listings here right now (not sales)? A rising rental-DOM trend means longer vacancies and softer asking-rent achievability than the comps imply.
- What's the recent tenant-quality profile in this submarket — average credit score on applications, eviction rate, late-payment / NSF rate, and stable-employment percentage? A property-management company in the area should have these aggregated.
- How much new for-sale + rental construction is in the pipeline within 1–3 miles? Heavy new supply typically softens prices + rents 12–24 months out; constrained supply supports both.
Investment metrics
- 1% rule
- 1.80% ✓
- Cap rate
- 12.81%
- Cash-on-cash
- 23.29%
- DSCR
- 2.04
- GRM
- 4.6
CMA / ARV
- ARV (median comp)
- $162,261
- List price
- $69,900
- Delta
- -56.92%
- Verdict
- UNDERPRICED
- Comps
- 20 within 1.0 mi
Show comp detail 1 sale within ~0.75 mi
| Address | Dist | Beds/Ba | Sqft | Sold | Price | $/sf | Match |
|---|---|---|---|---|---|---|---|
| 1007 N Border St | 0.48mi | 2/1.0 | 820 (+13%) | 22mo | $159,000 | $194 | 38 |
Match score weights: distance 35% · size 25% · config 20% · recency 20%. Top-matched comps best support the ARV.
Projected returns pro-forma
-3.0% appreciation · 3.0% rent growth · sell at horizon
- IRR
- 16.4%
- Equity multiple
- 1.66×
- Total profit
- $12,964
- Equity at exit
- $10,422
- IRR
- 25.1%
- Equity multiple
- 3.19×
- Total profit
- $42,846
- Equity at exit
- $6,044
Cash invested: $19,572 (down + closing). Projections, not guarantees.
Landlord ↔ Tenant lean methodology
- Overall (STATE)
- 87 Strongly Landlord-Friendly
- State Texas
- 87 Strongly Landlord-Friendly · R+5
- County
- — inherits STATE
- City
- — inherits STATE
ZIP-level market 76031
- Home prices YoY
- -17.6%
- Active inventory
- 335
- Price-to-rent
- 4.6×
Monthly cashflow live
- Estimated rent
- $1,260 high interval (Pro) →
- Mortgage (P&I)
- −$367
- Tax from tax record
- −$220 /mo · $2,643/yr
- Insurance
- −$29
- HOA
- −$0
- Vacancy / Maint / Mgmt
- −$265
- Net cashflow
- $380
Break-even live
UW: 25.0% down · 7.5% · 30yr · 1.5% tax · 5.0% vac · 8.0% maint · 8.0% mgmt
Financing live
Cash to close
- Down payment
- $17,475
- Closing costs
- $2,097
- Reserves months
- —
- Total cash needed
- —
Loan-product check · same deal, 3 products live
Conventional
25% down · 7.5% · 30yr
- Down + closing
- —
- Monthly P&I
- —
- Monthly cashflow
- —
- DSCR
- —
- Eligible?
- —
Personal DTI + credit; lowest rate.
DSCR
20% down · 8.5% · 30yr
- Down + closing
- —
- Monthly P&I
- —
- Monthly cashflow
- —
- DSCR
- —
- Eligible?
- —
No personal income docs; deal must DSCR.
Hard money
10% down · 12.0% · 12mo
- Down + closing
- —
- Monthly P&I
- —
- Monthly cashflow
- —
- DSCR
- —
- Eligible?
- —
Short-term bridge; refi at stabilization.
Rent comps 7 comps
| Address | Beds | Baths | Sqft | Rent | $/sqft | DOM | Units | Dist |
|---|---|---|---|---|---|---|---|---|
| 601 Royal St Cleburne, TX | 2.0 | 1.0 | 720 | $1,300 | $1.81 | 7d | 1 | 1.12mi |
| 601 Royal St Cleburne, TX | 2.0 | 1.0 | 720 | $1,375 | $1.91 | 2d | 1 | 1.12mi |
| 601 Royal St Cleburne, TX | 2.0 | 1.0 | 720 | $1,325 | $1.84 | 43d | 1 | 1.12mi |
| 431 N Wilhite St Unit 431 Cleburne, TX | 2.0 | 1.0 | 750 | $1,195 | $1.59 | 19d | 1 | 1.13mi |
| 305 N Robinson St Cleburne, TX | 1.0 | 1.0 | 574 | $849 | $1.48 | 10d | 1 | 1.32mi |
| 305 N Robinson St Unit C, Upstairs Right Cleburne, TX | 1.0 | 1.0 | 574 | $799 | $1.39 | 3d | 1 | 1.32mi |
| 115 Cleburne Station Pkwy Cleburne, TX | 1.0–3.0 | 1.0–2.0 | 977 | $1,994 | $2.04 | 1d | 1 | 1.42mi |
Listing history 25 events
-
2026-06-18days on market $69,900 Active 69 DOM
-
2026-06-17days on market $69,900 Active 68 DOM
-
2026-06-16days on market $69,900 Active 67 DOM
-
2026-06-15days on market $69,900 Active 66 DOM
-
2026-06-13days on market $69,900 Active 64 DOM
-
2026-06-09days on market $69,900 Active 60 DOM
-
2026-06-08days on market $69,900 Active 59 DOM
-
2026-06-07days on market $69,900 Active 58 DOM
-
2026-06-04days on market $69,900 Active 55 DOM
-
2026-06-03days on market $69,900 Active 54 DOM
-
2026-06-02days on market $69,900 Active 53 DOM
-
2026-06-01days on market $69,900 Active 52 DOM
-
2026-05-31days on market $69,900 Active 51 DOM
-
2026-05-17price $69,900 1135-char remark
Show marketing remark (1135 chars)
Calling all buyers who have dreamed of owning a home and making it their own! This could be the opportunity you’ve been waiting for. The bathroom has already been beautifully updated and finished with modern design in mind, giving you a great head start. The home sits on a generously sized lot and features an impressive, oversized storage building, providing ample additional space and flexibility. Bring your vision and imagination to see how this home can be transformed to fit your needs. Schedule your showing today! All offers must be submitted by the Buyer's agent via the RES.NET Agent Portal. If your offer is accepted, you agree to be responsible for an offer submission technology fee of $300.00. The fee will be collected and disbursed by the settlement agent and disbursed at the closing and settlement of the transaction. To submit your buyer's offer, simply click the link below. If you already have a RES.NET Agent account, you will be prompted to log in. If not, you will be prompted to create an account. To begin, click or paste this link into your web browser: https:agent.res.netOffers.aspx?-1809988
-
2026-04-10$72,000 Active 1135-char remark
Show marketing remark (1135 chars)
Calling all buyers who have dreamed of owning a home and making it their own! This could be the opportunity you’ve been waiting for. The bathroom has already been beautifully updated and finished with modern design in mind, giving you a great head start. The home sits on a generously sized lot and features an impressive, oversized storage building, providing ample additional space and flexibility. Bring your vision and imagination to see how this home can be transformed to fit your needs. Schedule your showing today! All offers must be submitted by the Buyer's agent via the RES.NET Agent Portal. If your offer is accepted, you agree to be responsible for an offer submission technology fee of $300.00. The fee will be collected and disbursed by the settlement agent and disbursed at the closing and settlement of the transaction. To submit your buyer's offer, simply click the link below. If you already have a RES.NET Agent account, you will be prompted to log in. If not, you will be prompted to create an account. To begin, click or paste this link into your web browser: https:agent.res.netOffers.aspx?-1809988
-
2025-12-11$79,500 Active
-
2025-12-08historical
-
2025-11-01price $79,500
-
2025-09-26price $82,500
-
2025-09-22status Active
-
2025-07-17status Pending
-
2025-07-05historical Active Option Contract
-
2025-06-13$87,500 Active
-
2022-01-18soldstatus
-
2020-07-27soldstatus
ⓘ Source: listings_history table (triggers on properties + properties_extension) + one-shot
backfill from property_details.listing_events for pre-trigger history.
Tax reassessment forecast TX · Resets to sale price
- Current annual tax
- $2,643 · $220/mo
- Projected year-2 tax
- $2,643 · $220/mo
- Expected delta
- $0/yr ($0/mo · 0.0%)
ⓘ Screening estimate from a state-policy table — verify with the county assessor before closing.
Climate risk First Street
- Flood 1/10 Low FEMA zone X (unshaded) · 0% chance over 30 yrs
- Wildfire 5/10 Major
- Heat 7/10 Severe 7 d/yr ≥109°F today · 24 d/yr by 30 yrs out
- Wind 6/10 Major 27% chance of damaging wind over 30 yrs
- Air quality 2/10 Low 1 unhealthy d/yr today · 2 by 30 yrs out
Nearby sold comps map
Loading sold comps map…
Walkable amenities ~0.75 mi
Loading nearby amenities…
Taxation est. · year 1
- Rental income
- $15,126
- − Mortgage interest
- −$3,915
- − Property taxes
- −$2,643
- − Insurance
- −$350
- − Repairs & maintenance
- −$1,210
- − Management
- −$1,210
- − Depreciation
- −$2,033
- Taxable income
- $3,764
- Est. tax owed @ 24.0%
- −$903
- After-tax cash flow
- $3,654/yr
For passive investors: Depreciation is non-cash, so a rental often shows a tax loss while cash-flowing — sheltering income. Rental losses are passive: they offset passive income freely, and up to $25,000/yr can offset ordinary (W-2) income if you actively participate and your MAGI is under $100k (phasing out to $0 by $150k); unused losses carry forward. On sale, claimed depreciation is recaptured at up to 25%, and gains may owe capital-gains tax (a 1031 exchange can defer both). Figures are a year-1 estimate at your 24.0% rate — not tax advice; consult a CPA.
Schools (NCES district)
- District
- Cleburne ISD
- NCES district ID
- 4814310
- Math proficiency
- 34% ▼ -2.00%
- Reading proficiency
- 33% ▼ -2.00%
- Median HH income
- $48,788
- Composite
- 29.0/100
- National rank
- #6618
- State rank
- #537 of 826 in TX
Livability — Cleburne
- Score
- 68/100
- State rank
- #460
- US rank
- #9292
Category grades
Schools grade is shown separately in the Schools card above.
Census & demographics
- Census place
- Cleburne, TX
- City population
- 29,538
- Population (ZIP)
- 18,697
Population outlook (Johnson County) Hauer SSP2
- Today (2025)
- 179,678 people
- By 2030
- 189,208 · +5.3%
- By 2040
- 207,261 · +15.4%
- By 2050
- 223,064 · +24.1%
- By 2075
- 259,979 · +44.7%
- By 2100
- 275,395 · +53.3%
Race, ethnicity, and origin ACS 2023
- Neighborhood character
- Predominantly White (66%)
- Race & ethnicity
- White 66% Hispanic / Latino 28% Two or more races 12% Black 3%
- Hispanic origin (detail)
- Mexican 23% Puerto Rican 3%
- Common ancestry
- Italian 1% Lithuanian 1% Slovak 1%
- Foreign-born
- 5% · Canada, Vietnam
- Languages at home
- 77% English-only · Spanish 22% Vietnamese 0%
Political lean MEDSL · Johnson
- 2024 margin
- Solid R (+51.4) · D 23.9% · R 75.3%
- 2008→2024 swing
- -3.9pp toward R · 2008: -47.5pp · 2024: -51.4pp
- All cycles
- 2024: R+51.4 2020: R+53.0 2016: R+58.3 2012: R+55.6 2008: R+47.5
Not yet ingested
- Civics
- —
Market trends
- HPI YoY
- ▼ -59.43%
- Current HPI
- 277.598
- Rent YoY
- —
- Metro
- —
- State GDP YoY
- ▲ 3.95%
- F500 in state
- 110
Industry mix (Fortune 500 HQ in TX)
| Industry | F500 HQs | Revenue |
|---|---|---|
| Energy | 16 | $1,198B |
|
||
| Technology | 5 | $198B |
|
||
| Engineering / Construction | 4 | $72B |
|
||
| Energy Services | 3 | $60B |
|
||
| Utilities | 3 | $41B |
|
||
| Healthcare | 2 | $330B |
|
||
Price history
-20.1% since first listed12 events — show timeline
- 2026-05-17 Price Changed $69,900 NTREIS
- 2026-04-10 Listed $72,000 NTREIS
- 2025-12-11 Listed $79,500 NTREIS
- 2025-12-08 Listing Removed — NTREIS
- 2025-11-01 Price Changed $79,500 NTREIS
- 2025-09-26 Price Changed $82,500 NTREIS
- 2025-09-22 Relisted — NTREIS
- 2025-07-17 Pending — NTREIS
- 2025-07-05 Contingent — NTREIS
- 2025-06-13 Listed $87,500 NTREIS
- 2022-01-18 Sold (Public Records) — Public Records
- 2020-07-27 Sold (Public Records) — Public Records
Property tax history
+14.3%/yrLatest (2025): $2,643 · +10.8% YoY. Source: county tax records.
Cash-flow waterfall
monthlySold comps — $/sqft
last 12 mo · ≤1 miLoading sold comps…