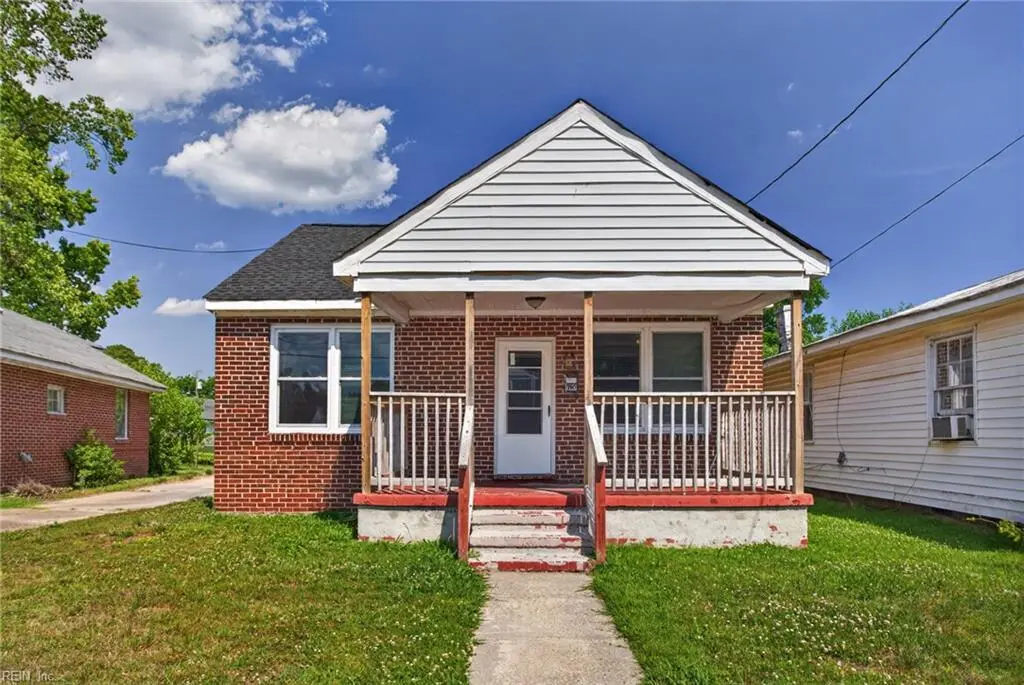
110 Halifax St · Suffolk, VA
Flood risk 1/10 · Minimal
- FEMA flood zone
- X (unshaded)
- Chance of flooding over 30 yrs
- 0.0%
- Est. flood insurance / yr
- $507 – $1,088
Fire risk 3/10 · Minor
- Est. fire insurance / yr
- $666 – $1,236
Heat risk 9/10 · Severe
- Hot days now (above 109°F)
- 7 days/yr
- Hot days in 30 yrs
- 17 days/yr
Wind risk 8/10 · Major
- Chance of severe wind over 30 yrs
- 80.0%
Air-quality risk 2/10 · Minimal
- Unhealthy air days now
- 0 days/yr
- Unhealthy air days in 30 yrs
- 1 days/yr
Risk factors via First Street. Map © Google.
Why this score? — see what drove the C grade
The composite is a weighted blend of 9 inputs, each scored 0–100. Each bar is that input's sub-score; the figure is the points it added to the 100-point composite (weight × sub-score).
- Cash flow +19.5/30.0
- ARV discount +13.3/15.0
- DSCR +6.2/10.0
- Schools +4.8/10.0
- 1% rule +4.2/10.0
- Rent growth +4.0/5.0
- Livability +3.9/5.0
- Condition / age +2.5/5.0
- Appreciation +0.0/10.0
$188,000
🖨 Deal sheet 📄 Offer letter ✓ Due diligence
Listing remarks
Welcome to 110 Halifax Street in Suffolk! This charming all-brick ranch offers 3 bedrooms, 1 full bath, and 1,038 square feet of comfortable living space. First-time homebuyers, downsizers, or investors, this home features a functional floor plan. The durable brick exterior provides timeless curb appeal and low-maintenance living. Conveniently located near shopping, dining, schools, and major routes, you'll enjoy easy access to all that Suffolk has to offer. Don't miss this opportunity to make this well-maintained home your own!
Key facts
- Easy access
- Brick exterior
- 3,920 sq ft lot
Tags
Property features AI
Finance
- HOA & community: No HOA fees
Exterior
- Parking: Driveway spaces; Street parking
- Utilities: City/County water; City/County sewer; Electric water heater; Electric power
- Home design: Detached ranch-style home; Single-story
- Construction: Crawl foundation; Asphalt shingle roof
- Exterior features: Brick and vinyl siding; Chain link fence
Interior
- Kitchen: Electric range; Refrigerator
- Bedrooms: Master bedroom; Additional bedroom; Bedroom and full bathroom on first floor
- Flooring: Laminate; Wood
- Bathrooms: 1 full bathroom
- Heating & cooling: Heat pump; Central air
- Interior features: Laminate and wood flooring; Porch; Utility closet
- Laundry & utility: Washer hookup; Dryer hookup; Utility room
Neighborhood map
What this means for you Summary
Snapshot
- This is a 3-bed/1.0-bath single-family listed at $188k.
Deal economics
- At list price, monthly cash flow is $215 ($3k/yr) — positive.
- The deal already cash-flows at list — no discount required.
- To meet the 1% rule (rent ≥ 1% of price), the offer needs to be $174k (7.6% below list).
- Recommended offer: $174k (7.6% below list) — sets the bar for 1% rule.
- Cap rate 7.7% vs local median 3.5% in Suffolk — top-decile yield for the area; either an underpriced asset or a hidden risk that comps aren't pricing in. Stress-test before assuming the spread holds.
Location & tenants
- Location reads 77/100 on livability (#88 in VA, #2,896 nationally) — a middle-class / working-renter tenant base. Strengths: housing A+, health & safety A+, employment A-; Watch: crime C-, commute F.
- Suffolk City Public School District (suburban): math 41% / reading 69% proficiency, ranked #72 of 131 in VA (top 55%) — acceptable for families but not a draw, mixed tenant base, ~2y average lease.
- Zoned schools: Mack Benn Jr. Elementary (math 27% / reading 50%, grade F, #924 of 1,108 statewide, top 84%, 684 students, 66% FRL); King'S Fork High (math 44% / reading 77%, grade C+, #244 of 319 statewide, top 77%, 1,697 students, 63% FRL) — zoned schools average 64% FRL vs 39% district-wide (25 pts higher); higher-poverty schools than district average — tighter screening recommended.
- Market conditions: Rents rising fast (+5.8%/yr); 536 active listings in the ZIP; 17 comparable units currently listed for rent nearby; rentals lingering (median 44d on market — plan ~5-8 weeks vacancy on turnover, expect pricing pressure); 53% of comp listings sitting > 30 days — soft ceiling on asking rent; solid renter incomes; 680 units permitted in Suffolk city in 2024 (0 in 5+ unit buildings).
Forward outlook
- Local home prices are declining (-3.0%/yr); year-one equity from $1k of loan paydown is wiped out by about $6k of value loss. Plan a longer hold.
- Suffolk County population projected at +11% by 2050 — modest demand growth; plan on rents tracking national, not racing it.
Negotiation context
- Only 6 days on market — expect competitive offers; lowballing is unlikely to land.
- Current owner paid $35k; list at $188k implies a 437% gain — meaningful room to come down on a strong offer.
Risks & watch-outs
- Watch-outs: built in 1946 — expect roof / HVAC / electrical / plumbing capex.
- Climate carrying-cost: severe wind risk, 80% chance of damaging wind over 30y; extreme-heat days projected 7→17/yr by 2055 (HVAC capex compounding) — expect insurance premiums to compound above CPI over the hold.
Questions for the listing agent
- Built in 1946 — when were the roof, HVAC, electrical panel, plumbing, and water heater last replaced?
- Is there a deadline driving the sale (1031 exchange, divorce, estate, relocation)? That informs how much negotiation room exists.
- Schools are A-rated — typically a magnet for longer-tenancy family renters. What's the average tenant stay here, and is there a school-zone premium baked into asking?
- What's the average days-on-market for RENTAL listings here right now (not sales)? A rising rental-DOM trend means longer vacancies and softer asking-rent achievability than the comps imply.
- What's the recent tenant-quality profile in this submarket — average credit score on applications, eviction rate, late-payment / NSF rate, and stable-employment percentage? A property-management company in the area should have these aggregated.
- How much new for-sale + rental construction is in the pipeline within 1–3 miles? Heavy new supply typically softens prices + rents 12–24 months out; constrained supply supports both.
Investment metrics
- 1% rule
- 0.92% ✗
- Cap rate
- 7.66%
- Cash-on-cash
- 4.89%
- DSCR
- 1.22
- GRM
- 9.0
CMA / ARV
- ARV (on-the-fly)
- $215,904
- Comps found
- 12
Show comp detail 12 sales within ~0.75 mi
| Address | Dist | Beds/Ba | Sqft | Sold | Price | $/sf | Match |
|---|---|---|---|---|---|---|---|
| 111 S Lloyd St | 0.16mi | 3/1.0 | 1,008 (-3%) | 5mo | $189,000 | $188 | 83 |
| 226 N 4th St | 0.32mi | 3/2.0 | 1,022 (-2%) | 2mo | $222,000 | $217 | 77 |
| 301 Goodman St | 0.44mi | 3/1.0 | 1,053 (+1%) | 1mo | $125,000 | $119 | 76 |
| 215 N Capital St | 0.24mi | 3/1.0 | 1,140 (+10%) | 2mo | $90,000 | $79 | 71 |
| 341 N 5th St | 0.53mi | 3/1.0 | 1,100 (+6%) | 1mo | $220,000 | $200 | 64 |
| 123 Walnut St | 0.16mi | 2/1.0 (-1) | 896 (-14%) | 0mo | $219,000 | $244 | 64 |
| 118 Walnut St | 0.15mi | 3/1.5 | 1,176 (+13%) | 7mo | $80,000 | $68 | 63 |
| 200 N Capital St | 0.23mi | 3/2.0 | 1,184 (+14%) | 2mo | $253,000 | $214 | 60 |
| 1010 Truman Rd | 0.57mi | 3/1.5 | 1,100 (+6%) | 3mo | $229,000 | $208 | 59 |
| 1812 Freeney Ave | 0.66mi | 3/1.0 | 1,166 (+12%) | 1mo | $450,000 | $386 | 47 |
| 121 S 10th St | 0.59mi | 3/2.0 | 892 (-14%) | 0mo | $220,000 | $247 | 45 |
| 310 Fuller St | 0.68mi | 2/1.0 (-1) | 900 (-13%) | 3mo | $115,000 | $128 | 38 |
Match score weights: distance 35% · size 25% · config 20% · recency 20%. Top-matched comps best support the ARV.
Projected returns pro-forma
-3.0% appreciation · 5.84% rent growth · sell at horizon
- IRR
- -5.9%
- Equity multiple
- 0.78×
- Total profit
- $-11,755
- Equity at exit
- $28,031
- IRR
- 6.7%
- Equity multiple
- 1.56×
- Total profit
- $29,311
- Equity at exit
- $16,255
Cash invested: $52,640 (down + closing). Projections, not guarantees.
Landlord ↔ Tenant lean methodology
- Overall (STATE)
- 55 Moderately Landlord-Leaning
- State Virginia
- 55 Moderately Landlord-Leaning · D+2
- County
- — inherits STATE
- City
- — inherits STATE
ZIP-level market 23434
- Rents YoY
- 5.8%
- Active inventory
- 536
- Price-to-rent
- 9.0×
Monthly cashflow live
- Estimated rent
- $1,736 high interval (Pro) →
- Mortgage (P&I)
- −$986
- Tax from tax record
- −$93 /mo · $1,115/yr
- Insurance
- −$78
- HOA
- −$0
- Vacancy / Maint / Mgmt
- −$365
- Net cashflow
- $215
Break-even live
UW: 25.0% down · 7.5% · 30yr · 1.5% tax · 5.0% vac · 8.0% maint · 8.0% mgmt
Financing live
Cash to close
- Down payment
- $47,000
- Closing costs
- $5,640
- Reserves months
- —
- Total cash needed
- —
Loan-product check · same deal, 3 products live
Conventional
25% down · 7.5% · 30yr
- Down + closing
- —
- Monthly P&I
- —
- Monthly cashflow
- —
- DSCR
- —
- Eligible?
- —
Personal DTI + credit; lowest rate.
DSCR
20% down · 8.5% · 30yr
- Down + closing
- —
- Monthly P&I
- —
- Monthly cashflow
- —
- DSCR
- —
- Eligible?
- —
No personal income docs; deal must DSCR.
Hard money
10% down · 12.0% · 12mo
- Down + closing
- —
- Monthly P&I
- —
- Monthly cashflow
- —
- DSCR
- —
- Eligible?
- —
Short-term bridge; refi at stabilization.
Rent comps 17 comps
| Address | Beds | Baths | Sqft | Rent | $/sqft | DOM | Units | Dist |
|---|---|---|---|---|---|---|---|---|
| 326 E Washington St Suffolk, VA | 2.0 | 2.0 | 839 | $1,629 | $1.94 | 2d | 1 | 0.38mi |
| 223 N 7th St Suffolk, VA | 3.0 | 2.5 | 1495 | $2,300 | $1.54 | 43d | 1 | 0.47mi |
| 214 N 7th St Unit NA Suffolk, VA | 2.0 | 1.0 | 760 | $1,500 | $1.97 | 23d | 1 | 0.48mi |
| 116 Franklin St Unit 3 Suffolk, VA | 3.0 | 1.0 | 1335 | $1,750 | $1.31 | 43d | 1 | 0.52mi |
| 116 Franklin St Suffolk, VA | 3.0 | 1.0 | 1335 | $1,750 | $1.31 | 23d | 1 | 0.52mi |
| 307 Central Ave Suffolk, VA | 3.0 | 1.0 | 840 | $1,700 | $2.02 | 43d | 1 | 0.56mi |
| 120 S 10th St Suffolk, VA | 2.0 | 1.0 | 736 | $1,250 | $1.70 | 43d | 1 | 0.63mi |
| 181 N Main St Suffolk, VA | 2.0 | 1.0–2.0 | 804 | $1,885 | $2.34 | 1d | 15 | 0.69mi |
| 210 Baker St Suffolk, VA | 3.0 | 1.0 | 988 | $1,600 | $1.62 | 43d | 1 | 1.01mi |
| 310 Greenfield Cres Suffolk, VA | 3.0 | 2.0 | 1146 | $1,995 | $1.74 | 43d | 1 | 1.08mi |
| 308 Saint James Ave Unit B Suffolk, VA | 2.0 | 1.0 | 936 | $1,295 | $1.38 | 23d | 1 | 1.09mi |
| 1410 Blythewood Ln Suffolk, VA | 4.0 | 1.5 | 1056 | $1,800 | $1.70 | 43d | 1 | 1.23mi |
| 558 1st Ave Suffolk, VA | 2.0 | 1.5 | 1000 | $1,250 | $1.25 | 43d | 1 | 1.24mi |
| 564 1st Ave Suffolk, VA | 2.0 | 1.0 | 1000 | $1,100 | $1.10 | 43d | 1 | 1.24mi |
| 410 Bosley Ave Unit B Suffolk, VA | 2.0 | 1.0 | 850 | $1,095 | $1.29 | 10d | 1 | 1.30mi |
| 114 Nancy Dr Suffolk, VA | 2.0–3.0 | 1.0 | 860 | $1,450 | $1.69 | 1d | 4 | 1.31mi |
| 806 W Washington St Unit 112 Suffolk, VA | 2.0 | 2.0 | 900 | $1,325 | $1.47 | 17d | 1 | 1.42mi |
Listing history 6 events
-
2026-06-18days on market $188,000 Active 6 DOM
-
2026-06-17days on market $188,000 Active 5 DOM
-
2026-06-16days on market $188,000 Active 4 DOM
-
2026-06-15days on market $188,000 Active 3 DOM
-
2026-06-13remarks 534-char remark
-
2026-06-13$188,000 Active 1 DOM
ⓘ Source: listings_history table (triggers on properties + properties_extension) + one-shot
backfill from property_details.listing_events for pre-trigger history.
Tax reassessment forecast VA · Resets to sale price
- Current annual tax
- $1,115 · $93/mo
- Projected year-2 tax
- $1,542 · $128/mo
- Expected delta
- +$427/yr (+$36/mo · 38.3%)
ⓘ Screening estimate from a state-policy table — verify with the county assessor before closing.
Climate risk First Street
- Flood 1/10 Low FEMA zone X (unshaded) · 0% chance over 30 yrs
- Wildfire 3/10 Moderate
- Heat 9/10 Extreme 7 d/yr ≥109°F today · 17 d/yr by 30 yrs out
- Wind 8/10 Severe 80% chance of damaging wind over 30 yrs
- Air quality 2/10 Low 0 unhealthy d/yr today · 1 by 30 yrs out
Nearby sold comps map
Loading sold comps map…
Walkable amenities ~0.75 mi
Loading nearby amenities…
Taxation est. · year 1
- Rental income
- $20,837
- − Mortgage interest
- −$10,531
- − Property taxes
- −$1,115
- − Insurance
- −$940
- − Repairs & maintenance
- −$1,667
- − Management
- −$1,667
- − Depreciation
- −$5,469
- Taxable loss
- −$552
- Est. tax savings @ 24.0%
- +$133
- After-tax cash flow
- $2,708/yr
For passive investors: Depreciation is non-cash, so a rental often shows a tax loss while cash-flowing — sheltering income. Rental losses are passive: they offset passive income freely, and up to $25,000/yr can offset ordinary (W-2) income if you actively participate and your MAGI is under $100k (phasing out to $0 by $150k); unused losses carry forward. On sale, claimed depreciation is recaptured at up to 25%, and gains may owe capital-gains tax (a 1031 exchange can defer both). Figures are a year-1 estimate at your 24.0% rate — not tax advice; consult a CPA.
Schools (NCES district)
- District
- Suffolk City Public School District
- NCES district ID
- 5103710
- Math proficiency
- 41% ▼ -43.00%
- Reading proficiency
- 69% ▼ -8.00%
- Median HH income
- $65,573
- Composite
- 48.31/100
- National rank
- #2151
- State rank
- #72 of 131 in VA
Livability — Suffolk
- Score
- 77/100
- State rank
- #88
- US rank
- #2896
Category grades
Schools grade is shown separately in the Schools card above.
Census & demographics
- Census place
- Suffolk, VA
- County
- Suffolk City · 88,108 people
- City population
- 88,108
- Metro
- Virginia Beach-Norfolk-Newport News, VA-NC
- Population (ZIP)
- 54,387
- Household income
- $79,877
- Rent vs Own
- Severe rent burden
- 1934.0
Population outlook (Suffolk County) Hauer SSP2
- Today (2025)
- 95,269 people
- By 2030
- 98,269 · +3.1%
- By 2040
- 103,177 · +8.3%
- By 2050
- 105,777 · +11.0%
- By 2075
- 110,963 · +16.5%
- By 2100
- 103,711 · +8.9%
Race, ethnicity, and origin ACS 2023
- Neighborhood character
- Diverse neighborhood (Simpson 0.58)
- Race & ethnicity
- Black 49% White 41% Two or more races 5% Hispanic / Latino 4% Asian 1%
- Common ancestry
- Lithuanian 1% Slovak 1% Italian 1%
- Foreign-born
- 3% · Canada
- Languages at home
- 96% English-only · Spanish 2%
Political lean MEDSL · Suffolk
- 2024 margin
- D (+15.9) · D 57.4% · R 41.5% · Other 1.2%
- 2008→2024 swing
- +2.7pp toward D · 2008: 13.2pp · 2024: 15.9pp
- All cycles
- 2024: D+15.9 2020: D+17.3 2016: D+13.8 2012: D+15.1 2008: D+13.2
Not yet ingested
- Civics
- —
Market trends
- HPI YoY
- ▼ -383.80%
- Current HPI
- 158.5866
- Rent YoY
- ▲ 5.84%
- Metro
- Virginia Beach-Norfolk-Newport News, VA-NC
- State GDP YoY
- ▲ 2.40%
- F500 in state
- 50
Industry mix (Fortune 500 HQ in VA)
| Industry | F500 HQs | Revenue |
|---|---|---|
| Aerospace / Defense | 4 | $236B |
|
||
| Technology / Defense | 3 | $32B |
|
||
| Financial Services | 2 | $176B |
|
||
| Utilities | 2 | $27B |
|
||
| Insurance | 2 | $25B |
|
||
| Technology | 2 | $15B |
|
||
Price history
+437.1% since first listed2 events — show timeline
- 2026-06-12 Listed $188,000 REINMLS
- 2022-12-07 Sold (Public Records) $35,000 Public Records
Property tax history
+4.8%/yrLatest (2025): $1,115 · +2.9% YoY. Source: county tax records.
Cash-flow waterfall
monthlySold comps — $/sqft
last 12 mo · ≤1 miLoading sold comps…