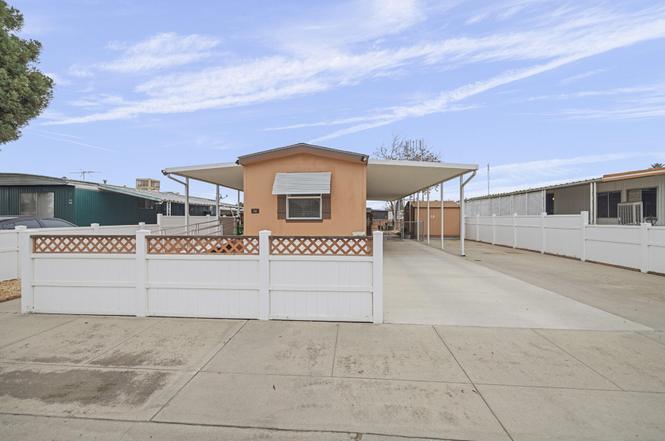
560 W Pleasant Ave #16 · Tulare, CA
Flood risk 1/10 · Minimal
- FEMA flood zone
- X (unshaded)
- Chance of flooding over 30 yrs
- 0.0%
- Est. flood insurance / yr
- $507 – $1,088
Fire risk 5/10 · Moderate
- Est. fire insurance / yr
- $659 – $1,223
Heat risk 7/10 · Major
- Hot days now (above 106°F)
- 7 days/yr
- Hot days in 30 yrs
- 16 days/yr
Wind risk 1/10 · Minimal
- Chance of severe wind over 30 yrs
- —
Air-quality risk 10/10 · Severe
- Unhealthy air days now
- 36 days/yr
- Unhealthy air days in 30 yrs
- 39 days/yr
Risk factors via First Street. Map © Google.
Why this score? — see what drove the B- grade
The composite is a weighted blend of 9 inputs, each scored 0–100. Each bar is that input's sub-score; the figure is the points it added to the 100-point composite (weight × sub-score).
- Cash flow +30.0/30.0
- 1% rule +10.0/10.0
- DSCR +10.0/10.0
- ARV discount +7.5/15.0
- Rent growth +3.2/5.0
- Schools +3.0/10.0
- Livability +2.9/5.0
- Condition / age +2.5/5.0
- Appreciation +0.0/10.0
$49,999
🖨 Deal sheet (PDF) 📄 Offer letter ✓ Due diligence
Listing remarks MLS
Clean single wide 2 bed 1 bath manufactured home in the 55+ Royals Palms Park. 2 storage sheds & extra cement for parking. The washer, dryer and refrigerator come with the home! The park offers a community pool and clubhouse to be renovated soon!
Key facts
- Ample cabinetry
- Newer mobile home
- Functional layout
Tags
Property features AI
Exterior
- Parking: Attached parking; Attached carport
- Utilities: Private water; Private sewer; Electricity connected; Natural gas connected and available; Water connected; Sewer connected
- Home design: Manufactured in park (manufactured home, single wide); Faces west
- Construction: Composition roof; Vinyl skirting; Model: Creekside Manor - CM 2562L; Mobile width 134, mobile length 56
- Exterior features: Front porch; Pillar/post/pier foundation
Interior
- Flooring: Carpet; Linoleum
- Bathrooms: One full bathroom
- Heating & cooling: Central heating; Central air conditioning
- Interior features: Carpet and linoleum flooring; Accessible entrance and doors; Accessible approach with ramp and grip-accessible features
Neighborhood map
What this means for you Summary
Snapshot
- This is a 2-bed/1.0-bath land listed at $50k.
Deal economics
- At list price, monthly cash flow is $693 ($8k/yr) — positive.
- The deal already cash-flows at list — no discount required.
- Meets the 1% rule at list price ($1k rent vs $50k).
- Recommended offer: $44k (12.0% below list) — sets the bar for market timing.
- Cap rate 22.9% vs local median 3.3% in Tulare — top-decile yield for the area; either an underpriced asset or a hidden risk that comps aren't pricing in. Stress-test before assuming the spread holds.
Location & tenants
- Location reads 58/100 on livability (#701 in CA) — a working-class tenant base; expect higher turnover. Strengths: housing A+; Watch: commute C-, employment D+, schools D-.
- Tulare Joint Union High (suburban): math 18% / reading 52% proficiency, ranked #280 of 517 in CA (top 54%) — families likely to look elsewhere, expect single-tenant / working-renter base with shorter leases.
- Market conditions: Rents rising (+2.7%/yr); 355 active listings in the ZIP; 5 comparable units currently listed for rent nearby; rentals at typical pace (median 15d on market — plan ~3-4 weeks tenant-placement turnaround); 1,447 units permitted in Tulare County in 2024 (307 in 5+ unit buildings).
Forward outlook
- Local home prices are declining (-3.0%/yr); year-one equity from $345 of loan paydown is wiped out by about $2k of value loss. Plan a longer hold.
- Tulare County population projected at +10% by 2050 — modest demand growth; plan on rents tracking national, not racing it.
- At projected returns (-3.0% appreciation + 2.7% rent growth), your $14k cash investment doubles in ~2 years — after that, you're playing with house money.
Negotiation context
- It's been on market 184 days — a 12% lower offer ($44k) is reasonable based on typical stale-listing flexibility.
- 2 sale attempts since 4y ago; this cycle's ask has dropped $15k (23%) from the opening price — seller is motivated, your offer sets the floor, not the list.
- Current owner paid $39k; 28% above their basis — modest negotiation headroom, anchor on the comps not their cost.
Risks & watch-outs
- Climate carrying-cost: moderate wildfire risk; extreme-heat days projected 7→16/yr by 2055 (HVAC capex compounding) — expect insurance premiums to compound above CPI over the hold.
Questions for the listing agent
- It's been on market 184 days. Have you received any prior offers? Is the seller open to a 12% concession, seller financing, or rate buy-down credit?
- Why hasn't it sold? Are there any deal-killer items the seller is aware of (foundation, flood, title, zoning, code violations)?
- Is there a deadline driving the sale (1031 exchange, divorce, estate, relocation)? That informs how much negotiation room exists.
- Schools are D-rated, which usually means shorter tenancies and higher turnover. Who's the typical renter profile here, and what's been the actual vacancy rate?
- Crime grade is F in this area — have there been break-ins, vandalism, or insurance claims at this property in the last 3 years? What carrier currently insures it and at what premium?
- What's the average days-on-market for RENTAL listings here right now (not sales)? A rising rental-DOM trend means longer vacancies and softer asking-rent achievability than the comps imply.
- What's the recent tenant-quality profile in this submarket — average credit score on applications, eviction rate, late-payment / NSF rate, and stable-employment percentage? A property-management company in the area should have these aggregated.
- How much new for-sale + rental construction is in the pipeline within 1–3 miles? Heavy new supply typically softens prices + rents 12–24 months out; constrained supply supports both.
Investment metrics
- 1% rule
- 2.63% ✓
- Cap rate
- 22.91%
- Cash-on-cash
- 59.36%
- DSCR
- 3.64
- GRM
- 3.2
CMA / ARV
No comps found within radius.
Projected returns pro-forma
-3.0% appreciation · 2.67% rent growth · sell at horizon
- IRR
- 57.7%
- Equity multiple
- 3.54×
- Total profit
- $35,591
- Equity at exit
- $7,455
- IRR
- 62.4%
- Equity multiple
- 7.15×
- Total profit
- $86,097
- Equity at exit
- $4,323
Cash invested: $14,000 (down + closing). Projections, not guarantees.
Landlord ↔ Tenant lean methodology
- Overall (STATE)
- 18 Strongly Tenant-Friendly
- State California
- 18 Strongly Tenant-Friendly · D+13
- County
- — inherits STATE
- City
- — inherits STATE
ZIP-level market 93274
- Rents YoY
- 2.7%
- Active inventory
- 355
- Price-to-rent
- 3.2×
Monthly cashflow live
- Estimated rent
- $1,314 high interval (Pro) →
- Mortgage (P&I)
- −$262
- Tax est. 1.5%
- −$62 /mo · $750/yr
- Insurance
- −$21
- HOA
- −$0
- Vacancy / Maint / Mgmt
- −$276
- Net cashflow
- $693
Break-even live
Sensitivity live
| Price | -10% $727 | -5% $710 | +0% $693 | +5% $675 | +10% $658 |
|---|---|---|---|---|---|
| Rent | -10% $589 | -5% $641 | +0% $693 | +5% $744 | +10% $796 |
| Rate | -1.0pp $718 | -0.5pp $705 | base $693 | +0.5pp $680 | +1.0pp $666 |
UW: 25.0% down · 7.5% · 30yr · 1.5% tax · 5.0% vac · 8.0% maint · 8.0% mgmt
Financing live
Cash to close
- Down payment
- $12,500
- Closing costs
- $1,500
- Reserves months
- —
- Total cash needed
- —
Loan-product check · same deal, 3 products live
Conventional
25% down · 7.5% · 30yr
- Down + closing
- —
- Monthly P&I
- —
- Monthly cashflow
- —
- DSCR
- —
- Eligible?
- —
Personal DTI + credit; lowest rate.
DSCR
20% down · 8.5% · 30yr
- Down + closing
- —
- Monthly P&I
- —
- Monthly cashflow
- —
- DSCR
- —
- Eligible?
- —
No personal income docs; deal must DSCR.
Hard money
10% down · 12.0% · 12mo
- Down + closing
- —
- Monthly P&I
- —
- Monthly cashflow
- —
- DSCR
- —
- Eligible?
- —
Short-term bridge; refi at stabilization.
Rent comps 5 comps
| Address | Beds | Baths | Sqft | Rent | $/sqft | DOM | Units | Dist |
|---|---|---|---|---|---|---|---|---|
| 104 W Oakland Ave Unit d Tulare, CA | 1.0 | 1.0 | 800 | $875 | $1.09 | 15d | 1 | 0.28mi |
| 1255 N H St Tulare, CA | 2.0 | 1.0 | 700 | $1,250 | $1.79 | 14d | 1 | 0.48mi |
| 648 Auburn St Tulare, CA | 2.0 | 1.0 | 1000 | $1,400 | $1.40 | 22d | 1 | 1.03mi |
| 656 E Prosperity Ave Tulare, CA | 2.0 | 1.0 | 873 | $1,500 | $1.72 | 14d | 2 | 1.14mi |
| 425 Center St Tulare, CA | 1.0 | 1.0 | 650 | $1,095 | $1.68 | 15d | 1 | 1.43mi |
Listing history 23 events
-
2026-06-21pricedays on market $49,999 Active 184 DOM
-
2026-06-18days on market $54,999 Active 181 DOM
-
2026-06-17days on market $54,999 Active 180 DOM
-
2026-06-16days on market $54,999 Active 179 DOM
-
2026-06-15days on market $54,999 Active 178 DOM
-
2026-06-14days on market $54,999 Active 176 DOM
-
2026-06-13days on market $54,999 Active 175 DOM
-
2026-06-10days on market $54,999 Active 173 DOM
-
2026-06-09days on market $54,999 Active 172 DOM
-
2026-06-08days on market $54,999 Active 171 DOM
-
2026-06-07days on market $54,999 Active 170 DOM
-
2026-06-05days on market $54,999 Active 167 DOM
-
2026-06-03days on market $54,999 Active 166 DOM
-
2026-06-02days on market $54,999 Active 165 DOM
-
2026-06-01days on market $54,999 Active 164 DOM
-
2026-05-31days on market $54,999 Active 163 DOM
-
2026-05-30days on market $54,999 Active 162 DOM
-
2026-04-20price $57,999
-
2026-01-31price $59,999
-
2025-12-19$64,999 Active
-
2022-07-01soldstatus $39,000 Closed 253-char remark
Show marketing remark (253 chars)
Clean single wide 2 bed 1 bath manufactured home in the 55+ Royals Palms Park. 2 storage sheds & extra cement for parking. The washer, dryer and refrigerator come with the home! The park offers a community pool and clubhouse to be renovated soon!
-
2022-04-06historical 253-char remark
Show marketing remark (253 chars)
Clean single wide 2 bed 1 bath manufactured home in the 55+ Royals Palms Park. 2 storage sheds & extra cement for parking. The washer, dryer and refrigerator come with the home! The park offers a community pool and clubhouse to be renovated soon!
-
2022-03-23$39,000 253-char remark
Show marketing remark (253 chars)
Clean single wide 2 bed 1 bath manufactured home in the 55+ Royals Palms Park. 2 storage sheds & extra cement for parking. The washer, dryer and refrigerator come with the home! The park offers a community pool and clubhouse to be renovated soon!
ⓘ Source: listings_history table (triggers on properties + properties_extension) + one-shot
backfill from property_details.listing_events for pre-trigger history.
Climate risk First Street
- Flood 1/10 Low FEMA zone X (unshaded) · 0% chance over 30 yrs
- Wildfire 5/10 Major
- Heat 7/10 Severe 7 d/yr ≥106°F today · 16 d/yr by 30 yrs out
- Wind 1/10 Low
- Air quality 10/10 Extreme 36 unhealthy d/yr today · 39 by 30 yrs out
Nearby sold comps map
Loading sold comps map…
Walkable amenities ~0.75 mi
Loading nearby amenities…
Taxation est. · year 1
- Rental income
- $15,768
- − Mortgage interest
- −$2,801
- − Property taxes
- −$750
- − Insurance
- −$250
- − Repairs & maintenance
- −$1,261
- − Management
- −$1,261
- − Depreciation
- −$1,455
- Taxable income
- $7,990
- Est. tax owed @ 24.0%
- −$1,918
- After-tax cash flow
- $6,393/yr
For passive investors: Depreciation is non-cash, so a rental often shows a tax loss while cash-flowing — sheltering income. Rental losses are passive: they offset passive income freely, and up to $25,000/yr can offset ordinary (W-2) income if you actively participate and your MAGI is under $100k (phasing out to $0 by $150k); unused losses carry forward. On sale, claimed depreciation is recaptured at up to 25%, and gains may owe capital-gains tax (a 1031 exchange can defer both). Figures are a year-1 estimate at your 24.0% rate — not tax advice; consult a CPA.
Schools (NCES district)
- District
- Tulare Joint Union High
- NCES district ID
- 0639930
- Math proficiency
- 18% ▼ -6.00%
- Reading proficiency
- 52% ▼ -1.00%
- Median HH income
- $46,858
- Composite
- 29.91/100
- National rank
- #6384
- State rank
- #280 of 517 in CA
Livability — Tulare
- Score
- 58/100
- State rank
- #701
- US rank
- #21185
Category grades
Schools grade is shown separately in the Schools card above.
Census & demographics
- Census place
- Tulare, CA
- County
- Tulare County · 323,826 people
- City population
- 80,026
- Metro
- Visalia, CA
- Population (ZIP)
- 80,026
- Household income
- $72,650
- Rent vs Own
- Severe rent burden
- 2393.0
Population outlook (Tulare County) Hauer SSP2
- Today (2025)
- 484,681 people
- By 2030
- 496,241 · +2.4%
- By 2040
- 518,507 · +7.0%
- By 2050
- 534,920 · +10.4%
- By 2075
- 548,417 · +13.2%
- By 2100
- 513,085 · +5.9%
Race, ethnicity, and origin ACS 2023
- Neighborhood character
- Majority Hispanic (64%)
- Race & ethnicity
- Hispanic / Latino 64% White 29% Two or more races 24% Asian 2% Black 2%
- Hispanic origin (detail)
- Mexican 60%
- Common ancestry
- Russian 7% Iranian 1% Italian 1%
- Foreign-born
- 19% · Canada, Vietnam
- Languages at home
- 52% English-only · Spanish 42% Other Indo-European 3% Other Asian/Pacific 1%
Political lean MEDSL · Tulare
- 2024 margin
- Strong R (+20.7) · D 38.5% · R 59.2% · Other 2.3%
- 2008→2024 swing
- -5.4pp toward R · 2008: -15.3pp · 2024: -20.7pp
- All cycles
- 2024: R+20.7 2020: R+7.8 2016: R+12.1 2012: R+17.8 2008: R+15.3
Not yet ingested
- Civics
- —
Market trends
- HPI YoY
- ▼ -402.03%
- Current HPI
- 316.0806
- Rent YoY
- ▲ 2.67%
- Metro
- Visalia, CA
- State GDP YoY
- ▲ 3.21%
- F500 in state
- 116
Industry mix (Fortune 500 HQ in CA)
| Industry | F500 HQs | Revenue |
|---|---|---|
| Technology | 27 | $1,492B |
|
||
| Financial Services | 3 | $174B |
|
||
| Retail | 3 | $44B |
|
||
| Insurance | 3 | $26B |
|
||
| Media / Entertainment | 2 | $115B |
|
||
| Pharmaceuticals / Biotech | 2 | $62B |
|
||
Price history
+48.7% since first listed6 events — show timeline
- 2026-04-20 Price Changed $57,999 TCMLS
- 2026-01-31 Price Changed $59,999 TCMLS
- 2025-12-19 Listed $64,999 TCMLS
- 2022-07-01 Sold (MLS) $39,000 TCMLS
- 2022-04-06 Delisted — TCMLS
- 2022-03-23 Listed $39,000 TCMLS
Property tax history
+0.2%/yrLatest (2017): $43 · +2.9% YoY. Source: county tax records.
Cash-flow waterfall
monthlySold comps — $/sqft
last 12 mo · ≤1 miLoading sold comps…